OpenStreetMap

dekstop's Diary

Recent diary entries

So I completed a PhD on community engagement in HOT and Missing Maps...

Posted by dekstop on 15 September 2019 in English. Last updated on 20 September 2019.

… two years ago, and I haven’t even managed to write a diary entry about it. Has it really been that long? I’ve been meaning to post a summary for the longest time, but somehow life got in the way. Fortunately, this week David Garcia and me will host a workshop at the HOT Summit and present a talk at State of the Map in Heidelberg. I’m super excited about both sessions – you should join us if you’re coming! And it became the perfect excuse to dust off my draft for this post, and make sure all the research outcomes are finally assembled in one place.

But let me start in the beginning.

Hallo, my name is Martin Dittus, and between 2014 and 2017 I’ve accompanied HOT and Missing Maps for my PhD on community engagement in humanitarian mapping. We’ve had an amazing time together! During the PhD, we were trying to understand how best to build HOT volunteer capacity online and offline. How can we best train our volunteers so that they are available when needed? What kinds of support can we give them to ensure they don’t drop out early? And the age-old question: are the most highly engaged contributors “born or made”?
HOT’s diversity of settings provided excellent opportunities to observe the outcomes of different coordination practices. The research was largely quantitative and observational, using data in the full OSM contribution history and the HOT tasking manager, combined with a lot of prep work to understand the nuances. This was very much a collaborative effort and a real partnership with quite a few groups and individuals in the OSM and HOT community, and the evaluations were always informed by real concerns in the community. I was blessed to find an incredibly active community in London, and made some great friends along the way. It made a massive difference that early on I met Pete Masters and Andrew Braye who then connected me to many others in the vast global network of enthusiasts and experts that is HOT. In addition to looking for answers to pressing organiser issues, we revisited some existing theories in social and behavioural science in the context of HOT, using statistical methods to analyse contribution activity across multiple years of HOT’s edit history.

We could demonstrate that coordination practices can have a marked impact on volunteer activity and retention, and the work has already achieved quite some impact within and beyond HOT. I’ve been using this OSM diary to document my research progress since 2015. Over time this has lead to significant debate and reflection within the HOT community, and on more than one occasion it has informed specific changes in organiser practice. In addition, four studies have been published in major academic venues, and two of them have received awards. We couldn’t have done any of this without a lot of community support!

A very rough summary

So, coming back to the opening questions – are the most highly engaged contributors “born or made”? As you may expect, the answer is “yes” :)
To paraphrase the conclusion section of the dissertation, sustained community engagement is only partially a matter of optimising the contribution process. Overall it appears that a pursuit of indiscriminate community growth would likely be an inefficient use of organiser resources, in part because it seems unlikely that prolific mappers can be “created” by a particular process, and instead many will drop out early. Instead, other factors beyond the contribution process are likely just as important. This includes factors relating to the individual person, such as their interests and prior experience, and factors relating to their participation context, such as the presence of a supportive community that organises regular activities. However, the evidence also suggests that newcomers who are likely to become highly engaged can be discovered, for example through public events like mapathons and the promotion of major mapping actions, and these newcomers may then need some support in order to get started.

Publications

If you’re curious you can read the full dissertation here: Analysing Volunteer Engagement in Humanitarian Crowdmapping (PDF). However I don’t expect many would want to read it in full, so for the impatient it may suffice to read the abstract on page 5, and the concluding summary chapter from page 151, in particular the summary of findings from page 153. (This by the way is often the best way to read academic papers: read the abstract to see if you like the paper, then read the conclusion to get the summary. You could then read the full paper if you’re still curious about the details.)

The bulk of the thesis simply reproduces four papers that were published during the PhD, you can also get those separately. They’ve already been discussed in this diary in various forms, typically while the work was still in progress ([1], [2], [3], [4], [5]). It’s interesting to revisit the work now with some distance – you can really see a progression in the quality of execution. The papers are, in order of publication:

Analysing volunteer engagement in humanitarian mapping: building contributor communities at large scale (PDF). This is maybe quite a rough paper in terms of the quality of execution, but to this day it’s somehow the most widely cited one. Likely because it was one of the few quantitative studies of HOT at the time. I now think of it as an early exploratory study that establishes some basic concerns. A key finding: maybe unsurprisingly, it appears that complex task designs can be discouraging to newcomers.

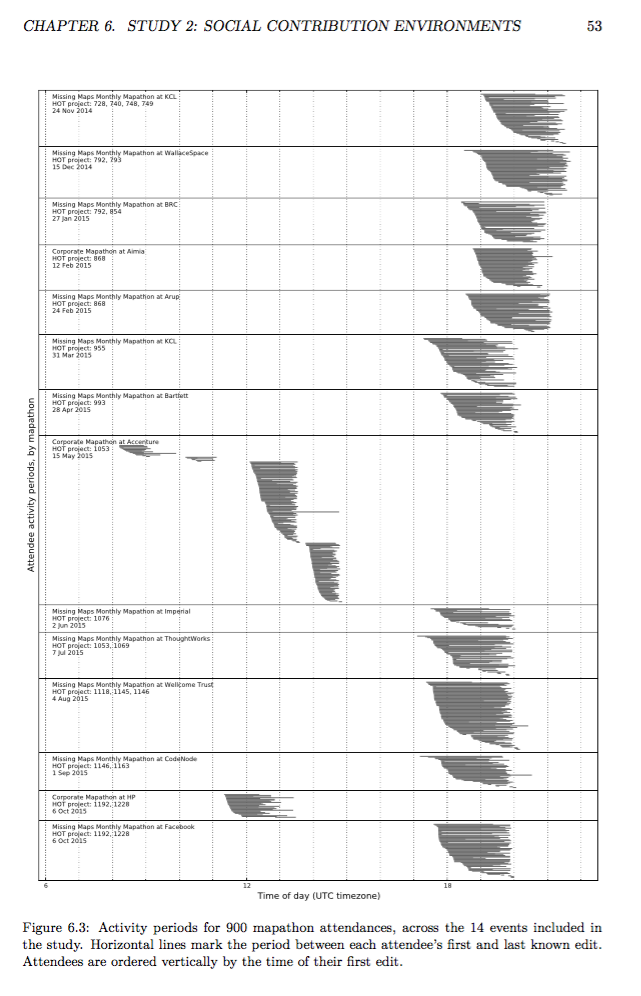
Social Contribution Settings and Newcomer Retention in Humanitarian Crowd Mapping (PDF), where we investigate the role of mapathons as attractors for new and existing volunteers. Broadly we found that attendees at one-off events at “corporate” mapathons were often quite committed during the duration of an event, but unlikely to keep mapping afterwards. By comparison, the monthly rhythm of the public Missing Maps mapathon appeared to foster more of a longer-term engagement. This paper was quite hard to complete, and the findings were a bit underwhelming… quantitative methods are useful for certain things, but I think for a real evaluation of mapathon settings a qualitative research approach is likely more powerful.

Mass participation during emergency response: Event-centric crowdsourcing in humanitarian mapping (PDF). This paper is maybe my personal favourite. It only required some very basic statistics, but yielded some novel observations about the nature of community engagement in emergency response. We found that disaster response campaigns such as after the Nepal earthquake can be significant recruiting events, however that these newcomers might not stick around for very long… on the other hand, for many long-term contributors HOT engagement is very much characterised as a dormancy-reactivation cycle, responding to events as they happen rather than always mapping. Is this an opportunity to optimise HOT workflows, for example through the introduction of targeted notification channels when a need arises? Our quantitative methods were perfectly suited for this kind of analysis. Paper reviewers must have thought so too: it was awarded Honorable Mention at CSCW 2017.

Private Peer Feedback as Engagement Driver in Humanitarian Mapping (PDF). Here we looked at the impact of private validator feedback on the tasking manager on newcomer retention. This is a classic behavioural study based on loads of prior work, but with HOT as a novel setting – it’s a bit unusual because on the tasking manager, the peer feedback relationship with validators is more akin to private mentoring than the public rating you often find it on other platforms. Maybe as a result, we found that critical/corrective feedback in HOT did not actually appear to discourage people, in contrast to what you can commonly find on platforms with public reviews. One the other hand, feedback that included social affirmation and appreciation was significantly associated with increased newcomer retention. Maybe this is due to the online nature of the practice, the fact that HOT remote participation can happen in a kind of “depersonalised” space for many? In the absence of other prominent social cues, small phrases of support can likely have a powerful effect. However, note that like the other papers this is an observational study rather than a controlled experiment, so I would love if if people tried to reproduce the findings with other methods. In any case, this paper is another favourite of mine – and it was awarded Honorable Mention at CSCW 2018.

Advice to prospective PhD students

Early on during the PhD, my amazing supervisor Licia Capra recommended to structure the research as individual papers rather than a large monograph, and to try to publish each project as we go. This was a transformative decision that significantly improved my PhD experience! It gave me regular deadlines, I learned a lot from reviewer feedback, and it meant that the main work was already written up by the time I needed to produce the final dissertation. It meant I was able to finish the first full dissertation draft in only 8 days, plus a couple of weeks of refinements; and it meant that I was not stressed about my viva (the final verbal examination for PhD students in the U.K.), because the work had already been reviewed by experts, sometimes multiple times (I had to resubmit two of the papers after they were initially rejected for publication.) Over time this gave me a good sense of the strengths and limitations of the work, and I learned some key methods from the peer feedback that I relied on in the later work.

Granted, a paper-based approach may not be suitable for everyone; our particular research approach lent itself to project-based work. But even if you decide against this approach, I would recommend not to leave the writing until the very end. It is quite well-established that PhD life is a mental health hazard. In my personal experience, and from talking to others, this is in part because you will find yourself in a perpetually drifting state where it’s at times hard to tell if you’re doing well, and it is hard to retain a sense of certainty that you’re on track. Instead your work resembles a seemingly infinite and never-shrinking list of tasks with indeterminate outcome. So in addition to maintaining an active life outside the PhD, I would also recommend to structure your work in ways that help you manage these uncertainties. Anything that makes your work and your progress more tangible will help you in the long run.

And then…

Anything that comes after such a glorious journey with HOT and Missing Maps would have a lot to live up to, so I feel blessed that since 2017 I’ve been a postdoc at the Oxford Internet Institute, and I couldn’t have asked for a better place to land. I’m not sure yet if I’ll stay an academic for life, but for now it’s perfect. You can follow my work on Twitter.

Another round of HOT board elections is about to close, and for the first time I’m participating as a voting member. As I write this I don’t yet know the results, we will review them at the member AGM tomorrow. An exciting moment! The community discussions around this also made me aware that these election cycles are always an opportunity for a new generation of HOT members to become our representatives. From personal experience I know that this can be a daunting transition, so I invite all candidates to lean on your community for support: we believe in you, and we can offer you advice and support, if desired. (Chances are you’re already very knowledgeable and experienced.)

Such a moment might feel particularly daunting if you’re not used to being in such a prominent position within a large public organisation. This is likely true for most humans! Possibly with some exceptions – as a white male I practically get status thrown at me, and I mainly just needed to learn how to accept it with grace. But people’s experiences differ. Maybe you were taught modesty as an important virtue, and to not be too assertive in your interactions. Through many conversations over the years I have learned that such small differences can affect our respective self-image, regardless of our actual competencies; and they may inform how we approach the prospect of becoming a board member.

I’m writing this post in anticipation that we may see some new faces on the board, if not this round then later. I’m writing to share the things I’ve been taught to take for granted; and I think you should take them for granted too. (This is not a universal set of recommendations. Many people won’t be able to relate to this, or only in parts. That’s fine. You will know if this speaks to you.)

First of all, I believe in your achievements, and I will call you an expert without thinking twice about it.

If you’re not the brazen kind then I suggest you practice how you can introduce herself in professional settings: hallo I’m X, I’m a board member of HOT. Hallo, I’m on the board of a large international volunteer org. Etc. Learn to anticipate what kind of greeting may resonate best according to the setting, and never be too shy to state your full title. You’re not bragging, you’re providing important context: you’re now a representative.

Whenever in doubt, know where to seek advice. Form relationships with your fellow board members. You’re always welcome to email or even call your peers and close contacts, anytime. Because you’re now in an exceptional situation of responsibility, we believe you deserve exceptional support.

Most importantly, have confidence in your expertise, and listen to your instincts. You’re here because of your achievements and connections, but also your specific sensibilities. Speak up when everyone agrees, but something feels funny to you. Never be afraid to ask a simple question; and never be afraid to ask a hard one either.

Let your servant nature work for you, not against you, if you think that you have one (I know that I do.) Remind yourself that it is your duty to act on your instincts. Your community has entrusted you with this responsibility because they consider you a worthy representative, and you can act with the full weight of their support.

Do you need to consider yourself a leader to do this job well? It’s up to you. I’m personally a fan of servant leadership: nobody’s boss, and everybody’s assistant. However, sometimes you will need to be firm in order to get the best outcome for your community.

(We could also chat about many practicalities: keeping notes, balancing commitments, relationships with peers, boundaries, burnout, managing your ego, managing conflicts of interest, etc; maybe something to discuss in the comments?)

Validation feedback can provide important social affirmation

Posted by dekstop on 8 February 2017 in English. Last updated on 27 March 2017.

After my talk at State of the Map in Brussels, Nick Allen asked: are newcomers to HOT more likely to be retained if we give them positive validation feedback? And conversely, do we discourage them if we invalidate their work? I had no answer at the time, in part because many validation interactions are not public. However, I agreed with his observation that these are likely important early encounters, and that we should make an effort to understand them better. In particular, we should be able to provide basic guidance to validators, based on empirical observations of past outcomes. What are the elements of impactful feedback?

I spoke to Tyler Radford about these concerns that same day, and within a few days we signed an agreement which gives me permission to look at the data, provided I do not share any personal information. The full write-up of the resulting research is now going through peer review, and I will share it when that’s done. In the meantime, I thought I should publish some preliminary findings.

Manually labelling 1,300 messages…

I spent the next months diving into the data, reviewing 1,300 validation messages that have been sent to first-time mappers. I labelled the content of each message using models from motivational psychology, and feedback in education settings. For now I’ll skip a detailed discussion of the details, but feel free to ask questions in the comments.

I assessed the impact of different kinds of newcomer feedback:

  • Positive performance feedback: messages including comments like “good job”, “great work”, “looks good”, …
  • Negative performance feedback: “doesn’t look complete”, “missing tags”, “needs improvement”, …
  • Corrective feedback: guidance about specific improvements to improve future work, including links to documentation.
  • Verbal rewards: messages containing positive performance feedback, gratitude (“thanks!”), or encouragement (“keep mapping”).

Here’s a chart of the frequency of each type of feedback across the messages I labelled:

Use of feedback techniques in validation messages

To measure the effect of these feedback types, I collected the contributions for each newcomer over a 45-day period after their initial edit, and labelled the content of the first feedback message they received during this time. I then observed for how many days they remained active, or whether they dropped out (as measured with an additional 45-day period of inactivity). I then used a Cox proportional hazards model to explain the retention rates we observed, based on a set of features and control variables. This is comparable to a regression analysis, but specifically intended to model participant “survival”. In the context of this study, the term `hazard’ is a synonym for the risk of abandoning HOT participation. A hazards model yields a hazard rate (or rate of risk) for each contributing factor, denoting the relative increase in hazard when a particular feature is present. For example, a hazard rate of 2.0 means that the person is twice as likely to stop contributing within the observation period, compared to the average. Conversely, a low hazard rate of 0.5 means they are twice as likely to still remain active at the end of the observation period.

Social affirmation matters: someone else cares

Maybe most importantly, I found that the feedback can be an important source of social affirmation, which in turn can improve newcomer retention. This effect is most clear among newcomers who contributed comparatively less on their first day (mapping less that the median of 75 minutes), possibly because they have low intrinsic motivation or self-efficacy. Among these, people who received verbal rewards in their first feedback message were significantly more likely to keep mapping, at a reduction of the hazard rate to 80%. In comparison, newcomers who already start with a high degree of engagement may not require such affective-supportive feedback to remain engaged.

This makes sense when you consider the wider context. The process of contributing to HOT online can be considered a depersonalised form of interaction: it is often focused on the task, rather than the learner. In the absence of other prominent social cues, small phrases of support may have a large effect. In the case of validation feedback, it’s likely also important that this is not simply an automated message. Instead, someone else looked over your work and then took the effort to write some kind words.

To my surprise, negative performance feedback in itself is not necessarily discouraging to newcomers: while it may demotivate some individuals, in aggregate across all newcomers there was no significant effect on retention. This includes instances of invalidated tasks, and negative performance feedback such as “your buildings are all untagged”. This may be because the feedback is private: people don’t have to be concerned about the impact on their reputation, and can focus on improving their skills. In communities like Wikipedia where feedback tends to be public (in the form of comments or reversions), it was found that negative feedback can harm newcomer retention. It’s also worth mentioning that even “negative” feedback in HOT still tends to be polite and constructive: HOT validators are generally a very polite bunch, based on the messages I’ve seen. They might simply point out that you forgot to square your buildings.

The timing of feedback matters: feedback that was sent within 28 hours or less (the median delay) yielded a reduction of the hazard rate to 80%. Any additional day of delay increased the hazard rate. This means that feedback that was sent after a week or later tended to have less of an impact. However, please regard this outcome with some suspicion. It likely has to do with how feedback is sent: the current tasking manager cannot send email alerts, instead people need to return on their own accord to see the message. I expect that we might see quite different behaviour once we start sending proper email notifications in a future iteration of the tasking manager. We might even observe that validation feedback can become an effective way to reactivate dormant mappers… I’m curious.

I now believe that these observations place validators at the core of the HOT community: for many contributors who can’t attend a mapathon, and who haven’t subscribed to the mailing list or joined IRC, validation feedback is their first experience of a social encounter. For a number of reasons, the current iteration of the tasking manager doesn’t easily support such interactions (maybe a topic for a future post); but I’m looking forward to the next iteration, which is already in planning. As I’ve learned through discussions, the validator community already has some great ideas about improving it even further.

The fine print

First off, this is an observational study, which comes with some constraints: we can identify links between validation styles and outcomes, and control for confounding factors through careful model design, which gives us some confidence in the findings. However, we would have to run actual experiments to confirm each link.

The models behind these findings account for a number of confounding factors. For example, I consider each newcomer’s initial contribution activity: were they already enthusiastic contributors to begin with? I also look at the particular project they start with: did they join during a disaster campaign, possibly in a wave of public interest? Such newcomers tend to not stick around for long.

And my usual caveat applies: I assessed the impact on contributor activity and retention, but not on contribution quality. In part because I still haven’t found a good approach to assessing contribution quality at this scale: there is no ground truth available for comparisons, and contribution practices are diverse and often specific to the geographic/thematic context. Developing methods to assess data quality at this scale is a research project in its own right.

This is certainly not the final word on validation feedback, and I expect many others will add to this (maybe in the comments)? But it can hopefully serve as one contribution to our growing body of knowledge about how best to support our maturing community.

HOT Voting Member 2017 Personal Statement

Posted by dekstop on 1 February 2017 in English.

Thank you Ben Abelshausen for nominating me as a HOT voting member, and to Jorieke Vyncke and Harry Wood for additional support!

How did you become involved in HOT?

I have been aware of humanitarian mapping activities on OSM early on, but first really got to know HOT as an organisation through Kate Chapman’s recorded talks. In 2013 I attended State of the Map in Birmingham where I met Ben and Jorieke, and learned about the growing range of development and aid activities that had grown out of the wider OSM network. In Summer 2014, a group of people started the first regular HOT mapathons in London (they would later co-found Missing Maps). I became an early participant, and my involvement grew from there.

Could you tell us about your involvement in HOT, mapping and/or humanitarian response?

I initially became active in HOT as a PhD student researching community organisations, and after some months of exploration decided to make HOT the centre of my work. Over the last 2-3 years I’ve gradually expanded my involvement. At some point during this time I also joined a growing volunteer team around Ivan Gayton, Pete Masters and Andrew Braye to help run their mapathons and other HOT-related activities.

My first tangible contribution is maybe the talk I gave at the first HOT Summit in 2015 (slides). I showed empirical evidence of some HOT community activities and outcomes, and discussed the implications. The talk resonated well, and sparked great debate during the session. Based on the feedback I got I think this helped people gain a different understanding of their work, and their priorities. (Unfortunately the video was never published, maybe we can get it online sometime.)

After the talk, Alyssa Wright approached me and suggested I should make my findings accessible to the wider community. This motivated me to start a research diary, where I now share findings from my various explorations of HOT activities. The first post discusses my motivation: to help develop a broader understanding of HOT through analytics and visualisations, contextualising the data, providing evidence to substantiate design choices, and offering conceptual models which help reason about HOT as a social phenomenon.

My research has progressed a lot since these early days, but most of the time it is still driven by a desire to use my research skills to support HOT as an organisation, and to inform and strengthen HOT practice. In addition, I’ve also been regularly approached by other community members with ideas about aspects to look at; have a look at some of my past diary posts for examples of this.

What does HOT mean to you?

My guest blog post for State of the Map 2013 ends with an observation that still motivates me today: HOT to me reflects a turning point in community technologies. It takes OSM as a starting point, but expands on it by connecting to a large universe of social concerns. In my opinion, a key contribution that HOT is making to the world is that it places community at the centre of its activities, and that it embraces and balances a multiplicity of perspectives. But also that it finds a delicate balance between a kind of volunteerism that is driven by enjoyment and personal enthusiasm, and an honest professionalism that connects to funding sources and places where “serious people” live. In that, HOT represents a rare synthesis of the lessons of open source culture and the aid and volunteering sector, hopefully managing to keep the best parts of each.

Why do you want to be a voting member?

I have experienced HOT from the “outside” for a few years now, and have become more and more personally invested in its future. I would like to formalise this relationship, and help take on the burden of making sure that it remains a healthy organisation for a long time to come.

As a voting member of HOT what do you see as your most important responsibility?

I think one of the most important contributions any member can make is their approach to internal discourse. I see it as my responsibility to promote things that I think are important, to alert the community of risks, but most importantly to do so in a manner that is constructive, never divisive, and to help moderate internal debates when emotion takes over.

How do you plan to be involved in HOT as a voting member?

I will keep up my enthusiasm for finding new HOT corners to explore, helping foster community engagement, seeking to help tackle community coordination challenges, and supporting daily practice in a range of ways. In addition, I look forward to participate in the governance of HOT. I have spent the last decade with a wide range of community organisations, and have had much exposure to the governance challenges they may bring, and some potential means of addressing them. I plan to bring this experience into my involvement with HOT, but also to come with an open mind, and to take time to listen.

What do you see as HOT’s greatest challenge and how do you plan to help HOT meet that challenge?

HOT is attempting to foster a new kind of practice while the word is shifting around us. As a consequence, there is a long list of challenges. On top of that there are the challenges of a maturing organisation: managing funds, emergent factions, maintaining the tech. Others will have thought about these aspects quite deeply already. A personal concern for me is HOT’s relationship to community growth, and community cohesion. Internally, and in its relationship to other organisations, and the wider OSM ecosystem. How large do we want to grow this? Do we have the means to deal with the consequences? I think there are many open questions related to this; but also a growing body of knowledge that we can draw from.

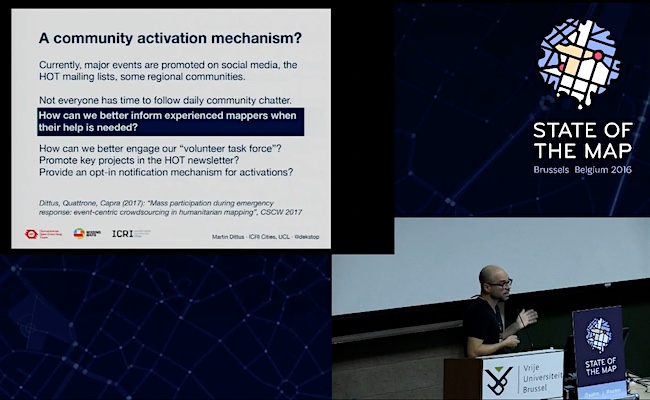
I just saw that the video for my SotM16 talk has already been online for a month… many thanks to the organisers and video team in Brussels for making this happen so quickly, and in such a high quality! You can find some summary notes further below, along with recommendations to HOT organisers.

The recording: Youtube: Building large-scale crowdsourcing communities with the Humanitarian OpenStreetMap Team

You can get the slides here: Slides: Building large-scale crowdsourcing communities with the Humanitarian OpenStreetMap Team

(This was recorded at the tail end of an unusually busy summer, after a couple of weeks of deadlines on little sleep, in a morning slot, with little time for rehearsal… throughout these short 30 mins I really, really wanted to go back to bed. If you know me a little you might notice it in the recording, everyone else may simply think I’m a little slow :)

Among the key observations to date

The talk summarises much of my research to date. It includes updated statistics and visualisations, and the results of three studies of HOT community engagement.

Over the course of this work, I’ve stopped thinking about community engagement as a process of “converting” people. Instead I now also think of it as a process of discovering and activating the right people: many of our most prolific contributors were already prepared to be engaged. Maybe they were looking for community, for a spare-time activity that has a bigger impact than just watching TV; maybe they already had some GIS experience and didn’t know they can use it for a social purpose. In this sense, fostering community engagement is as much about the initial recruiting process as it is about the actual contribution process.

Among the key observations to date:

  • HOT is now a key source of community growth for OSM: among the 32,000 HOT contributors to date, 80% are newcomers to OpenStreetMap! (I have not yet investigated whether they then also contribute to other parts of the map.)
  • Over their contributor lifetime, 50% of HOT mappers dedicate at least 65 minutes to their contributions. This may sound like a small average for a volunteering organisation, but for an online platform it’s a massive achievement.
  • Emergency response events can also be key recruiting moments: during HOT activations for Typhoon Haiyan, the Nepal earthquake in 2015, the earthquake in Ecuador in 2016, and others, many new volunteers joined HOT.
  • … and much, much more.

Recommendations to organisers

In the talk I also make some recommendations to HOT organisers, based on study findings, and informed by my interactions with the wider community:

  • During large disaster events, carefully manage the tasking manager task listing. People who join during these events don’t tend to stay active for long, and their contributions tend to have a lower quality. Point them towards newcomer-friendly projects where they can make some early experiences.
  • At the same time, HOT can likely benefit greatly from a notification mechanism for contributors who are interested in future campaigns. Currently there is no good means of reactivating mappers who have already made some early experiences. Instead we rely on our volunteers to discover new campaigns on the mailing list or on social media. While this may work for the core community, there is likely a larger number of mappers who may be willing to help out again. How can we best inform them when they’re needed?
  • Generally, try to connect newcomers to the existing community as soon as possible, and do so in a setting that is appropriate for absolute beginners. The mailing list works well for a few hundred core contributors. Yet as we grow, is it still the best default location for a newcomer who has a question for an expert?

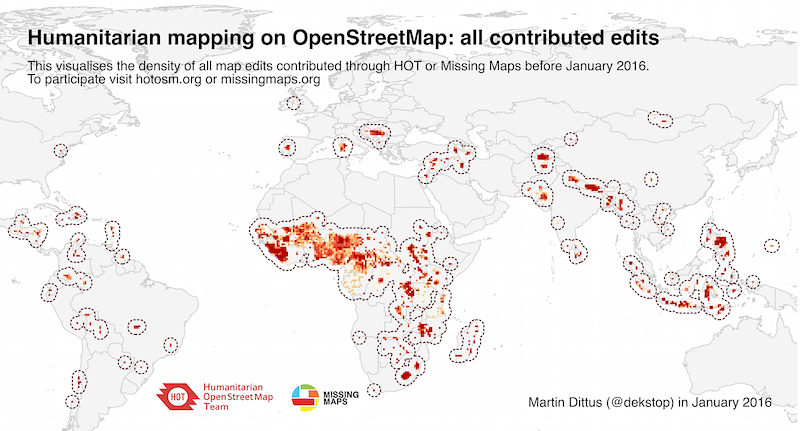
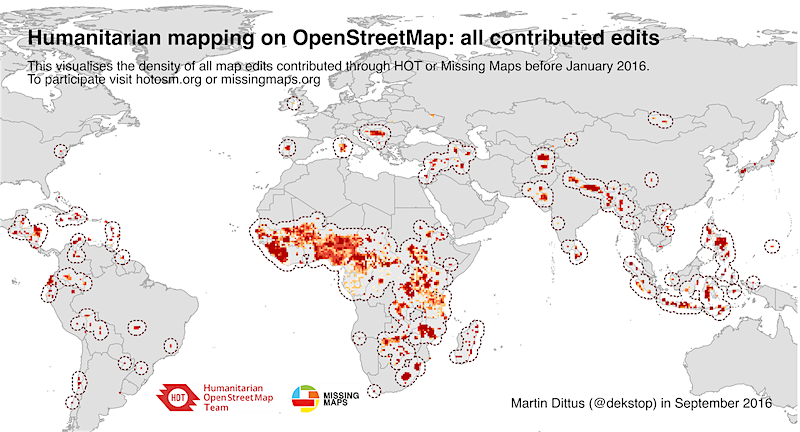
The visualisation below shows the regions of the world where the HOT community has contributed edits to OSM, which is one way in which we can show the impact of our community. The chart visualises contributions before 23rd Sept 2016. By this date, 32,000 people had contributed at least one edit, accounting for a total of 182,000,000 edits. This took an estimated 240,000 labour hours.

As mentioned before, I’ve been showing the visualisation in talks for a while now, and I regularly receive messages by people who would like to use it for their own slides, for mapathons and training sessions, and other uses.

A global map of HOT contributions

There is also a PDF version (11MB), a high-resolution PNG (1.3MB), and a folder with older versions if you want to do a visual comparison of map growth. Send me an email if you would prefer a version without annotations – I simply ask that you provide credit when you’re using it.

(Despite my best efforts I’ve not yet managed to make to switch to the Robinson projection, as recommended by BushmanK… the QGIS renderer acts up every time I try changing the projection string. I’m probably simply doing something wrong.)

OSM Analytics launched!

Posted by dekstop on 7 May 2016 in English.

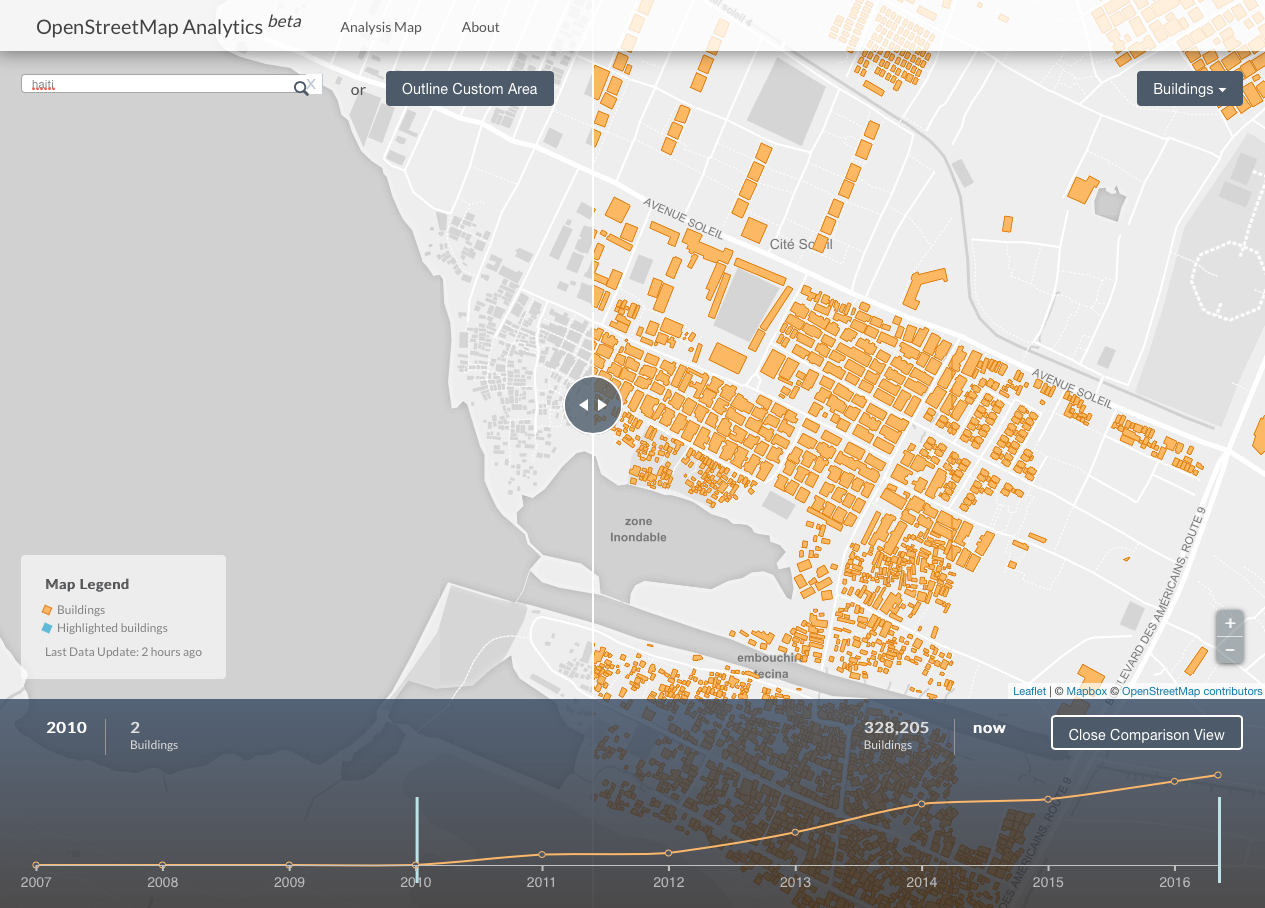
A few months ago I posted a draft specification for an OSM quality assurance tool. The first beta for the project was launched last week, it is now called OSM Analytics. Cristiano Giovando posted an announcement on the HOT blog.

OSM Analytics

The code for frontend and backend is on Github; it’s a very nice Javascript codebase, making use of many existing OSM frameworks and infrastructure pieces. We welcome your bug reports and pull requests!

I also gave a brief introduction to the tool and its uses at the most recent Missing Maps mapathon in London, there’s a recording by the BRC maps team on YouTube. Unfortunately we had wifi problems at the venue, so it’s not a very fluid presentation, but Chris Glithero took care to edit out the gaps so it’s still a decent flow.

HOT mapping initiatives over time

Posted by dekstop on 29 April 2016 in English.

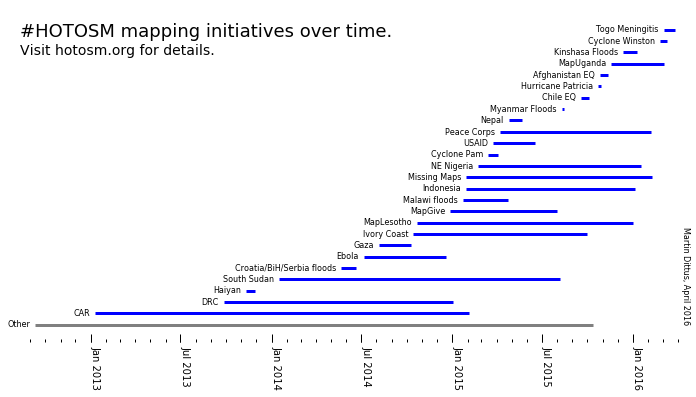
Today I took some time to update my list of HOT mapping initiatives – a bit of a messy process because there’s no official listing. These days I simply review new projects in the OSM edit history that have a minimum number of contributors, and label them with a simple term. The intention is to identify groups of projects that have a common theme. Typically these are disaster events, larger mapping campaigns like Missing Maps, or organisations that organise projects for their members. Of course the boundaries between them are blurry, e.g. Missing Maps is really a meta-initiative across many discrete projects.

Here’s a timeline of the initiatives I’ve identified so far – let me know if I missed any! There’s also a PDF version, in case you want to include this in presentation slides.

#HOTOSM mapping initiatives over time

OII Talk: Big Data and Putting the World's Vulnerable People on the Map

Posted by dekstop on 22 February 2016 in English. Last updated on 9 May 2016.

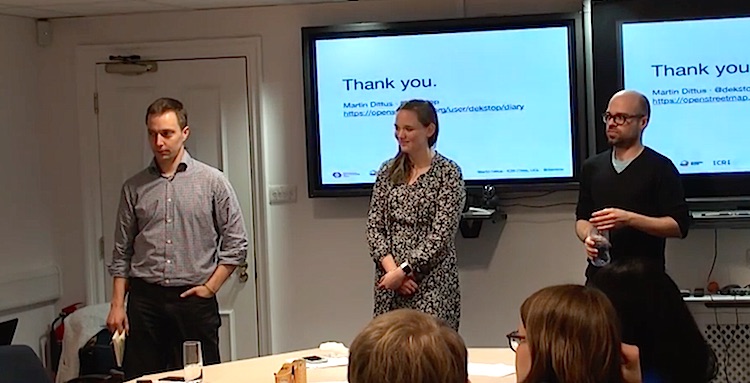
Andrew Braye, Jo Wilkin and I spoke at the Oxford Internet Institute earlier this month as part of their ICT4D seminar series. Andrew gave a high-level overview of HOT and Missing Maps, Jo spoke about data collection in the field, and I spoke about my HOT community research. We had a great time! The video is now on YouTube and is about 1h long.

Our slides are all online: Andrew’s intro to Missing Maps (Google docs), Jo’s field mapping discussion (Google docs), and my community engagement analyses (PDF).

Andrew Braye, Jo Wilkin and Martin Dittus speaking at the Oxford Internet Institute.

I particularly enjoyed Jo’s part which starts 7:30 minutes into the video, she gives some background on what happens after HOT remote mappers have produced a basemap. She shows specific examples in Katanga (DRC), Lubumbashi (Congo), Dhaka (Bangladesh), and other places where HOT coordinated field mapping activities with local communities, either using field papers or OpenMapKit on smartphones, covering a wide range of purposes. In Sierra Leone, local motorcyclists collected names and population counts for several hundred villages, which became an important information resource to help curb the Ebola epidemic. According to Jo, since Missing Maps launched in 2014 they have coordinated one field trip a month, if not more… pretty impressive.

I spoke just after. Some of the things I covered have already been posted here, and other aspects will become part of future posts. For now I just want to highlight two charts:

Number of active HOT contributors over time

HOT contributor activity spikes in relation to large humanitarian events.

Cumulative HOT user growth over time

Cumulative number of HOT user accounts. Large events are often also recruiting opportunities, they draw their own crowds. We just have to make sure that we’re prepared and can give people something to do.

A global map of all HOT contributions

Posted by dekstop on 26 January 2016 in English.

I’ve tweeted versions of this in the past (Feb 2015, May 2015), and used it in talks. Here’s an updated version with data up to 13th January 2016.

In total this covers around 120 million changes to the map, by almost 20,000 contributors across 1,000 projects. This required an estimated 165,000 hours of volunteer work! There’s a monthly breakdown of this activity in this Google spreadsheet: “2016-01 HOT activity timeline”.

Global map of all HOT contributions

I’m keen to do an animated version at some point! Also, could a cartography geek please recommend a suitable projection for this map? Atm it’s just the default WGS84, with apologies :)

How to increase the number of regular HOT mappers in 2016?

Posted by dekstop on 4 January 2016 in English. Last updated on 5 January 2016.

Blake sent an email to the HOT Community WG asking for ideas on how to increase the number of regular HOT mappers. This is squarely in my research domain, so it was a fun question to respond to… I suggested things that now to me are pretty obvious, but weren’t just a year ago.

My suggestions follow, in no particular order.


Identify existing communities with a propensity for this kind of work: GIS experts, aid org volunteers, and others who are similarly embedded in existing contributor communities.

Partner with more large corporates, but choose the right ones: where there are already some HOT mappers on staff, and people who can coordinate company mapathons. Don’t go through exec, instead identify existing mappers who care. (Cf Arup, others)

Set up regular online events where people can come together in a more social fashion. Online chats, twitch streams, etc; play with the format.

More regular mapathons around the world, organised by new groups; learn from Missing Maps in London, they’re now world experts in how to do it well.

Better communication of ongoing needs: e.g. a weekly (or monthly) email which provides background info on current projects, incl mapping tips about specific pitfalls.

A well-managed validator process, similar to Missing Maps in London: try to ensure that new contributors receive good and constructive feedback early.

Better guidance on the TM homepage: instead of “pick from infinite list of words”, try to emphasise different aspects that may resonate with particular types of mappers. The easy ones: degree of urgency, type of purpose, participating organisations, “almost done” projects, projects in specific countries, … I’m sure there are loads more aspects. (Then measure which of these things people actually respond to.)

Find means of identifying people who are actually interested (or likely to be interested), and then give them more specific support. For example, make sure they’re connected to a mentor or a peer group.

Based on existing experiences, figure out what kinds of social mapping settings are quick to set up and easy to replicate in different places, and by different people. Then write up some simple design patterns for how to set up your own mapping group. How to pick a good organiser, who should you invite, what’s a good venue, what tech is needed, what support will first-time mappers require, where do you go with more specific questions, etc.

Increase social presence: give people a social identity beyond their username, then get them to chat, share experiences, etc.

Should we teach JOSM to first-time mapathon attendees?

Posted by dekstop on 7 December 2015 in English. Last updated on 8 December 2015.

Joost asks in a direct message:

I’m organizing a Missing Maps event in Antwerp. One of the co-organizers wants to try giving a tweaked JOSM version on a USB stick to all the participants (preloaded settings etc) and use JOSM as a default editor. […] Did anyone try this at an event? Did you have a look at first timers using JOSM having a higher or lower OSM/MM retention? (It might be too much self-selection to really prove anything…)

I thought this was an interesting angle, and it connects with some of the work I’m currently doing, so I had a look at the data and am posting the results here. The short answer, based on a small sample: we’ve actually seen a difference in retention! However not in the way you might expect. I was surprised.

Before I begin I should say that I’m very interested in other perspectives on this question, particularly actual teaching experiences. This is a good scenario where statistics might be misleading, and where it helps to have actually talked to the mappers and observed what happened. Looking forward to people’s comments!

Preliminary caveats

It’s actually really hard to measure this well and generalise from past experiences, because every mapathon has its own story; different people attending, different things going right or wrong, etc. Different editors are also often used for different kinds of work: JOSM often gets used for field paper tracing and validation as well as satellite tracing. Unfortunately I haven’t been to most of the JOSM training sessions I’ll quantify below, so I don’t know what people actually did!

Furthermore, editor choice affects all kinds of follow-up considerations that may affect the outcomes of such a study; e.g. I’ve seen people forget how to launch JOSM a month after they first installed it, or OS updates causing java versioning issues, all of which is not something that can happen with iD.

And so on. You get the idea: many factors to keep in mind when we look at these numbers.

We can still look at general trends across the JOSM newcomers so far. Unfortunately there’s not a lot of observational data to make any strong statements, however I do think we can see some trends. And I’d certainly say that there is plenty of scope for further experiments!

Our observations so far…

The following statistics compare two groups of attendees at our monthly Missing Maps event in London: people who started with iD at their first mapathon, and people who started with JOSM. To make the comparison somewhat fair I’m only looking at attendees who have little prior OSM experience, with no more than 5 days of prior OSM contributions before their first mapathon attendance. I’ve also excluded the small number of people who used both editors at their first mapathon.

At our monthly mapathons, 37 people started with JOSM right away, spread across 12 events. On the other hand 298 first-time mappers started with iD (13 events).

Activity at the first event

16% of the JOSM mappers contributed for more than 2h in the initial mapathon edit session; this is about half as much as the people starting with iD, where 33% contribute for more than 2 hours. A histogram of their session durations illustrates the difference:

Initial session duration at people's first mapathon, by editor

You may notice that the two distributions are quite different. JOSM contributors tend to have shorter contribution sessions. I verified that this is a general pattern across multiple events, and not biased by a single mapathon. Note however that this does not necessarily mean that JOSM trainees tend to lose patience more quickly – they may simply be doing different kinds of work.

Update: As Joost suggests in the comments, it might also simply mean that JOSM collects edit timestamps differently. In past explorations I’ve seen JOSM preserve timestamps for individual edits within a changeset, but I don’t know enough about the editor to understand what exactly is going on.

Short-term retention

Joost however was asking about the impact on retention, so let’s see what happens in the days and weeks after the first attendance. For that we will observe everyone’s subsequent contributions to HOT, at home or at a mapathon, up to a period of 90 days after their first mapathon attendance.

A month later the picture flips. 32% of JOSM newcomers were still active 30 days after they first came to a mapathon. On the other hand, only 20% of iD users were still mapping.

To assess these numbers further we can look at survival plots, these show how likely it is that a certain group is still active after some time has passed. Most importantly they tell us whether these trends are statistically significant.

Survival rate of first-time mapathon attendees, by editor

The wide confidence interval for the JOSM group (the shaded region around the curves) illustrates how little data there is. The JOSM group has larger confidence intervals, which means there is a variety of retention profiles in this group, and not enough samples to determine a clear trend. As a result the confidence intervals of the two curves overlap, which means there’s likely not enough data to say for certain that the groups differ significantly.

However the curves do suggest an apparent trend: at Missing Maps monthly events, people who start with JOSM tend to remain actively engaged for longer.

Conclusion

Unexpectedly for me we do get some clear differences in outcome when looking at Missing Maps monthly events in London! Namely:

  • I looks like newcomers learning JOSM were more likely to stop early in their first session, compared to iD trainees. (Alternatively, JOSM and iD differ in how they collect edit timestamps.)
  • On the other hand, a larger share of JOSM trainees were retained as mappers over the following weeks.

Although I was surprised by this, this is not actually entirely unexpected. JOSM use tends to be associated with higher engagement: the most active mappers are often JOSM users.

However this does not necessarily mean that JOSM is the key trigger. It might simply reflect that the JOSM mappers at our events are a great bunch of people, fun to hang out with, and many of them know each other quite well; whereas the people at our iD tables are typically newcomers who are not yet as well-connected to the community. So maybe the difference is in the people, not the editor.

In closing I would say that we need many more observations across different kinds of settings to make these statistics meaningful. At the moment this is little more than anecdotal evidence. There’s definitely space for further experiments!

Secondary benefits: the social experiences of HOT contributors

Posted by dekstop on 2 December 2015 in English. Last updated on 11 December 2015.

I had a recent shift in perspective in my research of HOT contributor engagement. I will try to articulate a growing intuition: a sense that current-generation HOT tools and processes would do well to also recognise the secondary benefits HOT volunteers get from their participation, for example their social experiences. I think we currently don’t necessarily create social online spaces for new contributors, and that is an omission of some consequence. In contrast to Wikipedia and comparable platforms, HOT contributors are not also typically the primary beneficiaries of the collective output. Secondary benefits can make up for this lack in direct utility: they have important motivational power.

As usual, please let me know your thoughts on this. It’s informed by my own experiences of the HOT and Missing Maps community, and I am very curious to learn what I might have overlooked, how else to express it, or find other ways to look at things.

Thumbs up for mapathons!

What factors influence sustained engagement?

I’m researching contributor engagement in humanitarian mapping, trying to understand the factors that affect sustained engagement. Over the course of the past year I’d been looking at contribution mechanics and project designs (the microfoundations), mapathons as social contribution settings (group experiences), and am starting to look at the contributor flows between larger initiatives over time (collective experiences.)

I’ve looked at it from many different perspectives. Do certain task designs put people off? Does it make a difference when there’s a food break where people can socialise, when the wifi dies as you try to save which might cause frustration, or when a charismatic field worker speaks who can instil the practice with meaning and purpose? Does it make a difference that you’re sitting next to experts who can help you get started and build confidence quickly?

In every one of those instances I found (maybe unsurprisingly) that these factors may have some effects on short- and long-term engagement, however they are never consistently a trigger that converts people; alone or in combination. They likely contribute, but they don’t create engaged mappers in themselves. And, crucially, many of these things aren’t strong barriers to community growth: many people have already figured out how to map, with or without help.

In preparation for my annual research report I went back to some of the fundamental literature in my field, papers outlining the state of crowdsourcing knowledge. Contributor motivations in crowdsourcing are fairly well-understood, there are enough empirical studies which find recurring categories of motivation; in literature on volunteering and charitable giving, citizen science, Wikipedia, and even OpenStreetMap.

Secondary benefits of HOT participation

As you may suspect, people have a wealth of reasons to participate in volunteering projects like HOT. Some classic motivational categories relate to shared values, the social experience, gaining understanding, career development, self-improvement, and enjoyment of the process. One aspect in particular seemed appealing to me to ponder: the concept of social identity. The notion that when contributors weigh cost and benefits of their participation, an important consideration is what the practice means for them as an individual. Does it relate to their personal or professional interests? To an aspect of their biography, a past experience? To their relationships with the world? Their image of themselves? Does the practice allow them to form, articulate, and perform an identity? You might call this the secondary benefits of participation.

This may be an obvious realisation, but having it framed for me in this manner did rearrange my brain a little bit, and it changed my thinking. I remembered many conversations I’d had with mappers and organisers, and under this lense a theme emerged from all these chats; I can now see that many contributors have quite a clear understanding of the secondary benefits they derive from participation.

This is why there are so many geographers and GIS people among our volunteers. Why it’s not surprising to meet mappers who have been to Nepal or the Congo. Why people love socialising at mapathons, hearing the stories, forming relationships with organisers; why it’s so important to encourage beginners with constructive feedback, and to give experienced mappers opportunities to dive deeper, or to teach others, or to take on responsibilities.

What do people get out of the act of mapping itself, the individual clicks? Some people may be able to ascribe it with a concrete purpose: “a year ago I walked past this very house, hopefully my map can help make sure that people are cared for”. Others might say they find the activity meditative, soothing. However I would now posit that for many, the act itself is only attached to fairly abstract motivations. In contrast to Wikipedia, HOT maps don’t actually have utility to its contributors; they benefit aid workers, and people on the ground. The more concrete fulfilment for contributors comes out of all the things around the activity.

This is particularly clear at a mapathon, where there’s always so much happening; in London we’re now world experts at how to run a great HOT mapathon. Many blog posts and tweets can illustrate this, as do the photo albums of the Missing Maps Facebook account.

However after people go home, the community is on hold until next time. Many of our mapathon attendees don’t tend to map at home.

The social identities of HOT online contributors

What is the equivalent of these social experiences and other secondary benefits when you’re mapping at home? For example, how can the act help you form, articulate, experience, perform or promote social identities? I think for that we still have few answers; I think we still understand very little about what makes remote participation work. And crucially I think we don’t quite offer the means for social identity experiences online: our platforms are focused on the work itself. I would argue that the contributor collective is not actually well-connected at all, except for a few highly-engaged people who are subscribed to the mailing lists or chatting on IRC. However many of the thousands who participated over the last year actually have no place to go to socialise, or to discuss their experiences.

From that perspective I’m now not surprised that contributors don’t stick around after a high-profile disaster response (where there’s urgency and a direct purpose), and that many repeat attendees of mapathons don’t tend to map at home.

However I’m now also buzzing with ideas for things we can offer to fill these gaps; countless opportunities to improve our newcomer support, to introduce social online spaces, to form and perform social identities, to give people easy means to tell their own stories about what they just accomplished. New ways of telling people where help is needed, how they can improve their skills, and ways of making it a shared experience. Because at core this is what a community is: not a bunch of people who do a bunch of work, but a collective with shared as well as divergent identities, with values and reasons, with stories. And every new contributor who starts mapping because they saw us in the news should be able to participate in that.

Distribution of locales (languages) among HOT tasking manager contributors

Posted by dekstop on 9 November 2015 in English. Last updated on 5 January 2016.

Inspired by recent Transifex discussions I though it’d be interesting to see what languages our contributors actually speak — to the extent that we can easily find out. It turns out that as of May 2015, iD now submits a “locale” changeset tag — JOSM has been sending that information for a while already.

The top entries across both editors are shown below, for May-October 2015 (inclusive). Note that a locale with a small number of contributors is not a locale that matters less – as we’ve established before, a small number of contributors can make a significant impact on the maps of a region.

There’s also a Google spreadsheet with separate tabs for iD and JOSM contributors, if you want to dive further into the data: “HOT contributor locales, May-Oct 2015”. Or as CSV files: combined, iD, JOSM. It’s interesting to compare their distributions. E.g. iD has a much longer tail, which I guess is not a surprise – browser locale vs limited JOSM translations?

UPDATE: Ilya Zverev has kindly amended the spreadsheet to also show translation progress for each locale!

HOT contributor locales, May-Oct 2015

Unknown Pleasures (of humanitarian mapping)

Posted by dekstop on 5 November 2015 in English. Last updated on 6 November 2015.

Unknown pleasures (of humanitarian mapping)

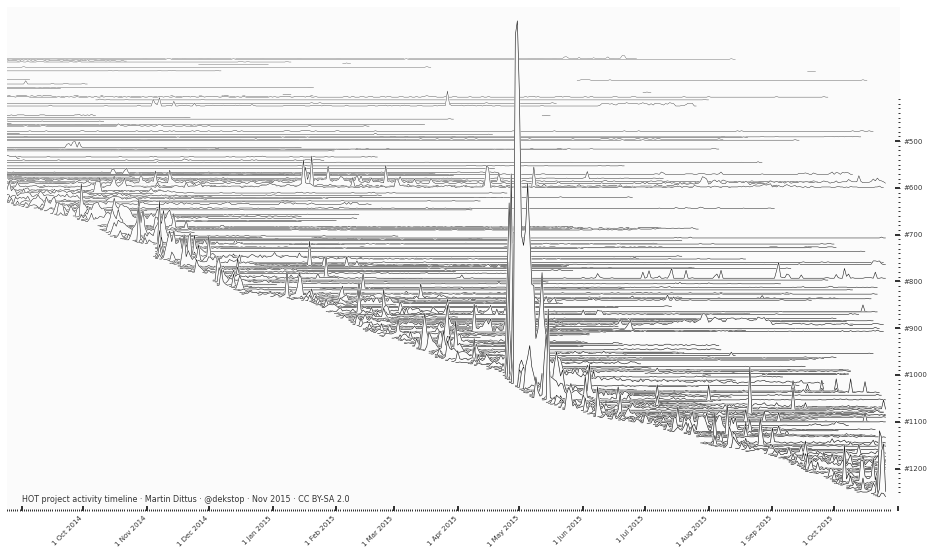
Harold D. Craft’s classic visualisation technique applied to a timeline of HOT project activity. As previewed before and used in the Missing Maps review, but updated for early November 2015. Click through for the full version.

A line per tasking manager project, its height along the implied z-axis is proportional to the number of project contributors on the respective date. Projects tend to be most active in the beginning, and then activity tails off. However some large projects are eternally active… MapLesotho (#597/599) is among these, partially covering the equally long-running South Sudan (#591). Remarkable how massive the Nepal contributor community actually was, in the scheme of things – the big spike in the centre would be even taller if the work hadn’t been spread across multiple projects (between #994 and #1090).

There’s also a PDF version if you want to print it out.

If it looks fuzzy on your screen then make sure you’re looking at the image in its native resolution: open it in a new tab and zoom to 100%. At an information density of several hundred high-contrast lines within just a few inches of digital display space it’s hard to avoid moiré effects. The preview you’re seeing above is optimised for smaller display sizes… It’s still not great.

Quantifying HOT participation inequality: it's complicated.

Posted by dekstop on 26 October 2015 in English. Last updated on 27 October 2015.

Pete asks:

On a skype today, Kate Chapman said that analysis after the earthquake in Haiti, she found that ‘40 people did 90% of the work’ within the community.

Is the workload more evenly spread throughout the community when it comes to Missing Maps tasks as opposed to HOT tasks? Is it more evenly spread during non-emergencies?

I thought I can look at this quickly because I’d done similar work around participation inequality in the context of OSM; in the end took much longer than expected and I can’t see that I found a simple answer. If anything it serves as a good reminder why it’s challenging to produce meaningful statistics for social spaces: the devil is in the many nuances. This writeup here can probably give you some impression of that.

Unfortunately I don’t have contributor statistics for Haiti since it predates the tasking manager, instead I will compare Missing Maps with other large HOT initiatives, most importantly Typhon Haiyan in the Philippines in 2013, but also the Ebola activation in 2014, and Nepal in 2015.

The impatient can skip the more in-depth discussion and jump to the conclusion section at the bottom. Note that this is just a quick exploration, not a thorough statistical analysis. I’m sure I’ve overlooked things, so please give feedback.

As usual I’m looking at labour hours as a measure of work. The results are probably not that different than if I’d used map edits, however I find they’re a better reflection of the effort spent on contributing. Time moves at the same pace for everyone, while the same number of clicks could yield a different number of edits depending on what you’re doing. Edit counts are also a potentially confusing measure because there’s no standard way of counting them: as the number of version increases of geometries, or the number of changesets? Etc. So here’s a key limitation of these stats: I’m not actually looking at map impact, instead I’m looking at a measure of individual effort.

You’re of course welcome to do your own analyses and compare, the raw data is linked below. Including edit counts!

Group sizes and average labour hours

Just to get a first impression: how much work do people do in each group, on average?

Summary statistics

I apologise for the messy table, this is quite unreadable, but useful for reference later. According to my contributor database (which atm has data up to early August 2015) there were about 6,400 contributors to Nepal, 2,800 to Missing Maps, 650 to Haiyan, etc. In other words, Missing Maps has more than 4 times the number of contributors than Haiyan.

Here the median labour hours per group as a plot:

Median labour hours per contributor

The median contributor effort looks comparable between Missing Maps and Haiyan. However bear in mind that we’re looking at a data set that is long-tail distributed, as this histogram suggests:

Distribution of effort

When looking at long-tail distributions we have to pick our aggregate measures carefully: the mean and even median are likely heavily skewed by outliers. There is no general measure of central tendency for long-tail distributions, nor can there be one. Repeat after me: “There is no average user”.

Instead we should compute measures of distribution: how is work distributed among the group?

The Gini index as a basic inequality measure

The Gini index is a classic measure in economics used to describe inequality in groups, usually income inequality in societies. It’s typically a number between 0 and 100 (sometimes 0 and 1), and a higher number means “more unequal”. According to the CIA fact book, the US has a Gini index of around 45 while the UK’s is around 33, and Germany is at 27.

The Gini index is also sometimes used to describe participation inequalities in online communities such as HOT. Online communities tend to be highly unequal, with a small share of highly active users; we will come back to that in a bit. It’s important to know that we can’t compare Gini scores across different kinds of social systems, e.g. we couldn’t fairly compare Wikipedia scores with HOT scores unless we’re sure they’ve both been measured in the same way. We can however simply use it to compare different subgroups within a community. Here: different HOT initiatives.

Gini index of HOT initiatives

Observations: Missing Maps & Haiyan seem fairly similar. Haiyan might even be a little bit more fairly distributed, however these kinds of “social” statistics tend to be messy in all kinds of ways, with a high degree of measurement error, so for practical purposes I would consider them equal. Work for Nepal and particularly Ebola on the other hand is more unequally distributed – with either a smaller number of hardcore contributors, or a larger number of people who do very little.

Distribution of work: the bottom end

Ok so let’s look at the actual distribution of contributions – as a first step, let’s see how many people do a minimum amount of hours in each group.

Distribution of effort (absolute)

This plot shows the distribution of work in absolute terms: how many contributors work for x hours? For example we can see that in the Nepal and Ebola groups, a large number of people contribute very little: many already stop within the first 30 minutes. Missing Maps on the other hand has a nice bump: many people contribute for up to 2h. Is this the mapathon bump?

The Haiyan group is too small to be easily discernible in this plot, so let’s look at relative numbers..

Distribution of effort (relative)

… it’s somewhere in between. Not an extreme spike of early leavers, but also no mapathon bump. Otoh it likely has a longer tail: a larger number of highly prolific contributors who each do loads of work.

Based on these charts you could say Missing Maps manages to raise the lower threshold of participation above the bare minimum, which is an achievement in itself. However this doesn’t yet answer Kate’s question: how much work do the top 40 contributors do?

Impact of highly prolific contributors

As we’ve seen in the summary table above, the initiatives have very different sizes. Based on that alone we can expect that the top 40 contributors in Missing Maps are likely to have had a smaller impact on the overall output, because it’s a larger overall group. Let’s check:

Impact of top 40 contributors

Hah, unexpected: The top 40 contributors in Missing Maps and Haiyan had about the same impact on their groups, both carry around 50% of the total effort! Intriguing. If I may speculate about a cause: Missing Maps is a larger project, but also has been running for much longer, so while the overall output is larger, the top contributors also have more time to do their share. (There’s only so much time in the day a person has available to do mapping.)

[NOTE: Kate said 90% for Haiti, I got 50% for Haiyan/MM for the same number of people. Why? Don’t know – don’t have data on Haiti, and would also need to compare how each statistic was computed. Stats are hard.]

Let’s look at it in relative numbers instead – the impact of top 6.25% contributors (the equivalent of 40 in 639 contributors for Haiyan, according to my records). Impact of top 6.25% contributors

As expected: we’re now covering a larger absolute number of Missing Maps contributors, and of course they collectively account for a larger share of the work at almost 70%. I.e., the “core” contributor group in Missing Maps is larger and does more work than in Haiyan, but only because Missing Maps involves many more people.

Let’s also look at the impact of the top 20% contributors, just because that’s a classic number people tend to use. Impact of top 20% contributors

Here we see a classic 80-20 distribution: 20% of users are responsible for 80% of the work. Aka the Pareto principle. Widely observed among online communities. Interesting that it seems to approximately apply for every single one of the HOT initiatives shown here.

Conclusion

As in all things relating to people it’s complex, there are different ways of looking at the question, and likely many contributing effects: how were the initiatives promoted, were they executed by a core community or lots of one-off contributors, to what extent did they attract hardcore OSM experts, how long did activity last, etc. I think we barely scratched the surface here. It also serves as a good reminder of why we should be sceptical of simple analytics when looking at online communities.

Based on the charts here we could say that:

  • Work is always “unfairly” distributed in HOT – that’s also a well-known empirical finding in many other social settings.
  • Missing Maps and Haiyan (and other initiatives) are comparable in terms of participation inequality in some respects, however there are also differences.
  • E.g. most have a similar 80-20 split, where 20% of highly active contributors do about 80% of the work – typical for online communities. This appears to be independent of group size, length of activity period, and other factors.
  • It gets even more extreme at the top. A very small number of the most active contributors might be responsible for a surprisingly large share of the work – e.g. we found for both Haiyan and Missing Maps that 40 people are responsible for about half the work.
  • Ebola and Nepal have a higher Gini index compared to Missing Maps or Haiyan, which means work is more unequally distributed in these groups. We find that in these two groups, a larger share of contributors drop out within the first 30 minutes – more people do less.
  • Missing Maps on the other hand appears to have raised the bar in terms of minimum participation. Compared to the other groups we looked at, people don’t tend to drop out right away, and instead many stay active for 2h or more. This might be a result of the regular mapathons organised by Missing Maps teams around the world, or of the fact that it’s a long-running effort so people contribute more over time.

My inner academic would further argue that in order to gain confidence in these claims we’d have to do actual statistical analyses, and not just look at charts and summary statistics. For long-tailed distributions we might use statistical tests of independence, such as the Mann–Whitney U test or the Wilcoxon signed-rank test, to determine whether these distributions of labour are actually statistically different across the different groups. That’s for another time – or maybe someone else wants to take it on? The data is linked below.

Do any differences relate to a sense of urgency? Not sure we have looked at enough evidence to answer this; of the four groups we could say Haiyan & Nepal are “urgent”, Missing Maps is “not urgent”, and Ebola may be somewhere in between. I believe the data we’ve looked at so far won’t easily accommodate simple interpretations. A study for another day, or another person :)

Other suggestions for analyses not shown here?

The data used for these analyses:

Missing Maps: the first year in stats & charts

Posted by dekstop on 22 October 2015 in English. Last updated on 23 October 2015.

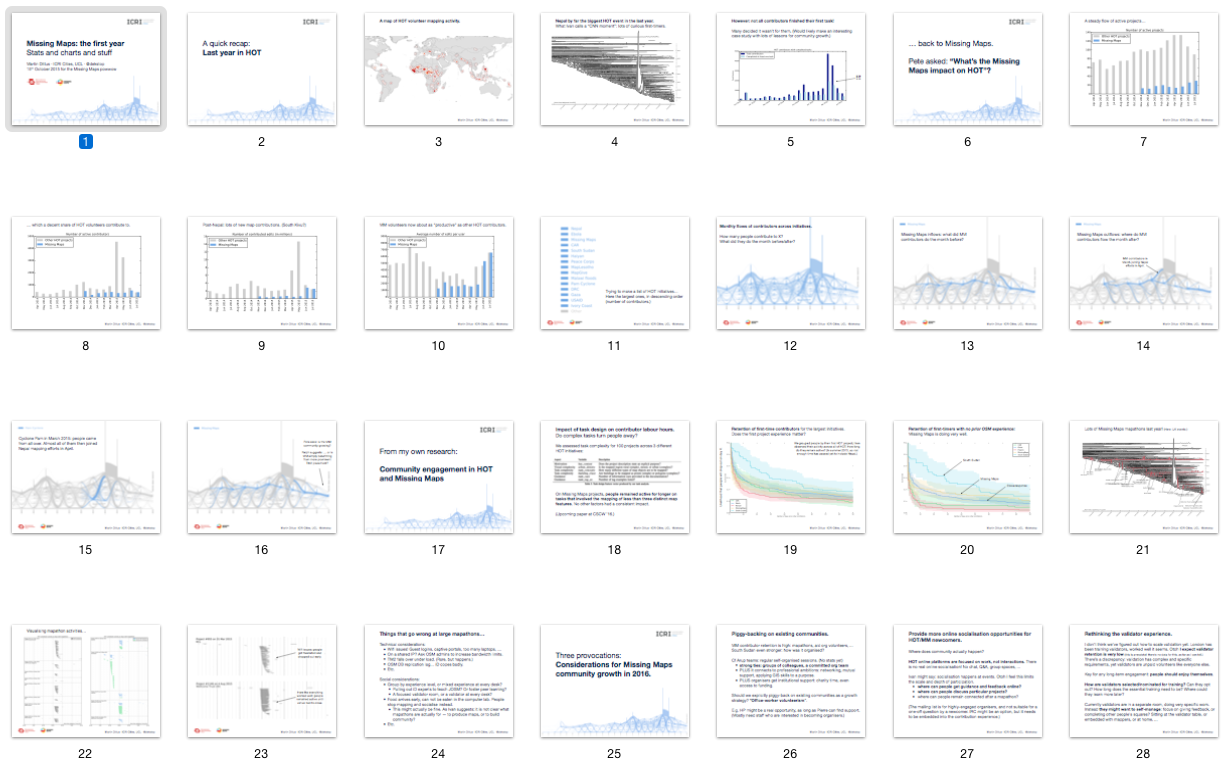
Stats & charts I put together for a session at the Missing Maps powwow in Toronto (PDF)

Slides preview

I had no time to prepare for this, so on the plane from London I simply went through my work of the last few months and collected things that seemed appropriate for the occasion. I intended this as a quick 30-minute review, but it ended up stimulating lots of debate throughout… so the session took 2h instead. For a conference setting this would have been disastrous, but since this was a team gathering it was actually quite useful. Data visualisation as conversational catalyst!

See also Dale’s recap of the powwow.

A few people sent me very nice thank-you notes when I later shared this online. My favourite compliment is probably Ivan’s reply on Twitter: @dekstop Martin gives us the story of @TheMissingMaps and @hotosm, with graphics that show don't tell! Awesome work.

Immediately followed by Tyler’s note to the HOT list: Martin - thanks for putting this together. There are some key takeaways here that can inform our future work, especially as it relates to volunteer engagement.

Thank you both! It’s good to know that the work resonates. It’s surprisingly challenging to design research projects that are academically strong and also of relevance to the outside world… As my supervisor Licia Capra likes to joke, academics like new methods while practitioners like old methods applied to new systems.

A few weeks ago pedrito1414 asked me to determine the share of HOT contributions that are attributable to Missing Maps. It took me a while to get around to it… but I finally did. If you follow me on Twitter you may already have seen a couple of these, but here’s the full set.

Number of active contributors

Number of contributed edits

(Interesting to see the post-Nepal uptake in MM activity. I didn’t actually check where this activity is going, but I expect the main driver are the mapping efforts for South Kivu, a new Missing Maps initiative launched in June with a very ambitious geographic scale.)

Average number of edits per user

(Note that averages are misleading, it’s unlikely that many MM volunteers actually contribute that much. These contributor stats are typically long-tail distributed, with a small subset of highly prolific users that raise the overall average, and a large number of people who contribute little. In fact a good mantra for any community research is “there is no average user”, partially because of the prevalence of long-tail distributions. Investigating the actual distribution of MM contributions is a task for another day…)

Number of active projects

I only recently realised that HOT contributors need to mark at least one task as “done” to be listed as project contributor in the tasking manager. This made me wonder: how many people start contributing to a HOT project but never finish their first task? What proportion of all HOT edits are contributed in this manner?

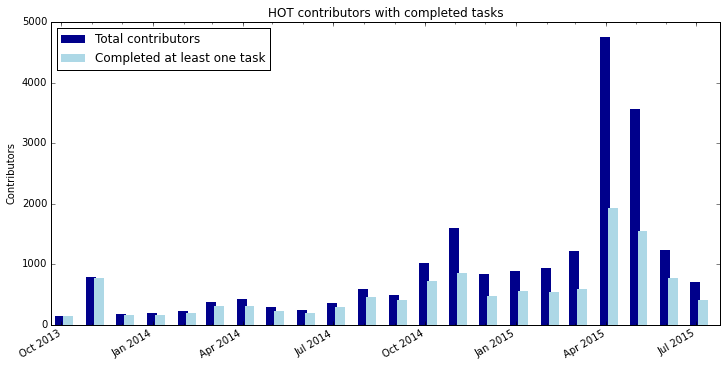
Summary: about half of all HOT contributors never complete their first task on a project, although they do contribute to the map. These “partial” contributions account for 10-20% of all HOT edits.

Here’s a timeline of the number of monthly HOT contributors, compared with the number of those who completed at least one task:

HOT contributors with completed tasks

And here the corresponding timeline of the number of edits contributed by both groups of people:

HOT contributions and completed tasks

Expressed as percentages:

Share of completed work

We don’t know why these contributors never completed the task, we can speculate but really we would need to ask them. Some may have forgotten to close it after they were done, some may not have had the confidence to mark it as “complete” and wanted someone else to have a second look, some may have gotten distracted, or lost motivation, etc.

It’s also worth bearing in mind that we can always expect some proportion of tasks to be abandoned early: not everyone is interested in contributing to HOT in the long term. Many people are likely simply curious and try it out for a bit. Many may have come across HOT because a friend sent them a link, or because it was in the news, and we can’t expect all of them to stick around.

However we should also be mindful of these early experiences. On one hand we can improve our understanding of what makes people stop early. On the other hand we should also consider the impact these contributions have on our map, and on validation and QA efforts. Where should we send absolute newcomers the next time we’re in the news?


Some background info on the analysis…

I’m identifying HOT contributions in the OSM edit history as follows:

  • The contribution needs to fall within the geographic boundaries of a HOT project
  • The contribution needs to happen within the activity period of the HOT project
  • And then…
    • EITHER the user is a listed project contributor (they marked at least one task as done),
    • OR the changeset is tagged with a valid HOT project ID (the contributor never marked a task as done, but likely did start a task in the tasking manager before contributing edits.)

There are some caveats with this data:

  • In this analysis, one completed task by a contributor is enough to regard all their contributions to the same project to be marked as “done”. The simple heuristics above do not allow me to distinguish task completion states for all individual changesets of a contributor to a project.
  • We can’t distinguish contributors who never mark a task as “done” from validators, or expert contributors who manually tag changesets with a project ID. We don’t have the data to distinguish these cases, e.g. there is no published list of validators to compare against.
  • We can only reliably track this from Aug 2014 when iD started carrying over project-specific changeset tags from the tasking manager. We won’t be able to identify “unsubmitted” contributions before then.

By Martin Dittus (@dekstop) in 2015.