Design proposal for a HOT quality assurance support tool
Posted by dekstop on 20 August 2015 in English.If you’re subscribed to the HOT mailing list you’ve seen a recent invitation to help develop a funding application for the Knight Prototype Fund, coordinated by Russ and Blake. The intention was to discuss project proposals that may be suitable for this grant. The initial IRC meeting then developed into a larger conversation around current HOT needs for better tools: the resulting Google Doc with meeting notes lists six project ideas.
The strongest candidate was a proposal to develop a HOT/OSM tool to support Quality Assurance (QA). You can read some details in the grant proposal writeup, however it’s a fairly high-level text. Informed by our discussion I also developed a draft specification, with a more detailed list of considerations and potential features.
I’m posting this draft specification here to get your feedback, and to hopefully stimulate some debate about what a good QA support tool might look like. The proposal is a result of conversations with HOT practitioners, and based on my own use of HOT and OSM data. However there are likely many community members with further ideas, and some may even have worked on HOT QA initiatives. We would love to hear from you! In particular we would love to hear from validators, and from existing users of HOT data. What specific data quality concerns arise in practice?
(I should also state that I don’t have a deep understanding of the Humanitarian Data Model – there are likely some useful concepts in there that could be more emphasised in the spec.)
Considerations
Our general ambition is to make HOT progress more visible. More specifically, the proposal aims to support our existing QA processes around HOT validation. Crucially it further aspires to provide a means of demonstrating HOT data quality to prospective users of the maps.
Aims of the proposed QA support tool:
- Impact analysis of HOT coordination efforts: to describe our outputs in ways that are meaningful to the HOT community, to prospective data users, and to a wider public.
- Evaluating fitness for specific purposes: to assess the quality of the data in relation to the specific concerns of data users.
- Integration support: to assess the structure of the data in relation to the Humanitarian Data Model (HDM).
Target audiences
The design of the QA support tool should be informed by the needs of existing users of HOT data: most importantly HOT activation partners, and requesting organisations with specific information needs. This also includes prospective users in aid organisations who still need to be convinced that the data can be useful.
It should also be informed by the needs and experiences of HOT validators: they are most well-informed about HOT data quality concerns, and they are likely going to be the most active users. The QA support tool should integrate well with HOT validator workflows, however it is not meant as a replacement for existing tools. I imagine its most useful function will be as a final check: a summary report of the outcomes of a particular mapping initiative.
The design could further consider the needs of other potential users of HOT data: people who want to report on current issues, or who as part of their work can make use of geospatial data. This includes local communities, local and international journalists, engaged citizens, and supporters of aid organisations.
What are their needs?
(This is a bit speculative. Please share your thoughts on this.)
“Which data sets are available?” Which regions are covered? What kind of information is captured?
“What is the quality of the data?” An assessment of map completeness (coverage), consistency (e.g. of annotations), and various measures of accuracy. An assessment of the age of the data, and of its provenance: which imagery sources were used to produce these maps?
“How can we access the data?”
“How can we integrate it with our information systems?” For example, how well does it map to the Humanitarian Data Model, or other standard data models?
The QA process: tests and reports
I. Basic report (derived from OSM edit history):
- How much data is there?
- How many people contributed?
- How old is the data?
II. Coordination report (derived from edit history and TM2 data):
- HOT project identifiers: links to the projects that produced this data
- Have contributions been reviewed (validated)? where? what changes were made?
III. Automated QA (basic validation):
- Untagged objects
- Overlapping objects
- …
IV. Annotations report: which annotations are available?
- Geospatial information: road names, place names, …
- Data provenance: description of imagery source
- Data management: review-related annotations (e.g. ‘typhoon:reviewed’)
V. Humanitarian data report (derived from OSM edit history, HDM):
- What map object types have been mapped? how many objects are there?
- E.g. “150 buildings, 15 hospitals, 3 helipads”
VI. “Fitness for purpose” reports: assessing the availability and completeness of data in relation to specific needs:
- Availability of building data needed for population density models
- Availability of road data for transport planning
- Availability of infrastructure data (hospitals, schools, helipads, …) for aid coordination and logistics
- Others
Other considerations
Should a QA support tool also include its own workflows to address specific issues, or focus on descriptive reports as outlined here? Will our existing validator workflows remain sufficient as we grow?
Who should be doing QA work? How much of QA requires “expert” knowledge? Can we consider QA a general community activity that’s open to all? E.g. by using guided workflows with good documentation. (This is also a discussion about HOT validation practices.)

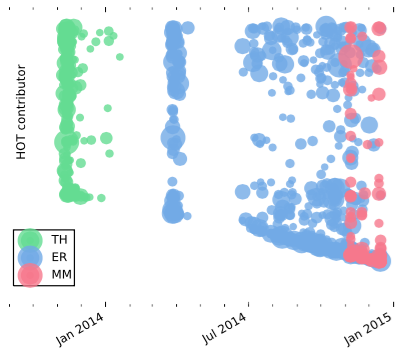 Each new contributor is visualised with a bubble. Bubble sizes represent the amount of labour hours the person contributed in the first 2 days. Contributors are ordered vertically by their OSM ID: older user accounts at the top, new accounts at the bottom.
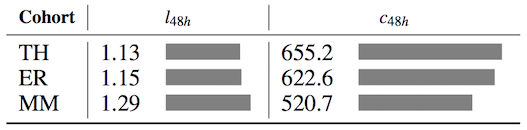 Median contribution activity in the first 48 hours: labour hours (left) and contribution rate (right, in edits per hour).
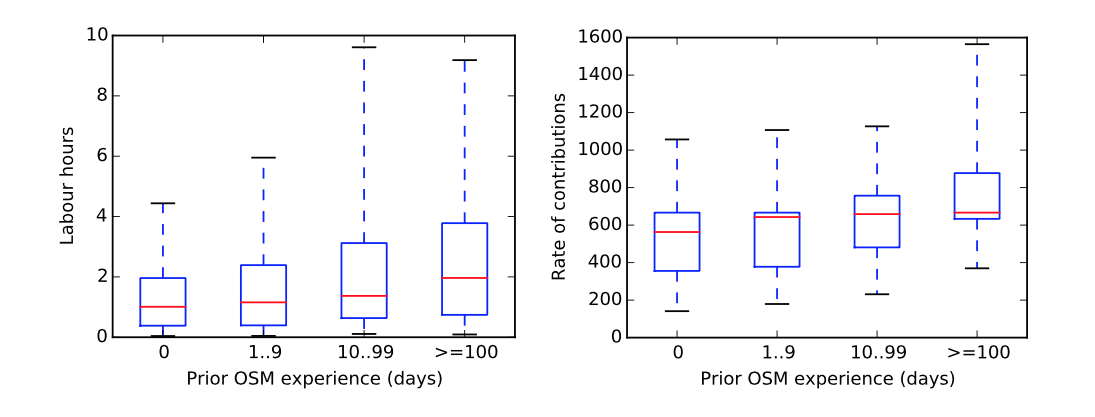
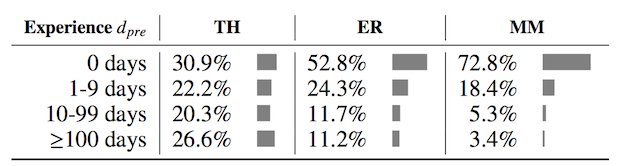 Share of participants with a given amount of prior OSM experience, measured in the number of days on which they contributed to OSM.
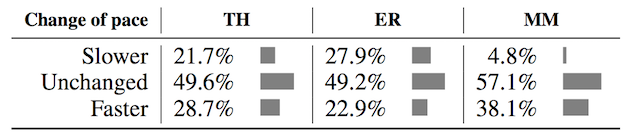 Share of participants based on their change in contribution pace between the first and second day.
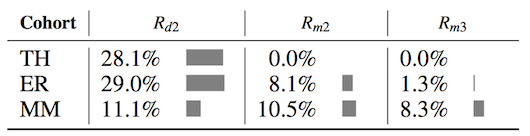 Median retention for day 2, and months 2 and 3.