Initial activity and retention of first-time HOT contributors
Posted by dekstop on 22 June 2015 in English. Last updated on 6 July 2015.(Hallo! I’m Martin Dittus, a PhD student at UCL. You can read more about my research in an earlier post.)
The volunteers of the Humanitarian OpenStreetMap Team (HOT) and its affiliated projects have spent many thousands of labour hours on the creation of new maps for humanitarian purposes. Yet mapping all the undocumented and crisis-stricken regions of the world is a formidable task. The 2014 response to the Ebola epidemic illustrated this well: even after months of work by thousands of volunteers, the new maps of Central and West Africa are still nowhere near complete.
Many people within HOT now believe that this can best be addressed by growing the community by a few orders of magnitude. An MSF article about Missing Maps articulates this ambition:
To reach our goal, we need the Missing Maps Project to be the biggest instance of digital volunteerism the world has ever seen.
So let’s say we’d want to grow HOT to a million volunteer contributors. How can we train new contributors at that scale? What are our barriers to entry? How can we retain contributors once they’ve had first experiences? Etc… many open questions.
As a first step let’s learn from existing experience. How does engagement compare across the different mapping initiatives right now? Let’s start with a simple comparative study.
Comparing three large HOT initiatives
I’m particularly interested in the engagement profile of first-time contributors: people who may have OSM experience, but who have never before contributed to HOT. How much work do they provide in the first couple of days? How long do they stick around?
In this post I’ll compare the first-time contributor engagement profiles of three initiatives. Each has a different purpose, and a different mode of organisation:
- Typhoon Haiyan (TH) in Nov 2013: A high-profile and urgent initiative. A first “CNN moment” which brought many newcomers to HOT. Accompanied by a larger number of one-off mapathons around the world.
- Ebola Response (ER) throughout 2014: A high-profile, multi-month sustained effort. A large amount of media coverage. Coincided with an initial wave of monthly mapathons in several cities.
- Missing Maps (MM) from Nov 2014 onwards: A larger initiative across a range of humanitarian causes. Proactive, low in urgency, with less media attention: the focus is on community-building. Monthly mapathons, heavy use of social media for promotion.
I’m using the OSM edit history as the basis for my analysis, focusing on an 18-month period from from 16th of June 2013 to 15th of December 2014. During this time, 1,582 first-time contributors joined HOT to participate in one of these three initiatives, joining one of about 100 projects. (There were many thousands more contributing, but for now we’re just interested in first-timers.)
Here’s a timeline of when these contributors first joined, with a bubble for each new contributor:
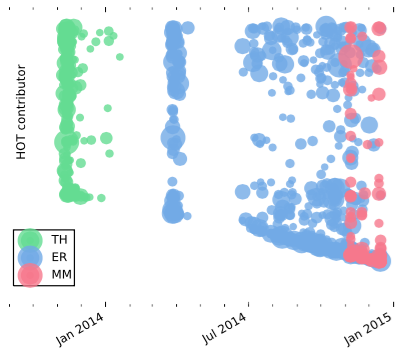 Each new contributor is visualised with a bubble. Bubble sizes represent the amount of labour hours the person contributed in the first 2 days. Contributors are ordered vertically by their OSM ID: older user accounts at the top, new accounts at the bottom.
For each of these contributors we’ll build an engagement profile. For the purpose of this analysis I’m using quantitative measures of engagement, these are easy for me to produce across a wide range of projects:
- Short-term activity: labour hours, contribution rate in the first two days.
- Short-term retention: the share of contributors who remain active in HOT on day 2.
- Long-term retention: the share of contributors who remain active in HOT in month 2 and 3.
Findings: initial activity and retention of first-time contributors
When we model first-time contributor engagement in this way we can see some similarities across the three initiatives, but also some striking differences. I’ll discuss five key observations.
1. Baseline activity in the first 48h is surprisingly high!
Many first-time contributors participate for multiple days in a row.
The median contribution activity is ~70 mins in the first 48h. This may sound small for a typical volunteer organisation, but for an online project it’s massive! We further find that between the three initiatives, MM contributors map at the slowest pace. We’ll come back to that in a second.
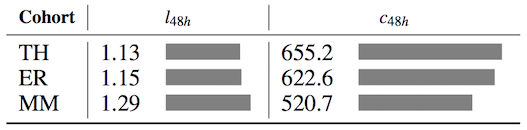 Median contribution activity in the first 48 hours: labour hours (left) and contribution rate (right, in edits per hour).
2. Prior experience affects performance.
More experienced users tended to contribute faster and work for more hours, and come back the next day. This effect can be observed globally, and for each of the project groups we observed. This either suggests that there is a training effect for OSM users which is transferrable to HOT, or a self-selection bias: contributors who enjoy mapping may simply be more engaged in general, be it in HOT or other OSM activities.
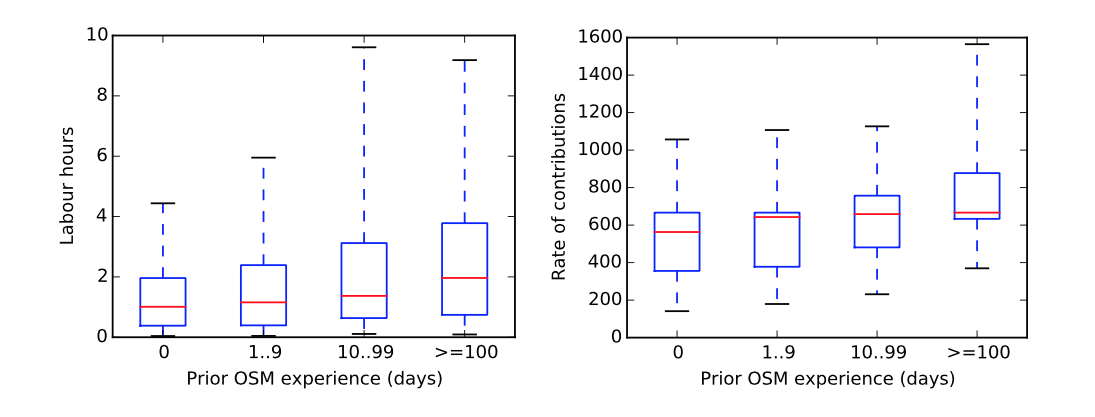 Distribution of initial activity by prior OSM experience: the amount of labour hours l48h (left) and the rate of contributions c48h (right). In each plot, contributors are segmented by their degree of prior OSM experience. Median values are marked with a red line.
3. MM contributors tend to be OSM newcomers.
How much experience does a typical first-time HOT contributor have? It turns out that this can vary wildly based on the initiative. The TH and ER groups have a mix of both OSM experts and OSM newcomers, whereas by far the most first-time MM contributors have virtually no prior OSM experience.
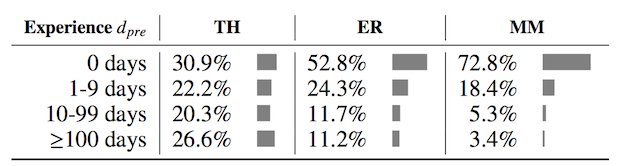 Share of participants with a given amount of prior OSM experience, measured in the number of days on which they contributed to OSM.
4. These newbies are catching up quickly.
Contributors to MM start slowly, however they catch up with others: many increase their pace of contributions in the first 48h. Compared to that, TH and ER contributors tend to maintain their initial pace.
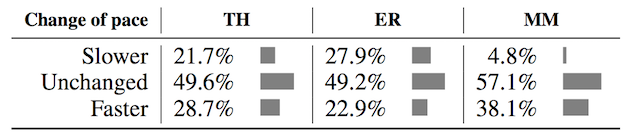 Share of participants based on their change in contribution pace between the first and second day.
5. Project purposes or modes of organisation likely have an impact on contributor retention. How many contributors to each of the initiatives are retained as HOT contributors? This is maybe the most important aspect if we care about growing an active volunteer community. For each first-time contributor we determine if they return on the second day, and whether they remain active contributors to any HOT project during the second and third month after their initial contribution. Comparing HOT initiatives in this manner uncovers some remarkable differences in retention.
Contributors to TH engaged in much short-term activity in the first few days, however in the longer term none of the contributors remained active! In comparison, about 8% ER contributors are retained as HOT contributors in the second month, and 1% in the third: they slowly fade away.
In contrast to this MM has the lowest short-term retention, yet the highest long-term retention: contributors do not tend to come back on the second day, however they are more likely to remain active a month or two later. A remarkable accomplishment.
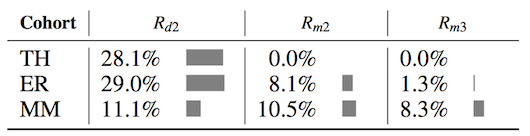 Median retention for day 2, and months 2 and 3.
Implications
I would argue that the HOT community is highly engaged already. Most volunteers contribute for more than an hour within the first two days of their initial contribution, and a significant percentage of contributors is retained for longer periods.
The data suggests that the capacity-building strategies of ER and MM initiatives work particularly well: in these two initiatives, a good share of contributors kept coming back. No doubt this is because both were longer-term initiatives, so first-time contributors may have felt a responsibility to keep contributing. However I suspect there may be additional reasons. Maybe most importantly, monthly mapathons in a growing number of cities provide welcoming social spaces with expert guidance, peer learning, and all kinds of enjoyable experiences. In addition to that MM appears to foster a more well-connected community, with the means of notifying interested contributors of new causes via Facebook, Twitter, email alerts, …
I believe that given a choice, newcomers are best placed in projects where they have a higher likelihood of being retained. In our case this would be the ER and particularly MM initiatives: projects that are specifically set up as long-term initiatives. Additionally there are indications that particularly MM was successful at retaining and training absolute newcomers with no prior OSM experience.
Another key observation is that as HOT grows and starts new initiatives we’re gradually reaching outside the existing OSM community. Most first-time contributors now have no prior OSM experience, this was quite different in the beginning. This certainly affects how we should approach and support HOT newcomers.
By Martin Dittus (@dekstop) in 2015. This was produced as part of my academic research together with Licia Capra and Giovanni Quattrone. A paper which includes this work and more is now under review.
Discussion
Comment from dkunce on 22 June 2015 at 18:35
Love the analysis. I think its important to note that Missing Maps was officially launched at the beginning of November. Given our monthly mapathons in the last six months I bet that our retention rate and speed is only getting better while still attracting more first time users.
Would really like to see this same analysis done over a full year of Missing Maps, especially given that Ebola and the Nepal earthquake were both significant events.
Comment from jonwit on 22 June 2015 at 19:19
When it comes to data science you excel.
How did you calculate time?
~70 minutes thats fantastic!!
Comment from SimonPoole on 22 June 2015 at 23:11
What is the split in absolute numbers of the total of ~1500 for starting in TH, ER and MM?
I find your interpretations of the results rather biased, for example an alternative explanation for the lower (HOT, not OSM in general) retention rates of TH and ER could be that the more experienced contributors prefer mapping on their home turf to staring at not particularly good images of places of which they have no 1st hand experience. Obviously this would not be something that effects the majority of MM contributors due to lack of any other experience.
Comment from dekstop on 23 June 2015 at 00:17
dkunce – yes, should be most interesting to track retention over time as Missing Maps matures. Will definitely keep an eye on it. I’d also like to compare a much larger set of other initiatives, if I can find the time.
jonwitt – many thanks! I grouped individual edits by their timestamp, with a session timeout of one hour. (I additionally estimate the duration of the first edit since we don’t know when people actually started. That estimate is simply based on the average time between edits.)
I like “labour hours” as a measure of engagement because it’s much more directly related to a contributor’s effort than the edit counts that are usual produced for such studies. Additionally it is a measure that also makes sense to organisers; e.g. mapathons can be thought of in terms of labour hours. The first time I’ve seen this measure used was in a Wikipedia paper from Geiger/Halfaker in 2013.
SimonPoole – Good points! I realise I have much more exposure to the experience of HOT newcomers, through attending mapathons and other community gatherings over the last year. As a result most of my conversations tended to be with people who come from outside the OSM community. Your interpretation certainly sounds plausible as well. Would be curious about what else you think comes across as biased! I do have a particular perspective, but I also try to make it explicit in my writing when I speculate.
The contributor split is:
Comment from mataharimhairi on 23 June 2015 at 02:57
Thanks for this fantastic study! Your investigation and analysis have backed up my own personal presumptions in regards to the contributions made by the amazing volunteers. It is extremely insightful and very beneficial to see where HOT and the OSM community should be targeting our efforts to assist mappers both newcomers and experts.
Comment from PlaneMad on 23 June 2015 at 03:02
@desktop this is fantastic, would love to know the tools you use for processing this data. Was curious to see similar stats for the Nepal activation which was the biggest till date and if there were any anomalies from TH and ER due to the much higher media coverage.
Comment from PierZen on 23 June 2015 at 03:06
Is your retention measure vs OSM activity in general or HOT specific tasks you determine? I suspect that you measure the total OSM activity. Otherwise, I would also consider this as a biased measure of the OSM retention.
Your MM sample is too small and the time span too short to conclude at this point about the trajectory of the contributors. Yes it would be interesting to measure over longer periods. Measure of retentions up to 6 - 9 months would help to analyze further the trajectories of contributors.
It would be interesting to compare the trajectory of contributors that participate to periodic meetings with others, to see if they have the same mapping profile, how their volume of objects edited progress.
Comment from dekstop on 23 June 2015 at 03:57
Thanks mataharimhairi!
PlaneMad – it’s all done “by hand”, I’m intending to write a little about that in a future post. I’m using Osmium to extract data from the OSM edit history, data is stored in a Postgres DB, analysis happens in Python (mostly using IPython and various analysis/visualisation libraries.) Went through loads of iterations to find a combination of tools that work well for me, e.g. in earlier work I used Pig on EC2 but that was just too much hassle. No Nepal data yet because I finished my analyses just around the time that happened.
PierZen – I’m not looking at OSM activity outside of HOT contributions at all, this is entirely about HOT activity and HOT retention. And yes I agree, there’s much more we could look at :) Including how HOT vs other OSM contribution patterns relate – e.g. do HOT contributors turn into OSM contributors?
Comment from mcld on 23 June 2015 at 07:39
Martin this is fantastic analysis, thanks!
One possibility, regarding the difference between Missing Maps and the other projects, is that the newcomers might be coming from different “constituencies” - i.e. the newcomers might be inherently different before they start. I know that all of the projects have benefited greatly from having people come in through their MSF / Red Cross / other NGO participation, but it was particularly true for MM, and maybe that affects the continued engagement levels you’re seeing. Just a thought.
Comment from Vincent de Phily on 23 June 2015 at 08:07
Very interesting study, thanks.
Do you think you could analyze the changesets to determine local vs remote MM contributors, maybe using the amount of names and POIs added ? I suspect the retention profile would be quite different between these two.
Comment from dekstop on 23 June 2015 at 10:17
Thanks Dan! Yes I agree that there are likely different audiences involved; unfortunately that is hard to establish without actually interviewing people.
Vincent de Phily – thanks! There are a number of ways in which we could look at local HOT mapper contributions, that’s certainly on my list of things to look at. As far as I’ve seen that is likely to be a much smaller number of people though, at least at the moment, so it might be more tricky to find generalisable observations. And of course they’re hard to identify. Identifying based on contributed “local” knowledge is an interesting thought, although that can also happen remotely via field papers. For a project last year I tried to identify locals by their prior edit history (people who predominantly had local OSM contributions prior to the activation), and found that people with such profiles are exceedingly rare – I think local HOT contributors tend to be new to OSM. In some cases we might be able to identify them based on participation in training events etc.
Comment from PierZen on 23 June 2015 at 14:39
@deskstop The main objective of the Activations is not to bring in new HOT contributors and assure their progress. This is to respond to an emergency. But these events are surely very motivating and bring in a lot of new contributors. Many organisations, universities, OSM local communities and Missing Maps, etc take the opportunity of the media coverage about such events to invite people to their mapathon. If a local OSM community or Missing Maps has success retaining contributors participating to such events, should we say that HOT lost this participation?
This is a biased analysis to consider only specific HOT activities to evaluate retention of OSM mappers.
Adding to that, your sample size and time span are too short to conclude anything.
Comment from joost schouppe on 30 June 2015 at 07:11
I don’tg exactly understand the measure of labour time. There are only timestamps every time you hit save, right? So for the first session, you can only guess. How many users only have one session? If this is a high number, your assumption will have a large impact on the estimate of average labour time.
The most striking graph for me was the box plot with experience/contribution rate. The median experienced user didn’t really contribute much more than less experienced ones. But by the plot, the avarage would be much higher. So among the experienced mappers, there is a small minority who does A LOT of work. But it’s not because you’re an experienced mapper, that you belong to this super productive group. And it probably has to do with what you pick: if you trace five new roads in half an hour, you’ll have much less changes to your name as when you reclassify fifty in the same time.
Comment from dekstop on 1 July 2015 at 12:24
PierZen – I’m certainly not suggesting that someone who stops contributing to HOT is “lost” for OSM :) In this post I don’t look at OSM retention at all, as I mention above. My aim was to look at HOT participation in isolation, which to me means anything published on the tasking manager, including Missing Maps and a growing number of other projects that are not about disaster response. I also don’t think that any of the activities on OSM are in competition: currently it feels like there is an abundance of potential contributors, and I don’t anticipate an end to this anytime soon.
And yes, many OSMers have found other things to keep them busy than just contributing to HOT :) I fairly consistently found that OSM experts tend to have lower average HOT retention than OSM newcomers. Most likely they tend to join briefly for key initiatives, but then continue with other OSM work.
joost schouppe: Across all HOT contributions I’ve looked at (including earlier periods), about 10% of users submitted only one changeset. However even in those cases, some of the changesets have individual timestamps for distinct edits. The aggregate effect is that only 3% of the changesets I’m looking at have a recorded duration of 0. Based on these numbers I agree that we’re probably under-counting the actual duration of people’s sessions, however I think the effect is relatively mild. Particularly since what we care about is not greatest accuracy, but merely the ability to compare approximate effort across different initiatives.
Regarding your last point about highly prolific experts: I expect (and I’m sure you know this much better than I) that there are different ways of speeding up your contribution rate by knowing your tools better, so any differences in rate may actually simply be the result of different tool use. And yes, in many projects across OSM there tend to be a small number of people who just never seem to stop mapping… :)
Comment from joost schouppe on 1 July 2015 at 20:27
That is good to hear. I never thought the timestamps could be this useful. If ever I find the time to work on my project, I’ll replace this measure of work with a more detailed one. I just counted the number of active days of all mappers - but then it would look like it does make sense to count actual mapping time. Which would be pretty cool - to make a map of the total hours worked on a given area in OSM.