OpenStreetMap

Mapanauta's Diary

Recent diary entries

Dear HOT Voting members, HOT staff, HOT volunteers and people interested in HOT, Humanitarian and Open Mapping,

I hope this message finds you and your loved ones well and healthy. I would like to present to you my end of term report as President of the Board. On 10 February 2021 I shared a detailed annual report for 2020. In this new report I would like to focus on challenges, ongoing efforts, key learnings and achievements.

Challenges

Of all the anticipated challenges while participating as a Board Member, a global pandemic was not on our list. It was a difficult and challenging time for Voting members and staff and the Board members were not an exception. Board members, like many other people, were facing difficult situations with loved ones getting infected, trying to find a balance between working from home and taking care of their families, among many other difficult situations.

This could be one of the reasons why not every Board member was contributing equally. Being part of a Board requires certain commitments such as time and asynchronous participation to be able to be part of the decision making process, often outside of Board meetings. Some Board members were not responsive or slow on providing feedback in discussions, this caused delays in progress and decision making.

My suggestion to future Board participants is to review in advance the Board Procedures and other relevant documentation to make sure you can commit to this two year period.

The Board usually meets at least once per year to have in person meetings and do planning together, these “in person” intensive meetings help with the Board relations and make efficient progress that sometimes can take weeks or even months in online meetings. In the last two years we were not able to have in person meetings and interactions in events, we tried to stay positive and motivated following the rules of the new normality, it was a challenge we had to live with and we tried to make the best of what we had available.

During this term the concern of a Board having certain skills was raised, it will be great to see certain expertise such as finance or law among others skills to support in the different committees. If current and future Board members do not have this expertise, having the support of advisors can help to fill those gaps. I strongly recommend considering the advisor figures in future discussions, other organizations already have them and I believe it will be of great help for the Board and the organization.

Ongoing Efforts

Transition and hand over meetings. Allen Gunn, who is a knowledgeable consultant from Aspiration Tech is helping the Board to organize, improve and communicate better. Allen will also be helping in the transition meetings we will be having with the new Board members so we can have a smooth transition and a reduced learning curve with the new Board so they can focus on the things that matter to the membership and the organization.

When the new members are elected we have a Buddy program in place so the new Board members can count on someone they can rely on and will make sure every question about the new role is answered or addressed. This is in addition to the transition gatherings we are already organizing.

Together with Inna Nogeste, Board Assistant, we prepared a list of topics that remain open and need to continue the conversation with the new Board members.

Key Learnings

From my side, I can share that I learned so much from my fellow Board members, from the voting members, from the staff and from working together with the Executive Director. Usually I like things done fast and I can be too practical but in an NGO like HOT things can be slower than I am used to, the main reason is that there are so many factors and people involved that things can take a lot longer. I learned I had to be patient and when the conditions are the right ones, then decisions can be taken.

For all future Voting members that consider being part of the Board one day, I strongly suggest you get familiar and study the Robert Rules of order. I didn’t know anything about them and it is a great tool to have efficient interactions in the meetings and in the decision making process of the Board. I also recommend attending Board meetings from HOT, OSMF, OsGeo and any other organization that matters to you. This is important to get familiar with Board rules and interaction. One of the things I suggested to the other Board members was to rotate every couple of months the responsibility for chairing the monthly Board meeting so everyone could practice and get familiar with the process. Unfortunately, even though the answer was positive it didn’t get any traction.

Achievements

Let me share below some of the achievements over the last few months:

Board Procedures.

After several months of work we were able to finalize the Board Procedures. The goal of this document is to help the Board to have guidelines that govern their work. The document was ratified on 21 July 2021.

HOT Europe registration.

After different conversations in the Board and Executive Committee meetings a message to the membership was sent to see their position and comments about registration in Europe. The feedback from the Voting members was positive so the Board extended a recommendation to proceed to register in Europe.

Code of Conduct Committee.

Reactivation of this committee to be up and running in case there is a need of support.

HOT East Africa Board.

After interviews conducted by Ben Abelshausen, Miriam Gonzalez and with the support of the rest of the Board members three members were selected to be part of HOT East Africa Board which was one of the requirements to be able to register locally.

New defined HOT Areas of impact.

The Board approved five focus areas for HOT’s work. This exercise to reduce eleven to five focus areas was supported by input from participatory exercises such as the Theory of change. The new areas are listed below:

*Disasters & Climate Resilience

*Sustainable Cities & Communities

*Public Health

*Gender Equality

*Migration Displacement

Collaboration in defining and review OKRs (Objectives and Key Results).

It is the first time the organization is defining OKRs, this is a major step forward to be able to track progress and enable measurable goals. The Board was able to support this process and request a presentation of the advances from HOT’s leadership team. More details in the next point.

HOT Leadership team presentation to the Board and Voting Members.

The complete HOT leadership team presented the advances, challenges and plans to achieve their goals in their own areas. This is a very important transparency exercise so Voting and Board members have interactions and receive information not only from the Executive Director but also from the people responsible from the different areas in the HOT organization and Regional Hubs.

MoU signed with OsGeo

This is a collaboration I am very excited about, open source is at the heart of the HOT Community. In different regions it is common that local communities and voting members already participate in both HOT and OsGeo so formalizing the collaboration is a great step forward to continue building open source tools and run more projects with an open source focus. The Goals of the partnerships are the following:

A. Communicating about HOT’s tools on OSGeoLive.

B. Promoting development of open geospatial communities in HOT priority countries, OSGeo local chapters working together with the Regional Mapping Hubs

C. Promoting the use of open source geospatial tools (such as Geonode and QGIS) in HOT projects and with the humanitarian mapping community

D. Showing visibility of partners on both sides during events

E. Working together over conferences including HOT Summit & FOSS4G

If you want to read more details please check https://wiki.osgeo.org/wiki/MOU_HOT

Participated in the Organization Growth

Last but not least, something that makes me very proud is that I was able to support and oversaw the organization’s work during a period of unprecedented growth and scaling at HOT.

Some personal additional notes:

When I started participating in OpenStreetMap back in 2014, I never imagined how OpenStreetMap and HOT would become such an important part of my life. I am honored to have had the opportunity to be President of the Board of Directors. Being inside the organization during these times felt both gratifying and also sometimes intimidating with so many things happening around you that could impact the future of at least 1 billion people. Over the past two years during the pandemic we witnessed how companies and organizations were struggling to survive. We are already initiating the second year of the Audacious project and we are already witnessing important actions such as the Open Mapping Hubs starting operations in Asia-Pacific and Eastern-Southern Africa. Local communities will be leading and defining their priorities to ensure the project is self-sustainable thanks to local knowledge and local participants. I want to think one step further and plant the seed to start thinking about how this data can create social entrepreneurship in these 94 countries so more people can create wealth that can bring more people out of poverty. I am sure that my dream of a better future for those people who are still missing from the world’s maps will become a reality.

People have been asking me if I would run again, sure! One day I will be glad to serve again, but at this moment in my life I need to focus on other geospatial and personal projects. One of these projects is collaborating in the FIRE Forum (Forum for Innovation and Research in European Earth Observation) as Earth Observation evangelist, the goal is to promote the adoption of Earth Observation Data and technologies so Europe can achieve the goal to become Climate Neutral by 2050. The other, of course, involves working together with the rest of Geochicas about how we visualize the future of the Geochicas initiative.

I would like to thank Ben, Felix, Kate, Maning, Rob and Trudy for being incredible Board colleagues and especially Tyler, I enjoyed working together and learned so much during this collaboration. So many different backgrounds, experiences and points of view gave this Board its strength. Regardless of the times the world is going through we were able to have significant progress in different topics.

Last but not least I want to thank all the Voting members who trusted me and gave me their vote to be part of the Board. I hope I didn’t disappoint you but there is always space for improvement so if you want to reach out and provide your feedback, I would be glad to have a conversation with you.

Stay well, I hope to see you in someplace in the world and in future events. Let’s continue growing together in this Geospatial and Open Mapping journey.

Gracias, Thanks, Merci, Asante Sana, Salamat,

Miriam González

President, Board of Directors 2019-2021

Humanitarian OpenStreetMap

@mapanauta

Hi to all,

I would like to introduce myself and share my interest of being part of HOTOSM board.

I have had the privilege to participate in various projects involving Humanitarian Mapping. As a volunteer I have been representing OpenStreetMap and HOTOSM in different forums and I am Co-Founder of the Geochicas initiative in the one we want to impulse more female presence in Geospatial technologies and increase the number of women adding Open Data in OpenStreetMap.

Most recently I participated as HOT volunteer in Guatemala. HOTOSM Team was supporting the Clinton Health Access Initiative and the Guatemala Ministry of Health to assist local technicians who are in the field all year fighting diseases such as Dengue, Zika, Chingkonkuña, and Malaria in the area of Escuintla. HOT arrived in Guatemala to support the Ministry of Health with the use of Open Data Kit (ODK) and OpenMapKit (OMK) in order to have a more detailed census and action plan using open source tools so the goal to eliminate malaria can be tracked and achieved by 2020. I participated in the training activities with the HOTOSM team.

Since 2014 I became fascinated with HOTOSM and OSM when I realized all the potential it could have to change people realities and how we can improve their lives so I started getting involved in the Open Data and Open Mapping world. In 2016 on behalf of HOTOSM I received the honor of being one of the 50 Digital Leaders of Mexico and last year INEGI (after a few years of exchanging communication with them) invited OpenStreetMap Mexico to be part of the Consulting Council to be able to review their strategy and tools before launching to the public.

HOTOSM has helped me to educate diverse organizations about the importance of Geospatial Open Data. I believe as a board member I can help to make decisions that will be shaping the future of the organization and I consider the way we currently maintain the Voting Members is not sustainable, in the short term HOTOSM will be having a large number of voting members without really being involved in the organization decisions and we need to change that.

Thanks in advance for your time on reading my manifiesto,

Miriam @mapanauta

Hi to all,

As some of you might know I am candidate for the OSMF Board election 2018. There is diverse group of candidates and I am sure every single one will be doing a great job if they are elected. Please find the information and manifiestos here. I was not able to complete all my answers by the deadline so please find the pending answers below:

The values and goals of the OpenStreetMap project

I agree with the core value and goals covered in the mission of the OSMF website but I consider specifically regarding the goals we need to find a way to measure the achievements and set up statistics to be able to know if we are going in the right way or where are we failing to achieve the objectives.

Your opinion on Term limits for board members?

I agree with having limited term limits, I don’t thing it is healthy for any organization having the same people in a Board for a long period. More people should  have the opportunity to be part of the board and provide diverse and fresh ideas. When a person knows they have a limited period to cause impact I believe they can be more efficient.

Your opinion on Organized editing

I believe this is a good start and this is a good way to enforce the quality of the data in OSM. In my own experience I helped to coordinate mapathons in Universities where the largest audience we had was eighty eight mappers, of course this was with the help of the professors in the Universities, so we have to make sure the guidelines do not discourage community events and the excitement of organizing  events (which is already a lot of work). For the companies it will be good because that way a standard about what is expected from them will be open an available. Regarding small organization or enthusiatic groups I will say mentioning examples in a wiki will help understand the scope of the guidelines.

Due diligence reverting edits

Reverting should be always discuss but I believe there could be either unintencional errors or vandalism and we can see that immediately from the changeset. If it is vandalism (such as a hate message) it should be revert immediately and if is an error we should communicate with the mapper to make her/him aware of the mistake and if the person do not take action then proceed with reverting.

Criticism on social media

We need to be open for criticism and even sometimes can be harsh we should take something positive out of it because that will make us stronger as individuals and as a community. I also believe even we agree and disagree in many points the community should be able to communicate in a respectful and polite way.

Thanks,

Miriam

Happy mapping with OpenStreetCam in Guadalajara!

Posted by Mapanauta on 28 September 2018 in English. Last updated on 29 September 2018.

[English] As many of you know today is my last day in Telenav, I already wrote a blogpost sharing with you this journey, please find it here. I also would like to share with you the latest city I helped to coordinate adding images in OpenStreetCam, the beautiful city of Guadalajara (also called the mexican Silicon Valley ;) ). There are more tan 7,500 kms full of images just for you! Please join the efforts adding POIs, Street names and more details to this wonderful city!

Happy mapping!

[Español] Como muchos de ustedes saben el día de hoy termino mi periodo laboral con Telenav, escribí un blog compartiendo esta etapa que podrán encontrar aquí. Me gustaría también compartir con ustedes más de 7,500kms de calles y carreteras llenas de imágenes de la hermosa ciudad de Guadalajara que encontrarán en OpenStreetCam. Imágenes que espero les sirvan para mejorar los datos abiertos de la ciudad. Pueden ayudar agregando POIs, nombres de calles y más detalles a esta increíble ciudad.

¡Feliz mapping!

Guadalajara with OpenStreetCam

Traducción del Diary de Martijn https://www.openstreetmap.org/user/mvexel/diary/43767

ImproveOSM is mi esfuerzo como empleado de Telenav para procesar billones de puntos GPS de nuestros usuarios y socios para convertirlos en tareas procesables para mappers. Actualmente estamos detectando restricciones de vueltas faltantes, caminos faltantes o con sentidos de circulación equivocados. La forma más fácil para trabajar es esas tareas es instalando el plugin JOSM

Ahora que tenemos la nueva versión de MapRoulette, pensé que sería bueno hacer algunas de esas tareas disponibles también a través de MapRoulette. Esto las hace un poso más manejable debido a que tenemos 80,000 calles con sentido único faltante o equivocadas, casi 300,000 restricciones de vueltas y casi 1.6 millones de mosaicos con calles faltantes. Para dividir esas cifras, empecemos con un esfuerzo de país-a-país para agregar caminos faltantes. Creé un desafío para Colombia que puedes encontrar aquí. Déjame llevarte por el proceso de resolver una tarea de caminos faltantes. Utilicé JOSM para mi ejemplo. También puedes usar ID, así podrás brincarte los pasos que involucran los plugins JOSM.

1. Instala el plugin de JOSM

Si estás usando JOSM, abre las preferencias en el plugin y busca ImproveOSM. Instala y reinicia JOSM. Esto te dará tres capas del mapa de los diferentes tipos de tareas. Establecí la opacidad de la capa de caminos faltantes más baja debido a que los mosaicos pueden dificultar ver las imágenes.

2. Escoge una tarea

Ve al desafío y da clic en ‘Start’. Serás llevado a una tarea al azar. ## 3. Completa la tarea El marcador de la tarea en MapRoulette apunta hacia el centro de un mosaico de caminos faltantes de ImproveOSM.

Algunas veces el camino faltante no está exactamente en esa ubicación. Te puedes asegurar dando clic en Edit (asegúrate que JOSM está corriendo y el control remoto está habilitado) e inspeccionando las imágenes aéreas. También podrás ver el mosaico de ImproveOSM o los mosaicos usados para crear la tarea MapRoulette.

Después de agregar los caminos faltantes (y otras cosas que faltan o necesitan edición), puedes subir tus ediciones. Vas a notar que MapRoulette ha agregado automáticamente y apropiadamente comentarios en el changeset para ti.

4. Resolver mosaicos de ImproveOSM

Antes de Volver a MapRoulette, toma unos segundos para activar la capa de caminos faltantes de ImproveOSM, seleccionando los mosaicos afectado da clic en ‘Solve’ en el panel de ImproveOSM. Puedes arrastrar para seleccionar mosaicos múltiples fácilmente.

5. Repetir

Ahora podrás regresar a MapRoulette y darle clic ‘I fixed it’ si agregaste caminos faltantes. Si no existían imágenes aéreas apropiadas, o no estabas seguro qué agregar, puedes darle clic en ‘Too difficult / couldn’t see’. En caso que los caminos que ImproveOSM pensaba que faltaban ya han sigo agregados por otro mapper al mismo tiempo, selecciona ‘Already fixed’. Ahora puedes regresar al paso 2 y continuar agregando caminos faltantes. ¡Feliz mapping!

¿Quieren más?

Si te gustaría ver un desafío de MapRoulette para tu área ¡por favor contáctame!

Nuevo MapRoulette beta

Posted by Mapanauta on 4 April 2018 in Spanish (Español).

Traduccion de la versión de Martijn publicado aquí ttps://www.openstreetmap.org/user/mvexel/diary/43596

Hola a todos, me gustaría presentarles la nueva versión de MapRoulette e invitarlos a probarla. Actualmente está en beta y su retroalimentación e ideas para mejora son bienvenidas. Esta información también aparece en la sección Wiki del repositorio de GitHub. No duden en ingresar problemas que hayan notado ahí ¡me gustaría escuchar sus comentarios!

MapRoulette es una herramienta web para llevar a cabo micro tareas en OpenStreetMap. Te proporciona tareas pequeñas de menos de un minuto para mejorar OpenStreetMap. Cualquiera puede crear un grupo de tareas, llamadas Desafíos, que la comunidad puede completar juntos.

Esta es la tercera version de MapRoulette. El sitio web has sido rediseñado completamente y contiene muchas nuevas características comparado con el último gran reléase.

Comparando MapRoulette 2 y 3

Aquí encontrarán algunas de las características más visibles

Búsqueda

Mejores formas de encontrar Desafíos en los que estás interesado ha sido una de los requerimientos más solicitados. Hemos pasado bastante tiempo pensando en esto y escuchando tus comentarios. Pensamos que vas a disfrutar realmente las nuevas formas que MapRoulette ofrece para descubrir Desafíos interesantes para que trabajes en ellos.

Categorías

Autores de desafíos pueden ahora asignar una categoría a sus Desafíos como pueden ser, Caminos y carreteras, Edificaciones o Land Use. Puedes usar estas categorías para rápidamente identificar los que te interesa a ti.

Ubicación

MapRoulette 3 muestra un filtrado muy mejorado basado en ubicación. Puedes limitar tu búsqueda de Desafío a lo que actualmente ves en el mapa así como darle zoom y mover alrededor y comenzar el mapeo en un área alrededor de la ubicación inicial que estableciste en los ajustes de OpenStreetMap.

Libre texto

Puedes usar texto libremente en el campo de búsqueda para filtrar resultados que vayan de acuerdo a cualquier texto que ingreses. MapRoulette va a buscar títulos de desafíos y descripciones para ti.

Lista de Desafíos

Una lista de desafíos que vayan de acuerdo con los resultados de filtrado es siempre visible en la parte izquierda de la ventana de MapRoulette. Va a actualizar en tiempo real mientras selecciones filtros de los menú que se despliegan hacia abajo, usa el campo de texto libre y panea o dale zoom al mapa.

Despliegue del Mapa

MapRoulette te va a mostrar donde están ubicadas las tareas en un Desafío cuando le des click en un Desafío en la lista. Mientras la información se descarga, MapRoulette primero va a desplegar un cuadro con límites para darte una idea. Cuando las ubicaciones de las Tareas han sido descargadas las verás en el mapa. Si hay muchas serán agrupadas. Haciendo zoom comenzarás a ver tareas individuales. Puedes darle click a una tarea para comenzar a trabajar en ella.

Trabajando en las Tareas

MapRoulette ahora te da más libertad de decidir cómo quieres trabajar en MapRoulette

Al Azar o Cerca

El nombre MapRoulette sugiere un elemento de posibilidad. Tareas dentro de un desafío solían ser dadas totalmente al azar. Esto significa que vas yendo alrededor del mapa mientras trabajas en las Tareas. No todo mundo apreciaba eso. Recibimos muchas peticiones para trabajar Tareas en áreas específicas. MapRoulette ahora ofrece esto. Después de comenzar una tarea, puedes decidir si quieres que la siguiente sea cerca o al azar dentro del mismo Desafío. MapRoulette va a recordar tu opción para ese Desafío.

Para cambiar este ajuste mientras se está trabajando en tareas, busca el control de Al azar/Cerca de en las Opciones en el área.

Rastreo de Tareas

MapRoulette ahora te deja llevar seguimiento de una Tarea. Esto es muy útil si quieres una forma fácil de regresar a una Tarea después. Cuando buscas una Tarea, esta será agregada a la lista de Tareas seguidas en tu página de perfil.

Para rastrear una tarea, da click al botón de Rastreo en el área de Más Opciones

Guardando Desafíos

Si te gusta un Desafío en particular, MapRoulette ahora ofrece una forma fácil para guardarlo. Cuando regresas a MapRoulette tus desafíos guardados siempre aparecen en la parte superior de la lista. Para guardar un Desafío, da click en el título para desplegar los detaller, luego da click en “Guardar”. Puedes “Dejar de Guardar” de la misma forma.

Trabajando Juntos

Comentando

MapRoulette te deja comentar en tareas individuales. Puedes usar esta característica para mencionar a otros mappers por qué evitaste una Tarea o la marcaste como muy difícil, por ejemplo. El autor del Desafío va a poder revisar también los comentarios, podría ser que haga mejoras en el Desafío. De esta forma puedes usar los comentarios para hacerle llegar tus comentarios también.

Para comentar en una Tarea o revisar comentarios previos busca el campo de comentarios debajo de las instrucciones de la Tarea.

Desafíos Virtuales

Un nuevo concepto en MapRoulette es el Desafío Virtual. Este es por mucho un proyecto en desarrollo y algo que realmente nos gustaría recibir comentarios. Un Desafío Virtual es un “impromptu” que puedes crear tú mismo desde las Tareas disponibles en el área que te interesa. Esto te permite sistemáticamente resolver todas las tareas de MapRoulette, entre Desafíos, en tu área ¡Esto puede ser divertido y muy útil para un Mapping Party!

Para crear un Desafío Virtual, ve a la lista principal de Desafíos y da click en Desafíos en la parte de arriba del Menú. Siguiente, usa el mapa para con zoom acercarte al área que estás interesado. Cuando te hayas acercado los uficiente vas a ver tareas indiviudales cargadas y desplegadas en el mapa. También vas a notar que un botón “Trabajar en Areas mapeadas” aparecerá en la parte de arriba de la lista de Desafíos. Dándole click a este botón puedes crear un Desafío Virtual que consiste en todas las Tareas Virtuales visibles. Si quieres, puedes usar los filtros para reducir las Tareas antes que crees el Desafío Virtual.

Compartiendo en Redes Sociales

Cuando trabajar en un Desafío, ahora es fácil compartir un enlace vía email o en una red social seleccionada usando el área de compartir en redes cerca del botón de la barra de tareas.

Prueba la nueva versión aquí http://maproulette.org/mr3

Mapeo Humanitario Libre y Abierto en respuesta a los terremotos de México

Posted by Mapanauta on 14 October 2017 in Spanish (Español). Last updated on 15 October 2017.

A principios de septiembre nos estábamos enfrentando a algunos de los huracanes más fuertes del Caribe en las últimas décadas, el equipo de mapeo humanitario [HOTOSM] (https://www.hotosm.org/projects/hot_activates_for_multiple_disasters_hurricane_irma_and_maria_mexico_earthquakes_and?utm_source=Bolet%C3%ADn+Mensual+de+SocialTIC&utm_campaign=2f37c5d580-EMAIL_CAMPAIGN_2017_04_27&utm_medium=email&utm_term=0_ade63aa0ff-2f37c5d580-139103741) ya estaba colaborando a toda velocidad para ayudar a crear mapas en las áreas donde los datos eran limitados o inexistentes. Pocos días después los estados del sur de México estaban siendo golpeados por el primer terremoto, Oaxaca y Chiapas son conocidos por ser estados con una gran población marginada, en la comunidad de OpenStreetMap hemos estado discutiendo anteriormente sobre la necesidad de crear mapas detallados para estos estados que carecen de datos libres y abiertos de sus poblaciones. Los voluntarios de la comunidad de OpenStreetMap México solicitaron ayuda a HOTOSM para crear tareas y así agregar datos valiosos como edificaciones y carreteras en las ciudades y localidades donde la ayuda era más urgente. Una de las ciudades más afectadas fue Juchitán

Edificaciones en Juchitan

En ese momento creamos un grupo de Telegram llamado #TerremotoMexicoMapping en el cual voluntarios de la comunidad OSMMX y estudiantes que habían participado en talleres en la Universidad del Estado de México comenzaron a colaborar creando archivos Geojson y mapeando pueblos y ciudades de Oaxaca y Chiapas, no éramos más de once personas en el grupo. Para el 15 de septiembre ya se han cartografiado 984,312 objetos en Juchitán, Ixtepec, Matias Romero, San Mateo del Mar, Pijijiapan, Tonalá, entre otras localidades (encuentre la lista completa en http://bit.ly/MXEarthquakeMapping estos Datos abiertos geográficos crowsourced ya se encontraban disponibles en el Base de Datos Abiertos geográfica más grande del mundo, OpenStreetMap prácticamente de forma inmediata al guardar el changeset. Avances de mapeo en Oaxaca y Chiapas Mapping en Oaxaca y Chiapas despues del terremoto de 8.1M

Personas con experiencia en este tipo de eventos, como Daniel Orellana de la comunidad #MappingEcuador y los amigos de Kathmandú Living Labs (KLL), con gusto compartieron sus experiencias así como comunicaron lo que funcionó para ellos y así asegurarnos de no perder tiempo muy valioso. La herramienta de Quakeinfo.org mostrada por KLL era algo que ya tenía pensado Leo Castañeda por el conocimiento obtenido al mapear los incidentes de tráfico de Repubikla y sería la base para mapa.sismomexico.org

En menos de lo que pensamos, el segundo terremoto nos sorprendió afectando a la Ciudad de México, Morelos, Puebla, Estado de México y Guerrero, se agregaron más tareas a la Wiki estábamos agobiados por la cantidad de daños que enfrentamos y necesitaban ser mapeados pero al mismo tiempo el segundo terremoto hizo que las personas que no reaccionaron en el terremoto del 7 de Septiembre quisieran participar en cualquier cosa posible. Se crearon más tareas de mapeo por voluntarios digitales de HOTOSM y convocamos en un twitter a personas que tenían experiencia en Visualización y Análisis de Datos que se unieran a nuestro grupo de Telegram. De 11 personas, en pocos días el grupo tenía más de 150 personas interesadas en crear mapas y análisis de datos. Una de las tareas más difíciles fue mapear las áreas afectadas de la Ciudad de México debido a la alta densidad de edificios. Si la Ciudad de México tuviera un Catastro abierto, más voluntarios digitales podrían ayudar a analizar los datos en beneficio de la CDMX, lamentablemente los datos tienen acceso restringido y está reservado para su posible apertura ¡hasta el año 2023! (pero esto es material para otro blog).

Avances de mapeo en zonas afectadas Ciudad de Mexico

El 20 de septiembre se lanzó mapa.sismomexico.org, al principio se pensó que sería una herramienta para agregar reportes así como agregar / recopilar bases de datos abiertas creadas por otras fuentes, pero nos dimos cuenta de que teníamos una debilidad, no teníamos suficientes personas para verificar / validar los informes. Por lo tanto, de una herramienta para crear informes, decidimos consolidar las fuentes en un único mapa y facilitar el proceso de descarga para hacer accesibles los datos generados, de modo que las organizaciones de ayuda y ciudadanos pudieran beneficiarse de las bases de datos. El increíble equipo de [Verificado19S] (http://www.verificado19s.org/) estaba haciendo un trabajo formidable validando los datos con su ejército de voluntarios, así que cuando las personas querían agregar algo a nuestro mapa, dábamos los detalles de Gaby Marquez de HorizontalMX y evitábamos una doble recolección de datos.

Todas las acciones podrían no haber sido posibles sin el compromiso de individuos e instituciones que creen en el potencial del proyecto OpenStreetMap, como los que se mencionan a continuación:

Y especialmente gracias a lxs más de 1400 voluntarixs que agregaron una casa, una edificación, una carretera o un refugio al mapa, cada edición marca la diferencia para lograr más de 250,000 edificaciones mapeadas y casi 25,000 kilómetros de carreteras desde el 7 de Septiembre.

Gracias a todo el apoyo digital ahora tenemos datos abiertos y gratuitos disponibles para que todas las personas los utilicen, no importa si eres Voluntario, Estudiante, Gobierno, Universidad, Geek, Entusiasta de datos, todo mundo es parte de este movimiento y puede aprovechar los datos abiertos creados.

¡Nuevamente Gracias! Pero ahora … ¿qué sigue? Haz clic aquí para descubrir

Open Humanitarian Mapping in response of Mexico earthquakes

Posted by Mapanauta on 14 October 2017 in English. Last updated on 15 October 2017.

—English Version—

Early September we were facing some of the strongest hurricanes in the Caribbean ocean over the past decades, the humanitarian mapping team [HOTOSM] (https://www.hotosm.org/projects/hot_activates_for_multiple_disasters_hurricane_irma_and_maria_mexico_earthquakes_and?utm_source=Bolet%C3%ADn+Mensual+de+SocialTIC&utm_campaign=2f37c5d580-EMAIL_CAMPAIGN_2017_04_27&utm_medium=email&utm_term=0_ade63aa0ff-2f37c5d580-139103741) was already collaborating full speed to help creating maps in the areas were data was limited or nonexistent. Suddenly the Southern states of Mexico were hit by the first earthquake, Oaxaca and Chiapas are well know for being states with a large marginalized population, in the OpenStreetMap community we have been discussing in the past the need of creating detailed maps for these states among others who lack of this data. Volunteers in the Mexico community requested help to HOTOSM to create tasks to map valuable data for buildings and roads in the towns where help was needed the most. One of the cities more affected was Juchitan

Buildings in Juchitan

At that time we started a telegram group name #TerremotoMexicoMapping in the one volunteers from the OSMMX community and students who had participated in workshops in the University of the State of Mexico started collaborating creating Geojson files and mapping villages of Oaxaca and Chiapas, at that time we were no more than eleven people in the group. By September 15th there were mapped 984,312 objects in Juchitán, Ixtepec, Matias Romero, San Mateo del Mar, Pijijiapan, Tonalá, among others localities (find the complete list in http://bit.ly/MXEarthquakeMapping this crowsourced geographical Open Data was available in real time in the largest geographical Open Data Base in the world, OpenStreetMap, as soon you click “save changeset” the data is available for everyone to use.

Mapping Advances from Oaxaca and Chiapas Mapping Oaxaca and Chiapas after 8.1M Earthquake

People with experience in earthquake response mapping such as Daniel Orellana from the #MappingEcuador community and the friends of Kathmandú Living Labs (KLL) were happy to share their best practices and communicate what it worked for them and make sure we don’t lose precious time. The Quakeinfo.org tool showed by KLL was something already Leo Castañeda was preparing by the knowledge gained in mapping Repubikla traffic incidents and was going to be the base for mapa.sismomexico.org

Without having a break the second earthquake surprised us affecting Mexico City, Morelos, Puebla, State of Mexico and Guerrero, more tasks were added to the Wiki we were overwhelmed by the amount of damage we were facing and needed to be mapped but at the same time the second earthquake make people who didn’t react on the September 7th earthquake wanted to participate in anything possible. More mapping tasks were created by digital volunteers from HOTOSM and we asked in a twitter for people who had experience in Visualization and Data Analysis to join our Telegram group, from 11 people in just a few days the group had more than 150 people interested in creating maps and doing data analysis. One of the hardest tasks was to map the affected areas of Mexico City due to the high building density, if Mexico City had an Open Cadastre more digital volunteers could help to analyze the data in the CDMX’s benefit, unfortunately the data has restricted access and it is reserved for opening until year 2023! (but this is a topic for another blog).

Mapping advances in affected areas of Mexico City

On September 20th mapa.sismomexico.org was launched, at the beginning it was thought to be a tool to add reports and also add/gather open databases created by other sources but we realized we had a weakness, we didn’t have enough people to check/validate the reports so from a tool to create reports we decided to consolidate the sources in one single map and make easier the download process to make accessible the data generated so relief organizations or citizens could take benefit of the databases. The amazing team of [Verificado19S] (http://www.verificado19s.org/) was doing an incredible job validating the data with their army of volunteers so when people wanted to add something to our map we would give the details of Gaby Marquez from HorizontalMX and avoid a double collection of the valuable data.

All the actions could have not been possible without the commitment of individuals and institutions that believe in the potential of the OpenStreetMap project, such as:

And specially thanks to the 1400+ volunteers who added a home, a road or a shelter to the map, every edition make the difference to achieve over 250,000 buildings and almost 25,000 kilometers of roads since September 7th 2017.

Thanks to all the digital support, now we have Open and free data available for everybody to use, it doesn’t matter if you are a Volunteer, Student, Government, University, Geek, Data enthusiastic, everybody can take advantage of the open data created.

Thanks again!

Collaborators of the OpenStreetMap Mexico team

But now…what is next? Click here to find out

Why I would like to join HOTOSM

Posted by Mapanauta on 7 February 2017 in English.

Note: English version [EN]- Versión en Español abajo [SP]- Version Française ci-dessous [FR]

[EN] Why I would like to join HOTOSM

It was short time after Nepal earthquake when I understood and measured the power of mapping, what it could do to support people in need and how open mapping could be saving lives. I start gathering with a small group of mappers is Mexico City who got together every Wednesday evening, I wanted to learn and see what else could be done. In State of the Map US 2015 with my colleague Andres Ortiz we presented [“When will Mexico be navigable on OpenStreetMap”] (https://youtu.be/JIZD0xtRRFA) working in a technology company, [Telenav] (http://www.telenav.com/), helped us to get resources to start improving the map from the roots, we started an import project to improve the Administrative boundaries of the country going from 69 valid boundaries to 2,457 . After that conference in New York everything started moving faster. In September 2015 the 30th anniversary of Mexico city earthquake took place, the National Digital Strategy Office of the Government of Mexico in the one Rodolfo Wilhelmy was Open Data Director at that time invited me to help with part of the coordination having a Earthquake drill and making different Government entities to understand the value of Open Mapping. Thanks to the experience we gained as a community with the Earthquake simulation, at the time Hurricane Patricia was about to hit the Pacific Coast of Mexico, more than 500 mappers helped to map the area in less than 48 hours following the example from Nepal. All this community efforts were mentioned in the Internet day by the President of Mexico mentioning how HOTOSM volunteers supported this national emergency.

Along with members of the LatAm and Mexico community I engage in every conference and every workshop the importance of Humanitarian Mapping and how we can improve people lives and to have a response not only after disaster but also considering long term projects in the ones we can work together with Governments and Civil Society to reduce disaster damage with the support of maps. I gave a talk in HOT summit last year named “Future of Humanitarian Mapping in Mexico” mentioning all these topics.

I feel very honored that friends like [Humberto Yances] (https://hotosm.org/users/hyancesgmailcom ) and [Rodolfo Wilhelmy] (https://www.openstreetmap.org/user/rodowi) contacted me to see if I could be interested in being a HOT member, without hesitating I told them it is a recognition I will be grateful to have. One of the opportunities I would like to focus with the National Center for Disaster Prevention of Mexico is to teach its officials how to map and create an internal group of trainers as a sustainable guarantee. The National Digital Strategy office mentioned they are very interested in support this initiative starting to map the temporary shelters and then mapping a pilot potential risk area that can show results and motivate more regions.

At this moment most of HOTOSM successful histories are in Africa and Southeast Asia, I am convinced my contribution to the organization can help to create more successful histories in other parts of the world so we can mitigate together the damages caused by disasters and create effective protocols for emergency management.

[SP] Por qué me gustaría ser parte de HOTOSM

Poco tiempo después del terremoto de Nepal fue cuando comprendí y pude medir el poder del mapeo así como ver lo que se podría hacer para apoyar a las personas necesitadas y cómo la cartografía abierta y participativa podría salvar vidas. Empecé a reunirme con un pequeño grupo de mapeadores en la Ciudad de México que se reunían todos los miércoles por la noche, quería aprender y ver qué más se podría hacer. En State of the Map 2015 con mi colega [Andrés Ortiz] (https://www.openstreetmap.org/user/Andresuco/diario) presentamos “¿Cuándo será México navegable en OpenStreetMap”, al trabajar en una empresa de tecnología, Telenav, nos ayudó a obtener recursos para comenzar a mejorar el mapa desde la raiz, comenzamos un proyecto de importación para mejorar las límites administrativos del país que solamente tenía en ese momento 69 límites válidos y lo mejoramos a 2,457. Después de esa conferencia en Nueva York todo comenzó a moverse más rápido. En septiembre de 2015 tuvo lugar el trigésimo aniversario del terremoto de Ciudad de México, la oficina Nacional de Estrategia Digital del Gobierno de México en la que Rodolfo Wilhelmy fue Director de Datos Abiertos en ese momento me invitó a ser parte de la coordinación de un simulacro de terremoto y de esa forma hacer que diferentes entidades gubernamentales entiendan el valor del Open Mapping. Gracias a la experiencia adquirida como comunidad con el simulacro del terremoto, cuando el huracán Patricia estaba a punto de llegar a la costa del Pacífico de México, más de 500 voluntarios ayudaron a mapear el área en menos de 48 horas siguiendo el ejemplo de Nepal. Todos estos esfuerzos de la comunidad fueron mencionados en el [día de Internet] (https://youtu.be/voCHUrwiNU8) por el Presidente de México en el que comentó cómo los voluntarios de HOTOSM apoyaron esta emergencia nacional.

Junto con miembros de la comunidad de LatAm y México cada vez que tengo la oportunidad de participar en conferencias y talleres siempre comparto la importancia del mapeo humanitario y cómo podemos mejorar la vida de las personas y tener una respuesta no sólo después de la catastrofe sino también considerar proyectos a largo plazo en los que podemos trabajar juntos con los gobiernos y la sociedad civil para reducir el daño que pueden causar los desastres con el apoyo de mapas. Di una charla en la HOT Summit el año pasado llamada “El futuro del mapeo humanitario en México” mencionando todos estos temas.

Me siento muy honrada de que amigos como [Humberto Yances] (https://hotosm.org/users/hyancesgmailcom) y [Rodolfo Wilhelmy] (https://www.openstreetmap.org/user/rodowi) me contactaron para ver si estaba interesada en ser un miembro de HOT, sin dudar les dije que sería un reconocimiento que estaría honrada de obtener.

Una de las oportunidades que me gustaría desarrollar sería con el Centro Nacional de Prevención de Desastres de México en el cual se podría enseñar a sus funcionarios cómo mapear y crear un grupo interno de formadores como una garantía sostenible. La oficina de Estrategia Nacional mencionó que están muy interesados en apoyar esta iniciativa comenzando a mapear los refugios temporales y luego mapear un área de riesgo latente como prueba piloto que pueda mostrar resultados y motivar a más regiones.

En este momento la mayoría de las historias exitosas de HOTOSM se encuentran en África y el Sureste de Asia, estoy convencida de que mi contribución a la organización puede ayudar a crear más historias exitosas en otras partes del mundo para mitigar juntos los daños causados por desastres y crear protocolos eficaces para la gestión de emergencias.

[FR] Pourquoi je souhaite faire partie de HOTOSM

Peu après le tremblement de terre au Népal, j’ai compris et mesuré le potentiel de la cartographie, ce qu’elle peut faire pour aider les gens dans le besoin et comment la cartographie ouverte peut sauver des vies. J’ai commencé à me réunir avec un petit groupe de volontaires de la Ville de Mexico qui se réunissait tous les mercredi soir, je voulais apprendre et voir ce qui pouvait être fait. Lors du State of the Map US 2015, avec mon collègue [Andres Ortiz] (https://www.openstreetmap.org/user/Andresuco/diary), nous avons présenté “Quand le Mexique sera-t-il navigable sur OpenStreetMap”. Travaillant dans une entreprise technologique, Telenav, nous avons pu obtenir des ressources pour commencer à améliorer la carte depuis les bases, nous avons commencé un projet d’importation pour améliorer les vecteurs des frontières administratives du pays allant de 69 limites valides à 2457 . Après cette conférence à New York, tout s’est accéléré. En septembre 2015 a eu lieu le 30è anniversaire du tremblement de terre de la ville de Mexico, le Bureau National de Stratégie Digital du Gouvernement du Mexique dans lequel Rodolfo Wilhelmy était Directeur des Données ouvertes, m’a invitée à aider avec une partie de la coordination avec un sondage et faire en sorte que différentes entités gouvernementales comprennent la valeur de l’Open Mapping. Grâce à l’expérience que nous avons acquise en tant que communauté lors de la simulation du tremblement de terre, au moment où l’ouragan Patricia allait frapper la côte du Pacifique au Mexique, plus de 500 volontaires ont aidé à cartographier la zone en moins de 48 heures suivant l’exemple du Népal. Tous ces efforts communautaires ont été mentionnés lors de la journée de l’Internet par le Président du Mexique en mentionnant comment les volontaires d’HOTOSM ont appuyé cette urgence nationale. Avec les membres de la communauté latinoaméricaine et mexicaine, je partage dans toutes les conférences et à chaque atelier l’importance de la cartographie humanitaire et comment nous pouvons améliorer la vie des gens et avoir une réponse non seulement après la catastrophe, mais aussi envisager des projets à long terme dans ceux où nous pouvons travailler en collaboration avec les gouvernements et la société civile pour réduire les dégâts causés par les catastrophes avec le soutien des cartes. J’ai donné un discours au sommet HOT l’année dernière intitulé «L’avenir de la cartographie humanitaire au Mexique» en mentionnant tous ces thèmes.

Je me sens très honorée que des amis comme Humberto Yances et [Rodolfo Wilhelmy] (https://www.openstreetmap.org/user/rodowi) m’aient contactée pour connaître mon intérêt pour être un membre de HOT, et sans hésiter, je leur ai dit que c’est une grande reconnaissance. L’une des occasions que je voudrais mettre en relief avec le Centre national de prévention des catastrophes du Mexique est d’enseigner à ses fonctionnaires comment cartographier et créer un groupe interne de formateurs comme une garantie durable. Le bureau de la Stratégie nationale a mentionné qu’ils sont très intéressés pour soutenir cette initiative en commençant à cartographier les abris temporaires du Mexique, puis cartographier une zone pilote de risque potentiel qui peut montrer des résultats et motiver davantage de régions.

En ce moment, la plupart des histoires de réussite de HOTOSM sont en Afrique et le Sud-Est de l’Asie, je suis convaincue que ma contribution à l’organisation peut être de documenteer des experiences positives dans d’autres parties du monde afin d’atténuer ensemble les dommages causés par les catastrophes et de créer des protocoles efficaces pour la gestion des urgences.

Note: English [EN] please find the Spanish version below [SP]

[EN] Last week some members of the OSM Mexico Community had the chance to participate in the first OSM Training focused in Geography professors from High Schools located in municipalities close to the State Capital, Toluca. It was a four day event in the University of the State of Mexico. First Day It was the opening day and Edgar Lemus gave the Talk “Democratization of GIS OSM for high school education” making the professors aware about the importance of open source GeoTechnologies to get more involvement from the students and benefits in the societies. The second part of the event Edgar Lemus and myself gave the following topics to do a full immersion of the professors in the OSM world:

  1. What is Open Data? What is OpenStreetMap? What are the benefits of using OpenStreetMap?
  2. Humanitarian OpenStreetMap
  3. Mapping with ID Editor
  4. Mapping with HOTOSM Tasking Manager

Edgar Lemus presentando

Second Day The participants were previously warned the second day will be though but at the end of the day they will be knowing different tools they could use to adapt to current or future projects. So, it was a 100% mapping in the field day. Along with the professors it was decided to use every tool one hour so we could take advantage of the day out and then go back to the faculty to have pizzas for lunch (the mapper fuel!). We gathered at 9 am in Café con Leche restaurant (yes! It was added to the map) so at 9:20 we started it. a. Field papers We gathered in Los Portales an area very well located in Downtown Toluca. The previous day with the organizer Sandra Hernandez we defined an area easy for walking and divided it in four quadrants so we created teams, they will be responsible to cover the larger area as possible in one hour. The professors were very surprised to see the map and then compare it with reality. In average, each team added between 25-30 POIs in just a few blocks in downtown Using Field papers Picture-Using Field papers

b. OSM Tracker After using Field papers one of the professors asked “how can we be sure adding data manually with field papers will be exactly where it should be? So the answer was OSM tracker the next tool will give you a more exact location. We moved to a pedestrian street to capture the POIs and tracks and show them how to upload them to OSM. The professors were fascinated with the tools and we were just half the way. Banks, Convenience Stores, Restaurants, Pubs, Money Exchange among other were added to the map of Toluca. Tracks of OSMTracker Picture-Traces with OSM Tracker

c. Mapillary The first objective was to do a Mapeatón exercise in Downtown but the sidewalks and everything was so clean, organized and inclusive that the exercise migrated to do a walking exercise using two teams. Each team will be having three different phones so one could look forward, the second could look sideways and the third one could be looking backwards. The photomapping took place in a beautiful area with churches from the 18th century and gardens surrounded of history. Check the link so you can have a look.

Mapillary tracks in downtown Toluca Picture-Photomapping con Mapillary

d. OpenStreetCam After three hours of walking, we still had a tool to use, OpenStreetCam, but this time our feet were able to relax ;) because we used taxis to do the photomapping. Again field papers were used to print a larger area of Toluca downtown and divided in four, so four teams will be doing a photomapping of the assigned area. In one hour the teams had to go back to the Geography faculty and try to get the most tracks as possible in that amount of time. Toluca before Picture-Toluca Before

Toluca after Picture-Toluca After

e. Back in the faculty after the pizza break all the tools were showed in the screen so the Geography professors could have a broad overview of all the capabilities and how their own projects or student’s project could be having the benefit of OpenStreetMap

Third day El desbaste map a collaborator that mapped the city of Lerma and is working in the same Municipality as Chief of Design and Social Policy showed the professors how a city can be managed through all the Open Data generated by OpenStreetMap. How the city of Lerma has planned the trash collection using OSM data and even how citizens with economic difficulties can apply to social benefits. El Desbaste map showing the achievements in Lerma Also, the same day Beny Carbajal presented JOSM, Beny is a GeoInformatic graduated student who has been very active in OSM since the first Open mapping day last year and has been collaborating in HOTOSM activations, she is preparing herself to be part of the team who is sharing the OSM tools around Mexico. Beny presenting JOSM Fourth day After three intensive days, the professors defined a project in the one they will be using OpenStreetmap and the tools learnt to involve students and share the knowledge they just learned. Stay tuned for a blog from Sandra Hernandez in the one she will be explaining the projects and the results they are expecting in the High Schools of the State of Mexico

[SP]

Formación de profesores de geografía en OSM

La semana pasada, algunos miembros de la comunidad OSM México tuvimos la suerte de participar en la primera Formación en OSM enfocado en profesores de geografía de Preparatorias ubicadas en municipios cercanos a la capital del estado, Toluca. Fue un evento que duró cuatro días y tuvo lugar en la Facultad de Geografía de la Universidad Autónoma del Estado de México.

Primer día.

El primer día Edgar Lemus (ealpv) dio la charla “ Democratización de Tecnologías de Información Geográfica”, el objetivo de esta charla es hacer los profesores conscientes de la importancia de geo-tecnologías de código abierto para conseguir una mayor participación de los estudiantes y dar beneficios sobre los datos obtenidos a las sociedades. La segunda parte del evento Edgar Lemus y yo participamos dando los siguientes temas para hacer una inmersión total de los profesores en el mundo OSM:

  • ¿Qué es Open Data? ¿Qué es OpenStreetMap? ¿Cuáles son los beneficios del uso de OpenStreetMap?
  • Humanitarian OpenStreetMap
  • Mapeando con ID Editor
  • Administrador de Tareas con HOTOSM

Segundo Día El segundo día estuvo dedicado a herramientas de campo. Los participantes estaban prevenidos que estaría pesado, sin embargo al final del día tendrían el conocimiento suficiente para utilizar diferentes herramientas adaptadas a proyectos futuros. Junto con los profesores se decidió dedicar una hora a la utilización de cada una de las herramientas y así aprovechar el día, posteriormente volver a la facultad a comer pizzas (¡el alimento preferido en mapatones! considerado el combustible para los mappers). Nos reunimos a las 9 am en Café con leche (sí! Fue añadida al mapa) y arrancamos el ejercicio a ls 9:20.

a. Field papers- Papeles en campo

Nos reunimos en el área de Los Portales, un área muy bien situada en el centro de Toluca. El día anterior junto con la organizadora Sandra Hernández definimos el área para poder caminar fácilmente, fue dividida en cuatro para crear equipos, ellos serían responsables de cubrir el área lo más que se pueda en una hora. Los profesores se sorprendieron mucho al ver el mapa y luego compararlo con la realidad. En promedio cada equipo añadió Entre 25-30 puntos de interés en sólo unas pocas cuadras en el centro de Toluca.

b. OSM tracker (Link Imagen del centro o Toluca) Después de utilizar Field papers, uno de los profesores preguntó “¿cómo podemos estar seguros que agregando datos de forma manual será ubicados exactamente donde deberían ser? la respuesta fue que la siguiente herramienta OSM Tracker le dará una localización lo más exacta posible. Nos mudamos a una calle peatonal para capturar los puntos de interés y las trazas, también se mostró cómo subirlos a OSM. Los profesores estaban fascinados con las herramientas y estábamos sólo la mitad del camino. Lugares como bancos, tiendas de conveniencia, restaurantes, pubs, casas de cambio, entre otros fueron añadidos al mapa de Toluca.

c. Mapillary Originalmente el objetivo era hacer primero es un Mapeatón (enlace a blog Ce) usando Mapillary pero afortunadamente las aceras del centro de la ciudad estaban limpias, organizadas e inclusivas. Por lo tanto el ejercicio fue modificado y se crearon dos equipos para hacer una caminata en el centro. Cada equipo tuvo tres teléfonos en diferentes posiciones, el primer miraría hacia el frente, el segundo miraría hacia un costado y el tercero estaría mirando hacia atrás. El fotomapping se dio a cabo en un lugar con iglesias del siglo 18 y jardines rodeados de historia. Checa el enlace para que puedas ver lo que hicimos.

d. OpenStreetCam Después de tres horas de caminata, todavía quedaba una herramienta por utilizar, OpenStreetCam, en esta ocasión nuestros pies tendrían tiempo para relajarse ;) ya que utilizaríamos taxis para hacer el fotomapping. Nuevamente se usaron field papers para determinar el área que se quería cubrir y en esta ocasión era de mayor cobertura y también fue dividida en cuatro, por lo que cuatro equipos estarían haciendo el fotomapping del área asignada. En una hora los equipos tratarían de conseguir el mayor número de trazas posibles para después reunirse nuevamente en la facultad de Geografía.

e. De vuelta en la facultad después del lunch se mostraron en la pantalla todas las herramientas para que los profesores de geografía tuvieran una visión general de todas las capacidades y cómo aplicarlas a los proyectos de sus estudiantes o a sus propios proyectos y así tener el beneficio de OpenStreetMap.

Tercer día

El Desbaste Map colaborador de OSM que llevó a cabo el mapeo de la ciudad de Lerma actualmente trabaja en el Gobierno de la misma ciudad como Jefe de Diseño de Política Social. El mostró a los profesores como se pueden aplicar políticas de gestión a través de los datos abiertos generados por OpenStreetMap, un ejemplo es cómo la ciudad de Lerma planea la recolección de basura a partir de datos de OSM y ciudadanos con dificultades económicas pueden solicitar apoyos sociales a partir de los datos.

Beny Carbajal presentó la herramienta JOSM, Beny es una estudiante recién egresada de Geoinformática, ella junto con varios estudiantes de la UAEMX han sido colaboradores muy activos en OSM desde que participamos en la 1ra Jornada de Mapeo Libre y también han estado presentes en activaciones HOTOSM, ella se está preparando para ser parte del equipo de talleristas OSM que está dando difusión a las herramientas de OSM por todo México.

Cuarto día

Después de tres días de intensa actividad, los profesores definieron un proyecto en la que van a utilizar OpenStreetmap y las herramientas aprendidas, estarán invitando a estudiantes a participar y compartir con ellos los conocimientos que acaban de aprender.

Estén pendientes del blog de Sandra Hernández en el estará explicando los proyectos de los profesores de Geografía y los resultados que esperan obtener en las Preparatorias del Estado de México.

Versión en Español del Blog creado por Martijn Van Exel 15 de Noviembre 2016

Con la ayuda de ImproveOSM, el proyecto de Telenav para analizar billones de puntos GPS para detectar Missing Roads (caminos faltantes), sentidos de una sola dirección, restricciones de vuelta, ya han visto 60,000 mosaicos de caminos faltantes, 15,000 sugerencias para caminos de un solo sentido y 2,000 restricciones de vueltas desde que el proyecto se lanzó en Septiembre 2015.

Hoy, el equipo de Telenav ha liberado una nueva versión del sitio web ImproveOSM. ImproveOSM.org es ahora basado totalmente en el conocido iD Editor de OpenStreetMap. El nuevo ImproveOSM combina los beneficios de la herramienta con la que estamos familiarizados y fácil de usar con el poder de las detecciones de ImproveOSM.

El nuevo sitio web ImproveOSM mostrando Missing Roads (caminos faltantes)

El nuevo sitio web ImproveOSM mostrando Missing Roads (caminos faltantes)

Debido a que el nuevo sitio web se basa en iD, debería parecer muy familiar y deberías de tener pocos problema para empezar con él. La principal diferencia que verás es que la versión de ImproveOSM con iD tiene un panel especial, que muestra opciones específicas, acciones e información de ImproveOSM. Si has utilizado ImproveOSM antes, estos te serán familiares. Puedes marcar elementos como solucionados o no válidos y aplicar filtros para determinar qué detecciones detecta.

No quiero entrar en demasiados detalles en este post, pero tengo un consejo que vale la pena: siguiendo a muchas solicitudes de ustedes, ahora puede seleccionar varios mosaicos de carreteras que faltan más fácilmente presionando shift y seleccionando un mosaico. Esto seleccionará automáticamente todos los mosaicos contiguos dentro de la vista actual.

Nuestro objetivo es integrar la funcionalidad de ImproveOSM con el ID Editor principal con el tiempo. Para que esto suceda, su retroalimentación es muy importante, así que no duden en reportar errores e ideas en la página GitHub del proyecto (the project GitHub page), donde el código fuente también estará disponible pronto.

Esperamos que disfrutes del nuevo sitio web de ImproveOSM y esperamos tus comentarios! Happy mapping!

Results and new initiatives after #GeoChicas #Geoladies event in Sao Paulo, Brazil

Posted by Mapanauta on 1 December 2016 in English. Last updated on 12 December 2016.

English Version (Spanish version below)

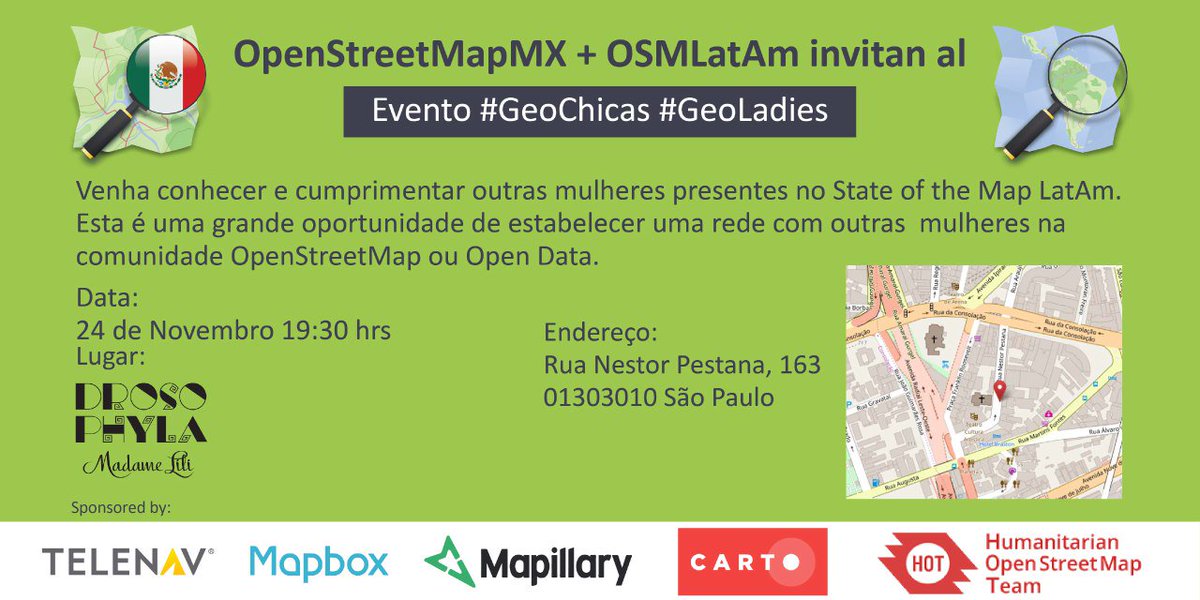
Last week on November 24th, one day before starting the 2nd State of the Map LatAm (#SOTMlatam2016) taking place in the vibrant city of Sao Paulo, a group of women interested in Open Data and Open Mapping, decided to gather and to start a discussion to make OpenStreetMap more integrate and increase the female presence. According to some statistics from VGI only 3% of all editions is made from women in the community. Having the largest data base in the world with not enough diverse groups will give not enough data and will be representing only one reality.

Geochicas event in Sao Paulo, one day before SOTM LatAm Thanks to companies engaged and interested in the community such as Mapbox, [Mapillary] (https://www.mapillary.com/) and [Telenav] (http://telenav.com/) who sponsored the First #GeoChicas event in Sao Paulo we are planning to invite more women involved in other initiatives to get to know OpenStreetMap and use it in their projects. Having examples of how different regions of the world are changing lives thanks to the presence of Open Mapping is something we will need to continue sharing to create more awareness about the benefits. In the #GeoChicas event it was discussed how we wanted to lead the future efforts and engage the people attending the Conference “The role and participation of women in the OSM community” taking place in SOTM LatAm #GeoChicas in State of the Map LatAm One of the first steps is creating a communication channel and start developing mapping projects that will benefit women in vulnerable situations, #OSMintegra will be how you can identify these projects that will be shared in different social media and formal OSM channels. #OSMintegra initiative The next important event with Open Source projects is CubaConference, in this event we will impulse to have more women giving conferences and share their projects. A permanent scholarship program is also under discussion so we can help in different events around the globe sending female presence.

This is just the beginning but we can tell you that we are already making progress in this project.

Read for more news regarding this important topic from Mapeadora, SeleneYang and more #GeoChicas.

To be continued…

///Versión en Español///

La semana pasada el día 24 de noviembre, un día antes de comenzar el 2º State of the Map LatAm (# SOTMlatam2016) que tuvo lugar en la ciudad de Sao Paulo, un grupo de mujeres interesadas en Open Data y Open Mapping decidió reunirse e iniciar un discusión para hacer OpenStreetMap más integrado y aumentar la presencia femenina. Según algunas estadísticas de VGI sólo el 3% de todas las ediciones se hace por mujeres en la comunidad OpenStreetMap. Al ser la base de datos más grande del mundo si no se cuenta con suficiente diversidad de grupos no dará suficientes datos y estará representando solamente una realidad.

Gracias a empresas comprometidas e interesadas en la comunidad como Mapbox, [Mapillary] (https://www.mapillary.com/) and [Telenav] (http://telenav.com/) que patrocinaron el primer evento #GeoChicas en Sao Paulo, estamos planeando invitar a más mujeres involucradas en otras iniciativas para conocer OpenStreetMap y usarlo en sus proyectos. Tener ejemplos de cómo las diferentes regiones del mundo están cambiando vidas gracias a la presencia de Open Mapping, esto es algo que tendremos que seguir compartiendo para crear más conciencia sobre los beneficios que genera.

En el evento #GeoChicas se discutió cómo queríamos dirigir futuros esfuerzos e involucrar a las personas que iban a asistir a la conferencia “El rol y la participación de las mujeres en la comunidad OSM” que tuvo lugar en SOTM LatAm.

Uno de los primeros pasos es crear un canal de comunicación y empezar a desarrollar proyectos de mapeo que puedan beneficiar a mujeres en situaciones vulnerables, #OSMintegra será la manera de identificar estos proyectos que serán compartidos en diferentes redes sociales y canales formales de OSM.

El próximo evento importante con proyectos Open Source es CubaConference, en este evento impulsaremos que se tenga un mayor número de mujeres dando conferencias y compartiendo sus proyectos. Un programa permanente de becas también está en discusión para que podamos ayudar a que asistan más mujeres a diferentes eventos alrededor del mundo. Esto es sólo el comienzo, pero podemos decirles que ya estamos avanzando en el proyecto.

Lean más noticias sobre este importante tema de Mapeadora, SeleneYang y muchas #GeoChicas más.

Continuará…

Location: Rincón Verde, Naucalpan de Juárez, State of Mexico, 53220, Mexico

Presentando OpenStreetView

Posted by Mapanauta on 17 August 2016 in Spanish (Español).

Post Original: Martijn Van Exel

Traducción: Mapanauta

Después de casi un año de estar pensando, desarrollando y hacer pruebas ¡el equipo de OSM de Telenav está listo para presentar OpenStreetView a todos los mappers de OSM! OpenStreetview (OSV) es la plataforma libre y abierta de imágenes a nivel de calle diseñado 100% con OSM y teniendo en mente a los mappers.

Presentamos oficialmente OSV a la comunidad OSM en State of the Map US, donde tuvimos una charla de 20 minutos y un stand donde dimos cochecitos a control remoto para todos los que se habían registrado :). Los coches se acabaron rápidamente - ¡casi la mitad de las personas de SOTM US se habían registrado! -Pero todavía puedes ver la sesión gracias a los grandes organizadores de SOTM US que hicieron grabaciones de todas las sesiones profesionalmente. Si tienes 20 minutos y no te gusta leer, ver el video va a ser la mejor manera de entender qué es OSV y cómo se puede utilizar para mejorar OSM. O si vienes a SOTM en Bruselas, puedes conocer a nuestro equipo allí (¿más cochecitos a control remoto? ¡Quién sabe!) Y puedes asistir al workshop.

booth

El stand de OpenStreetView en SOTM US_

SI prefieres leer ¡lee esto! Me gustaría introducir rápidamente OSV, qué componentes tiene y por qué creemos que es la opción #1 de imágenes a nivel de calle para OSM y por supuesto cómo contribuir y usarlo.

Componentes OpenStreetView

OSV es un sitio web, openstreetview.org, son aplicaciones móviles libres y de código abierto código abierto para Android y iOS, es un editor especializado de mapas, es un plugin para JOSM, y por supuesto es un servidor back-end. También está planeado tener apoyo para iD.

El sitio web es donde vas a explorar imágenes de todo el mundo, ver tablas de liderazgo y tu propio perfil y trayectos. Para ver tus cosas personales, tendrás que iniciar sesión. Tu cuenta OpenStreetView está vinculada a tu cuenta de OSM, por lo que no es necesario crear una cuenta separada. Todo lo que guarda cuando ingresas por primera vez es todo lo que es público en OSM. (Si desea comprobar lo que es eso, ir a https://www.openstreetmap.org/api/0.6/user/8909, cambiando 8909 con tu ID de OSM - a menos que quieras ver mis detalles).

website

Las aplicaciones se pueden descargar de forma gratuita desde la tienda play/app store. Para Android también puedes descargar el APK directamente. Son aplicaciones optimizadas para manejo pero también funcionan para andar en bicicleta y para ir caminando. Aparte de grabar trayectos, también puede subirlos OSV. Esto si lo deseas sucederá de forma automática cuando se introduce WiFi. Finalmente puedes revisar tus trayectos locales y de servidor y ver tu perfil. Incluso si no has iniciado sesión en el sitio web, puedes iniciar sesión en OSV con las aplicaciones, también a través de OSM OAuth. De cualquier manera, esto creará una cuenta para ti en OSV.

android-screenshot

Una cosa que es muy específica para OSV es que se puedes vincular la aplicación a un dispositivo de seguridad OBD2 en tu vehículo. Esos son pequeños dispositivos que leen desde el puerto OBD2 de tu coche. Casi cada coche tiene uno. (Reto: ¡encontrar el tuyo!). El aparato lee todo tipo de información de diagnóstico del coche y lo transmiten a través de Bluetooth o WiFi. Cuestan alrededor de 20 euros. Una lista de los equipos compatibles con OSV está en el Wiki de OSM. (Ehm, es una lista muy pequeña hasta el momento. Si tienes un modelo diferente, por favor ¡agrega tu experiencia!)

obd2 dongle

OSV leerá la curva de velocidad para mejorar la precisión de la señal GPS que se registra para tu trayecto. Es extremadamente útil cuando la recepción GPS es pobre o se pierde por completo, por ejemplo, en una zona densa cubierta de árboles o en túneles. La navegación estimada es proporcionada por la unidad OBD2 y mantendrá la alineación adecuada a la carretera. Aquí verás lo que significa cuando circulas a través de un túnel (azul = solamente GPS , perdió la señal, rojo = con conexión OBD2).

deadreckoning

Las aplicaciones OSV también tienen detección de señal incorporado. Así que esto no se hace en el servidor, pero a ¡60FPS en el cliente! Esto significa que detectará las señales de límite de velocidad, y más por venir, en tiempo real y puede advertirte cuando se conduce a alta velocidad. Esta función de advertencia está casi lista y estará en una de los próximas versiones. (Actualizamos las aplicaciones con mucha frecuencia.)

speedlimit

El plug-in JOSM se encuentra en una fase beta temprana. En este momento simplemente mostrará la ubicación de las imágenes en el servidor OSV, y puedes hacer clic sobre ellos para mostrar la imagen en el panel OSV. Es una funcionalidad básica, pero funciona :) y esperamos que tengas ideas (o incluso código) para mejorarlo.

josmplugin

Hablando de ideas, ya tenemos una comunidad activa reportando problemas y sugerencias en Github. Este es el mejor lugar para informarnos de cualquier bug e ideas que tenga sobre cualquier parte de OSV. Github es también el lugar donde se encuentra todo el código fuente de todos los componentes mencionados aquí. Casi todo en OSV es de código abierto y si aún no está ahí estamos viendo la forma de cómo hacerlo código abierto.

Si no te gusta Github o no quieres crear una cuenta allí, también puedes escribir a hello@openstreetview.org con tus ideas o informes de bugs. También estamos en Twitter como @openstreetview y estamos entrando a Facebook e Instagram si te gusta ese tipo de cosas.

Si checas Github, verás que también tenemos herramientas para cargas fotos existentes de tu Virb / GoPro y otras cámaras de acción. Estos son scripts en Python, pero también tenemos una herramienta de GUI en la que puedes arrastrar y soltar los directorios sobre los que deseas cargar. Esto está en fase temprana beta, pero si quieres una copia, me puedes contactar.

guiuploadtool

Hay dos componentes que no he mencionado todavía: el editor de mapas (Map Editor) y la parte del back end. Quiero dejar estos para un post aparte que voy a escribir pronto. Aquí hay una captura de pantalla del editor de mapas:

mapeditor

¿Por qué OpenStreetView?

Creemos que OpenStreetView es la opción # 1 para las imágenes a nivel de calle de OSM. No sólo porque es casi completamente de código abierto sino también porque permaneces con el control total de los datos subidos a la OSV. Siempre podrás borrar fotos individuales, viajes o incluso borrar todo y eliminar tu cuenta si en cualquier momento ya no deseas ser parte de OSV. Esta opción se encuentra en el sitio web, sin necesidad de enviar un correo electrónico a nadie ni presentar ninguna solicitud.

Otra razón es porque estamos construyendo una plataforma que está muy estrechamente integrada con OSM. Esto es obvio desde la manera en que manejamos las cuentas de usuario: iniciar sesión con OSM, no tienen que ser cuentas por separado. Pero también es más profunda por la integración con OSM es muy estrecha: mapeamos todos los trayectos a caminos de OSM, por lo que podemos vincular ida y vuelta entre viajes / imágenes y objetos de rutas OSM. Esto abre todo tipo de posibilidades interesantes, y me gustaría escribir también un post sobre esto más adelante.

Por ahora nos gustaría que le des una oportunidad a OpenStreetView. Descarga la aplicación en tu teléfono, inicia sesión y comenzar las capturas. Háblanos de tu experiencia. Explora lo que ya existe. Y lo más importante ¡por favor utilízalo para mejorar OSM!

**Versión en Español: Reconocimiento a HOTOSM por el Presidente de México en el Día del Internet 2016 — Short Link: http://bit.ly/hotosm_mx_es **

On the Internet Day, May 17 2016 the President of Mexico Enrique Peña Nieto invited fifty citizens who called Digital Leaders (#LideresDigitales) to have a dialogue on the future of technology and Internet in Mexico, I had the opportunity of being among these group of citizens. The President talked about various related topics but especially appreciated the efforts of humanitarian mapping conducted by Humanitarian OpenStreetMap in Hurricane Patricia.

 Day of Internet 2016- Dialogue with the President of Mexico

 President’s office twitter account

Why the President of México thanked the efforts from HOTSOM in Hurricane Patricia? Here you will find some details so you know what was done.

On October 23, 2015 Hurricane Patricia threatened to touch the states of Colima, Nayarit and Jalisco with winds up to 325 km/h, authorities of Mexico mentioned “It is very likely that this hurricane is the strongest ever in the Pacific side of our country, since it has records “

 Hurricane Patricia Path from NOAA

Contributors of OpenStreetMap and HOTOSM like Rodolfo Wilhelmy, Humberto Yances, Rafael Avila, Robert Banick, Andres Ortiz, and many others (sorry for not mentioning everyone) in addition to an army of over 500 mappers of Mexico and the world joined efforts to support this area of the Mexican Pacific with data that could be used for the benefit of the population that could be affected. Fortunately, the hurricane lost strength by touching the coast of Mexico causing minimal damage compared to what was expected.

Quick stats:

More than 500 contributors mapped 9,000 kms of roads (5.6k miles of road) + 72,000 buildings in 72hrs It was processed 29,608 km^2 pre-event DigitalGlobe imagery to improved coverage over priority areas. It was analyzed INEGI road data to identify missing roads and road names in OSM data. Mexico Open Data was confirmed by authorities to be used in OpenStreetMap. All these was possible thanks to the great work HOT members, companies supporting OSM project and the local community in Mexico and the World

 Contributors mapping the priority area in 72 hours Gif by Mapbox

The event took place in Los Pinos (The equivalence of the U.S. White House) at the moment the Open Data topic was mentioned, Peña Nieto said he knew someone who had supported the alert for Hurricane Patricia was among the guests so I raised my hand to start the dialogue, the President mentioned “… I just want to thank because it’s an example that illustrates very well what we can achieve and I think that you also use open information.” In my participation I could give my point of view on the need for Mexico not only upload open data to be the first in quantity of released Open Data but emphasize the need of quality Open Data in order to take better decisions based on them. Also I could mention the importance of Open Mapping and collaboration between Governments and Civil Society so more Mexicans are less harmed by disasters (find the 3 min video here).

 Fragment of video from President’s office twitter account

In Mexico the OpenStreetMap community is not as numerous as in other countries but in the last two years a group of collaborators we have joined together to promote the project and increase the local community through massive workshops in Universities and courses for Government Authorities and Civil Society. Much remains to be mapped but I believe we are on the right track.

Miriam Gonzalez

@mapanauta

This blog was originally posted in the Blog from Improve-OSM, if you want to see the complete Blog please click http://blog.improve-osm.org/en/happy-mapping-hour-presentation-import-project-inegi-mgn-national-geostatistical-reference/

Last April 6th 100% of the Mexico Telenav’s team (Andrés Ortiz 50% and Miriam Gonzalez 50% 😀 ) presented the results of Import Project INEGI National Geostatistical Framework. The meeting point was the Felina bar on the edge of Condesa and Escandon neighborhood.

Andres_presentando Andres presenting at Happy Mapping Hour Miriam_presenta Miriam presenting in Happy Mapping Hour Image by @Tlacoyodefrijol More than 20 people booked and came to the appointment. The project was originally announced in May 2015 with much skepticism because this was the first time a project of such magnitude was taking place in Mexico and the OpenStreetMap community in Mexico at that time was very disperse.

Before_import Before the Import Project there were 69 valid boundaries Image by Ruben @Mapbox Many import projects have been conducted in many parts of the world, such projects have helped (mostly) to create the map of the world that we have today and Mexico was going to be part of them. People with extensive knowledge in imports formed part of the project including Victor Ramirez, Ernesto Carreras, contributors od OpenStreetMap Puerto Rico and Rafael Avila, a HOTOSM collaborator and expert in African countries imports. At the beginning of the project we realized that there were only 69 valid administrative boundaries (although in the image it looks more than 69, these lacked the tag SOURCE which made them invalids) and the end of the Import project the team had added 2,457 administrative boundaries with tag Source = INEGI MGN 2014 v6.2

After_Import After the Import Project there were 2,457 administrative boundaries Image by Ruben @Mapbox To the #HappyMappingHour diverse OSM contributors atended such as geographers, developers, archeologists and also Armando Aguiar – INEGI IT Services Director witnessed how the Open Data Inegi released at the end of 2014 has been in benefit of OpenStreetMap. Let me share some statistics:

Quick Statistics:

Node numbers/Ways/ Deleted relations

500K / 2k / 500 Node numbers/ Ways / Added relations

1000K / ~4k / ~1050 Number of hours dedicated :

250+ NUmber of administrative boundaries added:

2,457

Now that the map has de MGN boundaries as a reference mappers as Irk_Ley have been investigating the local laws of the states of Veracruz and have been reviewing historical maps of the Map Library Manuel Orozco. These mappers will be verifying and correcting those limits which have differences with the MGN when they have the backup of the documentation of the local law.

Ancient map of the Papatla, Veracruz region Here you will find the presentation of #HappyMappingHour and if you want more technical details we suggest you check the following blogs and the wiki.

Blog-Process used to import more tha half of the municipalities in Mexico Blog-How we imported Administrative Boundaries for Mexico from INEGI Wiki- Mexico’s Administrative Divisions Import Project Here also you will find two Blogs from collaborators in the Import Project:

Blog: My experience in OSM during the MGN Import by Pablo Garcia (OSM user: Irk Ley)

Blog: Import of INEGI Mexico municipalities finished by Andres Ortiz (OSM user: Andresuco)

You can contact them directly if you have any questions or comments for them.

What are the next challenges?

Evaluate data from the National Road Network and create a joint project with Mexico OpenStreetMap community to carry out its import. It is also in the radar create a tool where information from OpenStreetMap in Mexico is a kind of “inspector” to send feedback to INEGI about possible shortcomings or errors can be corrected and improved thanks to contributors OpenStreetMap but first we need more discussions with the local community.

Note: For having complete access to the links from the technical Blogs and download the presentation click http://blog.improve-osm.org/en/happy-mapping-hour-presentation-import-project-inegi-mgn-national-geostatistical-reference/

Originalmente este Blog fue compartido en el Blog de Improve-OSM, si desean ver todos los link mencionados favor de dar clic en el link: http://blog.improve-osm.org/es/happy-mapping-hour-presentacion-proyecto-importacion-mgn-marco-geoestadistico-nacional-del-inegi/

El pasado 6 de Abril nos reunimos 100% del equipo Telenav México (Andrés Ortiz 50% y Miriam Gonzalez 50% 😀 ) para presentar los resultados del Proyecto de Importación del Marco Geoestadístico Nacional del INEGI. El punto de reunión fue el Felina bar en los límites del barrio Condesa con Escandón. Más de 20 personas reservaron y llegaron a la cita.

Andrés presenting in Happy Mapping Hour

Andrés presenting in Happy Mapping Hour

Miriam_presenta Miriam presenting in Happy Mapping Hour Image @tlacoyodefrijol

El proyecto fue anunciado originalmente en Mayo 2015 con mucho escepticismo debido a que nunca se había llevado a cabo un proyecto de tal magnitud en México y la comunidad OpenStreetMap en México aún se encontraba dispersa.

Before_import ![Antes del Proyecto de Importación existían 69 Límites administrativos Válidos] (http://blog.improve-osm.org/wp-content/uploads/2016/05/Before_import.jpg) Image by Ruben @Mapbox

Muchos proyectos de importación se han realizado en muchas partes del mundo, dichos proyectos han ayudado (en su mayoría) a crear el mapa del mundo que tenemos hoy en día y México entraba a ser parte de ellos. Personas con amplios conocimientos en importaciones formaron parte del proyecto, entre ellos Victor Ramirez, Ernesto Carreras, colaboradores de OpenStreetmap Puerto Rico y Rafael Avila, colaborador de HOTOSM y experto en importaciones en países de Africa. Al principio del proyecto nos dimos cuenta que solamente existían 69 límites administrativos válidos (aunque se vean más en las imágenes estos no contaban con SOURCE lo cual los hacía inválidos) y al finalizar la importación el equipo de importación había agregado 2,457 límites administrativos con el tag Source= INEGI MGN 2014 v6.2

After_Import ![Después de la Importación se encuentran 2,457 Límites administrativos] (http://blog.improve-osm.org/wp-content/uploads/2016/05/After_Import.jpg) Image by Ruben @Mapbox Al #HappyMappingHour asistieron diversos colaboradores de OSM como geógrafos, desarrolladores, arqueólogos y también nos acompañó Armando Aguiar- Director de Servicios de Información del INEGI y fue testigo de cómo los datos liberados por INEGI a fines de 2014 estaban siendo aprovechados por OpenStreetMap. Les comparto unas estadísticas:

Estadísticas rápidas:

Números de nodos/caminos/relaciones borradas

500K / 2k / 500 Números de nodos/caminos/relaciones agregadas

1000K / ~4k / ~1050 Número de horas dedicadas :

250+ Número de límites municipales agregados:

2,457 Ahora que ya se cuenta con los límites del MGN como referencia maperos como Irk_Ley que se han dado a la tarea de investigar las legislaciones locales del Estados de Veracruz y consultar mapas históricos de la Mapoteca Manuel Orozco se encargarán de corregir aquellos límites que tengan diferencias con los del Marco Geoestadístico siempre y cuando tengan el respaldo de la información de la ley local.

mapa general_rec01 Mapa Histórico de la Región de Papantla, Veracruz

Aquí encontrarás la presentación de #HappyMappingHour y si deseas más detalles técnicos te sugerimos checar los siguientes blogs y en el wiki.

Blog- Proceso utilizado para importar más de la mitad de las municipalidades en México Blog- Cómo importamos los límites administrativos para México Wiki- Proyecto de importación de las divisiones administrativas en México

Aquí también podrán encontrar dos Blogs de colaboradores del Proyecto de Importación:

Blog: Mi experiencia en OSM durante la Importación MGN Por Pablo García (OSM username: IRK_LEY)

Blog: Importación de municipios del INEGI finalizada por Andrés Ortíz (OSM username: Andresuco)

Pueden contactarlos directamente si tienen preguntas o comentarios para ellos.

¿Cuáles son los siguientes retos?

Evaluar los datos de la Red Nacional de Caminos y crear un proyecto en conjunto con la comunidad OpenStreetMap México para llevar a cabo su importación. También está en el radar crear una herramienta donde la información de OpenStreetMap en México sea una especie de “inspector” que mande retroalimentación al INEGI sobre posibles carencias o errores puedan ser corregidos y mejorados gracias a los colaboradores de OpenStreetMap pero antes tenemos que discutirlo más a fondo con los demás colaboradores de la comunidad.

Nota: Si desean ver los links de los Blogs mencionados y descargar la presentación favor de dar clic en http://blog.improve-osm.org/es/happy-mapping-hour-presentacion-proyecto-importacion-mgn-marco-geoestadistico-nacional-del-inegi/

Last February 26th and 27th the UAEMX and the OpenStreetMap Mexico community hosted a 2 day OpenStreetMap Conference and Workshop event in Toluca, State of Mexico. This events aims to increase the awareness of OpenStreetmap and the mapping community in the country. Another objective is to improve the base geospatial data coverage in different areas of Mexico and maintain an active mapping community that can be ready in cases of disaster responses and support other humanitarian initiatives. The attendees were students and graduated students of the University but the invitation was open to people interested in Open Data initiatives.

Day 1. Introduction to OpenStreetmap and Start Editing with ID Editor

The First day we started in the afternoon at 4pm with an audience of 87 people. An introduction of OpenStreetmap was given including how Humanitarian OpenStreetMap works and how events such as the 30th commemoration of the earthquakes of 1985 and earthquake simulation in the Zocalo of Mexico City helped to organized the mapping of the area Hurricaine Patricia could had affected last October.

After the conference a more interactive part took place in the one the participants in advance had already created a OpenStreetMap account, this was part of the requirements of take the course (thanks to previous experiences of Céline Jacquin she emphasized this task, as well as having previously installed the apps for the second day, so we avoid losing time and having connectivity issues!) Then we explained how ID Editor works and showed them the fundamental elements of OpenStreetMap. The audience was asked to go to the same area in the map and create a POI, a line and an area. After this introduction it seems everybody was confident to start mapping the world!

Mapping Toluca, State of Mexico

Day 2.

Introduction to OpenStreetmap and Start Editing with ID Editor

Why again? Very simple! the Professor Sandra Hernández mentioned on Friday most of the students will participate, but for people who already graduated college it was complicated to attend on working days so we decided to repeat the introduction and edition session on Saturday morning for those professionals interested in Continued Education.

Texto alternativo Celine Jacquin and Josue Rodriguez explaing the OpenStreetMap Tools

Alberto Chung giving some advice to new mappers Alberto Chung giving some advice to new mappers

After a lunch break of pizzas sponsored by Mapbox we continued with the second part of the day. How to map using different applications such as OSM Tracker, Vespucci, Go Map, Mapillary among others. Specifically, the application Mapillary was part of a pilot program named “MaPeaton” in the one the goal is to evaluate areas with difficult access for pedestrians, for example: sidewalks in bad conditions, no access for handicap people, etc. with the use of Mapillary the object could be georeferenced to start a database of these conditions. MaPeaton is a volunteer program in colaboration with the mexican activist sector (Liga Peatonal and groups of the Mexican Bicired).

Texto alternativo

Miriam Gonzalez doing some mapping with Smartphone Apps Miriam Gonzalez doing some mapping with Smartphone Apps

Also both days we had the support of El Desbaste map, a graduated professional from this Institution who has been working very hard on improving the map quality of Lerma and surrounding areas and educating people of the benefits of having a Base map with the quality of OpenStreetMap.

Texto alternativo

In the two days we had 151 participants and 50% of them were women so we decided to include the #Pledgeforparity hashtag to promote more women mappers in Mexico and the rest of the world.

Texto alternativo

Stay tunned for the next events in:

*UNAM- Universidad Nacional Autónoma de México

*Oaxaca, Mexico

Publicado por mvexel el 29 julio 2015 Traducido al Español por @Mapanauta

México liberó una gran cantidad de datos abiertos hace poco tiempo. Huge: Mexico’s statistical institute INEGI goes open data @INEGI_INFORMA (via @rodowi — Alex Barth (@lxbarth)

Mucha de esta información es geoespacial, por eso digo ¡yummie! Alex Barth escribió acerca de estos datos que vienen del Instituto Nacional de Geografía y Estadística (INEGI) en su diario poco tiempo después de la liberación con un excelente mapa para mostrar que tan rica es la información:

(Mis habilidades mediocres para animaciones GIF realmente no le hacen justicia – chequen la publicación del Blog de Alex para ver el mapa interactivo).

Ahora la pregunta es: ¿Cómo obtenemos una parte (o todo?) de estos datos en OSM? Esto no está claro –OSM ya cuenta con datos valiosos en muchos lugares en México que definitivamente queremos mantener. Aquí en el equipo OSM de Telenav obtuvimos la respuesta a esta pregunta. Le llamamos Cygnus - El portador del Equilibrio. Déjenme explicar con algunos visuales lo que hace Cygnus. Consideren esta área en la región de Aguascalientes. Existe actualmente información de OSM ahí:

Si vemos las imágenes aéreas de Bing, podemos ver que hay una población completa que ¡aún no ha sido mapeada!

Pero INEGI tiene la mayoría o si no todos las calles en esta población en su conjunto de datos ahora abierto llamado Conjunto de Datos Vectoriales de Carreteras y Vialidades Urbanas .

Después de convertir los atributos originales de los datos al etiquetado correcto de OSM, guardar los resultados a un archivo OSM y cargarlo en JOSM se ve de la siguiente forma:

OK, eso está bien pero aún tenemos dos diferentes capas que están desconectadas e incluso si se fusionan tenemos que resolver manualmente caminos duplicados y conecciones entre los caminos de OSM y aquellos provenientes de los datos de INEGI.

Aquí es donde Cygnus entra- desarrollamos en Telenav una nueva tecnología de fusión específicamente para afrontar esto.

Gygnus, como el Portador de Equilibrio, toma los que se ingresó como base en archivo OSM en formato PBF, así como lo que llamamos archivo ‘mejorado’, también en formato PBF. Después los compara y fusiona los dos ingresos (inputs) y da como resultado un archivo JOSM XML que puede ser fusionado con la base de datos OSM de manera inmediata. Estos detalles muestran las capas combinadas con todos los caminos ‘importados’ del INEGI antes de los caminos pre-existentes de OSM

Aunque Cygnus hace un trabajo impresionante de fusionar datos OSM con la capa ‘mejorada’, aún tienes que checar el resultado antes de hacer subir la información. Checa el ejemplo aquí:

La ‘highway=secondary’ ya estaba pre-existente a los datos OSM y la ‘highway=residential’ ; ‘oneway=yes’ vino de los datos de INEGI, está claro por las imágenes de Bing que hay dos caminos que deben estar conectados y todavía no lo están. Cygnus tiene un umbral de distancia (modificable) que utiliza cuando decide si dos caminos deben de estar conectados o no. En este caso, el camino de INEGI estaba muy lejos por ello permaneció desconectado.

Hay otras cosas por considerar cuando trabajas con archivos de cambio producidas por Cygnus:

  • Cygnus nunca va a degradar datos existentes de OSM
  • Cuando ambos OSM y la capa mejorada tienen el mismo camino, Cygnus va a mantener siempre la geometría original OSM pero opcionalmente va a importar ‘name’ y otras etiquetas útiles.

Estamos trabajando en un plan de importación para los datos del INEGI que harán uso intenso de esta tecnología ¡Más acerca de esto muy pronto! Mientras tanto checa nuestra charla en SOTM US con respecto a los datos de INEGI y OSM en México.

Publicado por mvexel el 29 julio 2015 Traducido al Español por Mapanauta

México liberó una gran cantidad de datos abiertos hace poco tiempo. Huge: Mexico’s statistical institute INEGI goes open data @INEGI_INFORMA (via @rodowi — Alex Barth (@lxbarth)

Mucha de esta información es geoespacial, por eso digo ¡yummie! Alex Barth escribió acerca de estos datos que vienen del Instituto Nacional de Geografía y Estadística (INEGI) en su diario poco tiempo después de la liberación con un excelente mapa para mostrar que tan rica es la información:

(Mis habilidades mediocres para animaciones GIF realmente no le hacen justicia – chequen la publicación del Blog de Alex para ver el mapa interactivo).

Ahora la pregunta es: ¿Cómo obtenemos una parte (o todo?) de estos datos en OSM? Esto no está claro –OSM ya cuenta con datos valiosos en muchos lugares en México que definitivamente queremos mantener. Aquí en el equipo OSM de Telenav obtuvimos la respuesta a esta pregunta. Le llamamos Cygnus - El portador del Equilibrio. Déjenme explicar con algunos visuales lo que hace Cygnus. Consideren esta área en la región de Aguascalientes. Existe actualmente información de OSM ahí:

Si vemos las imágenes aéreas de Bing, podemos ver que hay una población completa que ¡aún no ha sido mapeada!

Pero INEGI tiene la mayoría o si no todos las calles en esta población en su conjunto de datos ahora abierto llamado Conjunto de Datos Vectoriales de Carreteras y Vialidades Urbanas .

Después de convertir los atributos originales de los datos al etiquetado correcto de OSM, guardar los resultados a un archivo OSM y cargarlo en JOSM se ve de la siguiente forma:

OK, eso está bien pero aún tenemos dos diferentes capas que están desconectadas e incluso si se fusionan tenemos que resolver manualmente caminos duplicados y conecciones entre los caminos de OSM y aquellos provenientes de los datos de INEGI.

Aquí es donde Cygnus entra- desarrollamos en Telenav una nueva tecnología de fusión específicamente para afrontar esto.

Gygnus, como el Portador de Equilibrio, toma los que se ingresó como base en archivo OSM en formato PBF, así como lo que llamamos archivo ‘mejorado’, también en formato PBF. Después los compara y fusiona los dos ingresos (inputs) y da como resultado un archivo JOSM XML que puede ser fusionado con la base de datos OSM de manera inmediata. Estos detalles muestran las capas combinadas con todos los caminos ‘importados’ del INEGI antes de los caminos pre-existentes de OSM

Aunque Cygnus hace un trabajo impresionante de fusionar datos OSM con la capa ‘mejorada’, aún tienes que checar el resultado antes de hacer subir la información. Checa el ejemplo aquí:

La ‘highway=secondary’ ya estaba pre-existente a los datos OSM y la ‘highway=residential’ ; ‘oneway=yes’ vino de los datos de INEGI, está claro por las imágenes de Bing que hay dos caminos que deben estar conectados y todavía no lo están. Cygnus tiene un umbral de distancia (modificable) que utiliza cuando decide si dos caminos deben de estar conectados o no. En este caso, el camino de INEGI estaba muy lejos por ello permaneció desconectado.

Hay otras cosas por considerar cuando trabajas con archivos de cambio producidas por Cygnus:

  • Cygnus nunca va a degradar datos existentes de OSM
  • Cuando ambos OSM y la capa mejorada tienen el mismo camino, Cygnus va a mantener siempre la geometría original OSM pero opcionalmente va a importar ‘name’ y otras etiquetas útiles.

Estamos trabajando en un plan de importación para los datos del INEGI que harán uso intenso de esta tecnología ¡Más acerca de esto muy pronto! Mientras tanto checa nuestra charla en SOTM US con respecto a los datos de INEGI y OSM en México.