Today I did mapping in Baucau. I added some new roads and buildings that are not in OpenStreetMap. I am happy to be able to help the community get a better map.
Users' Diaries
Recent diary entries
Hello,
Below I have compiled recent news related to the OSM Foundation (OSMF) board’s work. Most of these are or are going to be publicly documented on the OSMF website, so if you follow the Atom feed for the board meetings’ page, you can skip this.
What this diary entry is
It contains my personal selection and recollection of recent OSMF board-related updates.
What this diary entry is not
It is not intended to include details or all OSMF board-related updates. For these, you can refer to the published board minutes. This entry has not been reviewed by the OSMF board.
Why?
Informing the OSMF members is important. The board minutes describe in detail what was discussed in public board meetings, but many people don’t have time or follow the Atom feed for the OSMF’s website recent changes. At some point, I was creating annual or more frequent updates for the whole Foundation, which was a lot of work during a short period, while other tasks were ongoing.
I’m posting this experimentally, and I’m going to see whether I can continue to do so semi-regularly.
2026 OSMF budget
The 2026 budget of the OSM Foundation is now published. You can find previous budgets here. Please note that the board may revise the budget throughout the year.
April 2026 OSMF board updates
The board had a meeting on Thursday, 30 April 2026.
You can read the Secretary’s report by Dani Waltersdorfer and the Treasurer’s report by Roland Olbricht.
OSMF’s move to the EU
Craig Allan (Chair) committed to informing the community about the status of the OSMF’s move to the EU, after a comment by Simon Poole (former OSMF and LWG chair) during the April board meeting.
OSM Local Chapters and regional communities
OSM US Inc: The OSM US and OSMF Boards had a closed, introductory meeting on 2026-04-09. The OSMF board, after a comment by imagico (guest) during the April board meeting, said that it is open to meeting with other OSM Local Chapters, if they are interested.

在画地图时,我们往往离不开一个很重要的地标——祠堂。我先假设各位朋友们都明白祠堂对于一个村庄或一个镇街,在地理上与历史文化上的重要意义,因此就跳过解释(如果你需要了解它,这里是维基百科的链接)。总而言之,它的重要程度足以在OSM上拥有一个标记。不过,寻找一个适合它的tag,却成为了一个难题。
参考现有的例子
我先参考了OSM上,中港台三地现有的祠堂,以及它们的tag。
amenity=place_of_worship
例子有:宗祠 Ancestral Hall、劉氏家祠 Lau’s Ancestral Hall、五福堂 Ancestral Hall、宗祠、朱厝宗祠、鄭氏祠堂、祠堂、祠。
landuse=religious
例子有:扬氏宗祠、隴西堂(彭氏祠堂)、余氏宗祠、邱氏宗祠-明德堂、谢氏大宗祠。
religion=chinese_folk
例子有:劉氏家祠 Lau’s Ancestral Hall、宗祠、余氏宗祠、扬氏宗祠。
amenity=community_centre
结论
从我收集到的例子来看,OSM上对祠堂的标注,多数为amenity=place_of_worship以及landuse=religious,而部分祠堂会附带religion=chinese_folk的key。这些标注初看是挺合适的,但是仔细揣摩,我发觉这并不完全准确。
这些标注更适合宗教场所。而祠堂,在文化意义上是供奉和祭祀祖先的场所,而祖先崇拜并非为一种宗教。至于religion=chinese_folk,它通常指的是中国民间信仰。虽然有些民间信仰会与祖先崇拜混合,有些祠堂会举行民间信仰的崇拜活动,但这并不代表着所有祠堂内举行的活动都有带有民间宗教信仰的成分。
有部分祠堂的标注为amenity=community_centre,这其实也反应了祠堂的另一些功能:宗族成员的聚集活动场所,比如节庆宴饮、婚丧寿喜,等等。
祠堂在OSM上难以寻找到一个合适的tag,其实就体现了一种文化上的差异——OSM来自英国,大部分OSM贡献者也来自欧美地区。它的tag和key的设置,就是默认以欧美地区的文化为基础的。而对于中港台等东亚文化地区的地图绘制,那些普适性的,比如交通设施、商业建筑、住宅、学校、公园等等,往往没有什么问题。但是当我们要标注东亚文化圈内特有的文化现象——比如祠堂——问题就出现了。
我会希望我们能够自定义一个tag,比如amenity=ancestral_hall之类的,这样的标注,会比使用多个模棱两可的标注,准确得多。
现有的解决办法:building=shrine?
我翻查了OSM Wiki,找到了building=shrine这一个tag。根据OSM Wiki对它的定义,这似乎就是目前为止最适合祠堂的tag了。
说在最后
我没有想到,对于祠堂的tag的探寻,会成为一个跨文化语境下的迷你研究。此外,我在OSM Wiki上,有找到对于牌坊的标注,感觉很有意思:
man_made=ceremonial_gate
ceremonial_gate=paifang
牌坊能够拥有一个专属的标签,祠堂,是否也能拥有呢?
Posted by Shailendrao on 3 May 2026 in English.
Last updated on 4 May 2026.

TomTom Mapping Project Progress
🖋 Project Status: Active (Working on TomTom Map Tasks)
🏆 Achievements:
🧭 Completed approx 60%
💪 Strong position on the Leaderboard
🔐 Key Focus Areas:
🗺 Map Editing
📋 Note Resolution
✅️ Data Accuracy
🎬 Future Action Items:
🤝 Join the next OSM Virtual Meetup via laptop for better participation.
👥 Discuss technical hurdles and mapping issues with the community.
前言
这些随想是在去年年底写的,也许对其他 mapper 有启发,故发布。
以下经验会让画 osm 变得高效、美观、简洁,避免无线细化。
正文
-
osm 本质是抽象、简化的地图,所以画面元素要少、整洁。增加过多的元素会导致地图画面杂乱无章、不美观,而且后期维护也很繁琐。
例:一条公路的两旁有人行道,除非有物理隔离(比如栏杆),否则推荐在道路上加
sidewalk=both,而不是把两旁的人行道都画出来 -
要提炼出对象特征,想出表达完整又简练的画面布局,同时不要出现渲染错误。
-
直线要直、圆形要园、方形要方、弧线要优雅大气。
-
线条不宜有过多节点,尽量把多余的、又不影响整体的节点删掉
-
道路、河流、森林等图画,宜大不宜小,宜长不宜短,宜整不宜碎
-
能不重叠就不重叠。如果一片区域(比如小区、医院、学校等),有明确的边界(比如围墙),最好先画完内部道路、建筑设施,最后再画上土地利用
area=yes。否则就不要画。 -
一般使用 iD 编辑器最简单。若想画整齐的方形建筑物建议用 JOSM,并使用 building 插件。
-
标签方面,非必要不多加。
前言
这些随想是在去年年底写的,也许对其他 mapper 有启发,故发布。
慎画密集的住宅区
卫星地图上密集的住宅区(不规则的房子、看不清的小巷),除非亲自走访、亲自记录,否则最好不要画
不要无限细化
刚画 osm 时,很容易被卫星地图里的各形各色的东西吸引注意力,导致无限细化,也就是说在一小片地方死抠细节。
若画小范围的地方(比如学校、公园等),无限细化无所谓。但画大范围的地图还无限细化的话,这得画到猴年马月?而且还会打消画 osm 的兴趣。
所以画大范围的地图,在保证效率的同时,还要表达准确。这件事不容易完成。
画 osm 的难点在于:怎么把卫星图像上的东西,提炼成精准、简洁的符号。
请参考 osm 极简画法
Posted by adigis on 2 May 2026 in Indonesian (Bahasa Indonesia).

Kontribusi Perempuan dalam Pemetaan Dunia
Keberadaan perempuan di dunia kartografi dan pemetaan saat ini semakin terlihat dan jumlahnya terus bertambah. Kontribusi mereka memberikan nilai yang sangat berharga bagi perkembangan data geospasial. Meski demikian, dalam dunia pemetaan sukarela seperti OpenStreetMap (OSM), jumlah pemeta perempuan masih lebih sedikit dibandingkan laki-laki. Padahal, peran pemeta perempuan sangat krusial untuk meningkatkan inklusivitas data, terutama dalam melengkapi informasi fasilitas publik yang spesifik bagi perempuan, seperti ruang laktasi dan toilet umum.
Dasar-Dasar Pemetaan di OpenStreetMap Sebelum mulai berkontribusi, ada beberapa konsep dasar yang perlu dipahami agar data yang dihasilkan akurat dan bermanfaat:
Konsep Objek di OSM:
- Titik (Nodes): Menandai lokasi spesifik.
- Garis (Ways): Untuk objek seperti jalan atau sungai.
- Area (Poligon): Untuk batas bangunan, taman, atau wilayah.
- Relasi (Relations): Untuk menghubungkan objek-objek yang kompleks.
Sistem Tagging (Atribut Data): Pemberian label informasi pada setiap objek.
Sumber Data yang Legal:
- Citra Satelit yang diizinkan.
- Survei Lapangan langsung.
- Data Pemerintah yang bersifat terbuka.
Alat Pemetaan (Editor):
- A list item with additional text
- iD Editor (Berbasis web, ramah pemula).
- JOSM (Untuk penyuntingan tingkat lanjut).
- StreetComplete (Aplikasi seluler untuk pemetaan praktis).
Hal Penting Sebelum Melakukan Digitasi Kemampuan membedakan objek seperti jalan, bangunan, badan air, dan vegetasi adalah inti dari interpretasi citra. Tanpa kemampuan identifikasi yang tepat, data hasil digitasi tidak akan memiliki nilai informasi yang benar. Terakhir, diperlukan kerelaan hati dalam memetakan. Tujuan utama OpenStreetMap adalah menciptakan basis data peta dunia yang gratis, terbuka, dan kolaboratif. Ingatlah bahwa kontribusi ini bersifat sukarela tanpa imbalan materi, namun sangat berdampak besar bagi kemanusiaan dan akses informasi dunia.
Arbuckle is a small community of about 3500 people in southern Colusa County. My husband and I stop through there a few times a year as we head north. It has gas stations and a fantastic Mexican restaurant on 5th street.
So it seemed like a good place to focus on mapping. I have about 100 homes left on the north west corner of the community. I started the project in January on business trip to Chico.
Posted by adigis on 2 May 2026 in Indonesian (Bahasa Indonesia).
Ungkapan bahwa kehidupan itu “kadang naik kadang turun, kadang kaya kadang miskin” adalah metafora roda kehidupan yang terus berputar. Ini menggambarkan fluktuasi nasib manusia yang tidak abadi, di mana seseorang tidak selamanya berada di atas (sukses/bahagia) atau di bawah (terpuruk/kesusahan). 1. Filosofi Roda BerputarKetidakabadian: Situasi saat ini, baik itu kejayaan maupun kesulitan, adalah sementara.Ujian Kehidupan: Kaya dan miskin adalah bentuk ujian untuk melihat siapa yang bersyukur dan bersabar.Perubahan Nasib: Seseorang yang hari ini kaya bisa saja jatuh miskin, dan sebaliknya, yang miskin bisa menjadi kaya.
-
Sikap Saat di “Atas” (Kaya/Sukses)Tidak Sombong: Jangan merasa angkuh atau lupa diri karena posisi bisa berubah kapan saja.Berbagi & Bersyukur: Kekayaan adalah kesempatan untuk berderma dan membantu sesama.Tetap Membumi: Sadar bahwa semua hanyalah titipan.
-
Sikap Saat di “Bawah” (Miskin/Terpuruk)Bersabar & Tegar: Tidak putus asa karena kesulitan adalah bagian dari proses pendewasaan diri.Berusaha & Berdoa: Tetap berjuang karena roda akan berputar kembali.Fokus pada Solusi: Orang dengan mental tangguh akan mencari peluang, bukan meratapi keadaan.
-
Hikmah di Balik Perputaran Keseimbangan: Adanya kaya dan miskin diciptakan agar roda kehidupan berputar dan manusia saling membutuhkan.Pembelajaran: Pengalaman di titik terendah seringkali melahirkan ketangguhan dan kerendahan hati.Ketenangan Hati: Memahami bahwa “semua akan berlalu” membuat seseorang lebih tenang menghadapi penderitaan.
Secara ringkas, kunci menghadapi roda kehidupan yang berputar adalah bersyukur saat berada di atas, dan bersabar saat berada di bawah.
Posted by Kamil Kalata on 1 May 2026 in English.

While browsing Taginfo I got curious how many elements have at least one key described on the Wiki and how big share of all keys the described ones make up. Therefore, I decided to check it out.
The analysis consisted of the following parts:
- fetching OSM database dump from planet.osm.org;
- fetching key statistics from Taginfo with the API;
- extracting “is in Wiki” info into separate file;
- altering “is in Wiki” info for keys which were described on the Wiki after the database was dumped. The alteration was based on the recent changes registry;
- processing the dump with DuckDB:
- extracting element type, its ID, and its tags to new table:
CREATE TABLE elements AS SELECT kind, id, tags FROM ST_READOSM('planet-latest.osm.pbf');; - exploding keys to separate records:
CREATE TABLE elements_keys AS SELECT kind, id, UNNEST(map_keys(tags)) FROM elements;;
- extracting element type, its ID, and its tags to new table:
- querying the database.
These are queries I provided to DuckDB:
| Result | Query |
|---|---|
| number of all elements | SELECT COUNT(*) FROM elements; |
| number of tagged elements | SELECT COUNT(*) FROM elements WHERE tags IS NOT NULL; |
| number of elements with key(s) described on the Wiki | SELECT COUNT(*) FROM (SELECT DISTINCT kind, id FROM elements_keys WHERE "key" IN (SELECT "key" FROM 'keys_wiki.csv' WHERE in_wiki)); |
| number of all keys | SELECT COUNT(*) FROM (SELECT DISTINCT "key" FROM elements_keys); |
| number of keys described on the Wiki | SELECT COUNT(*) from (SELECT DISTINCT "key" FROM elements_keys WHERE "key" IN (SELECT "key" FROM 'keys_wiki.csv' WHERE in_wiki)); |
I got the following results:
Posted by PikaMap on 30 April 2026 in French (Français).

Dans OpenStreetMap, il arrive souvent que des amphithéâtres soient mal tagués comme des universités. Cela crée des incohérences dans les données et peut fausser les usages (cartes de campus, analyses, routage interne, etc.).
Pour les trouver on peut utiliser la requête OverPass ci-dessous :
[out:json][timeout:25];

area["name"="Toulouse"]["boundary"="administrative"]->.a;

(
  node["amenity"="university"]["name"~"Amphi|amphi|Amphithéâtre|amphithéatre"](area.a);
  way["amenity"="university"]["name"~"Amphi|amphi|Amphithéâtre|amphithéatre"](area.a);
  relation["amenity"="university"]["name"~"Amphi|amphi|Amphithéâtre|amphithéatre"](area.a);
);

out body;
>;
out skel qt;
Liebe Community,
hiermit würde ich Sie gerne darüber informieren, dass wir in Zukunft versuchen Bremerhaven und die Umgebung besser zu kartieren. Gleichzeitig dient dieser Post somit der offiziellen Ankündigung.
Wir sind bemüht jegliche Änderung/Verbesserung so gut wie möglich darzustellen, damit dieser der Realität entsprechen.
Vielen Dank

Teaser/screenshot from UrbanEye3D development version. Sport grounds with markings.
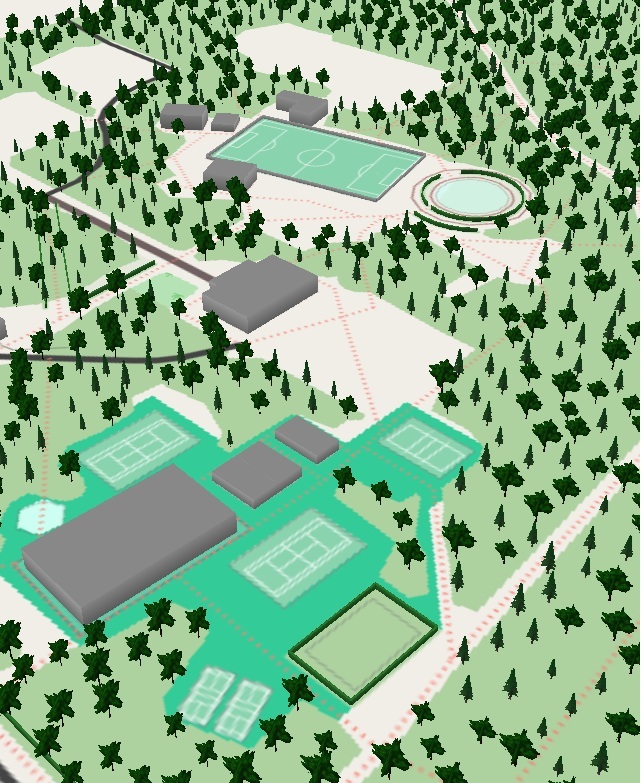
Can you identify the sports? ;)
Resolution could be higher, of course.
Posted by Raquel Dezidério Souto on 29 April 2026 in Portuguese (Português).
A empresa IVIDES DATA® está com inscrições abertas para o seu ciclo de oficinas OpenStreetMap 2026
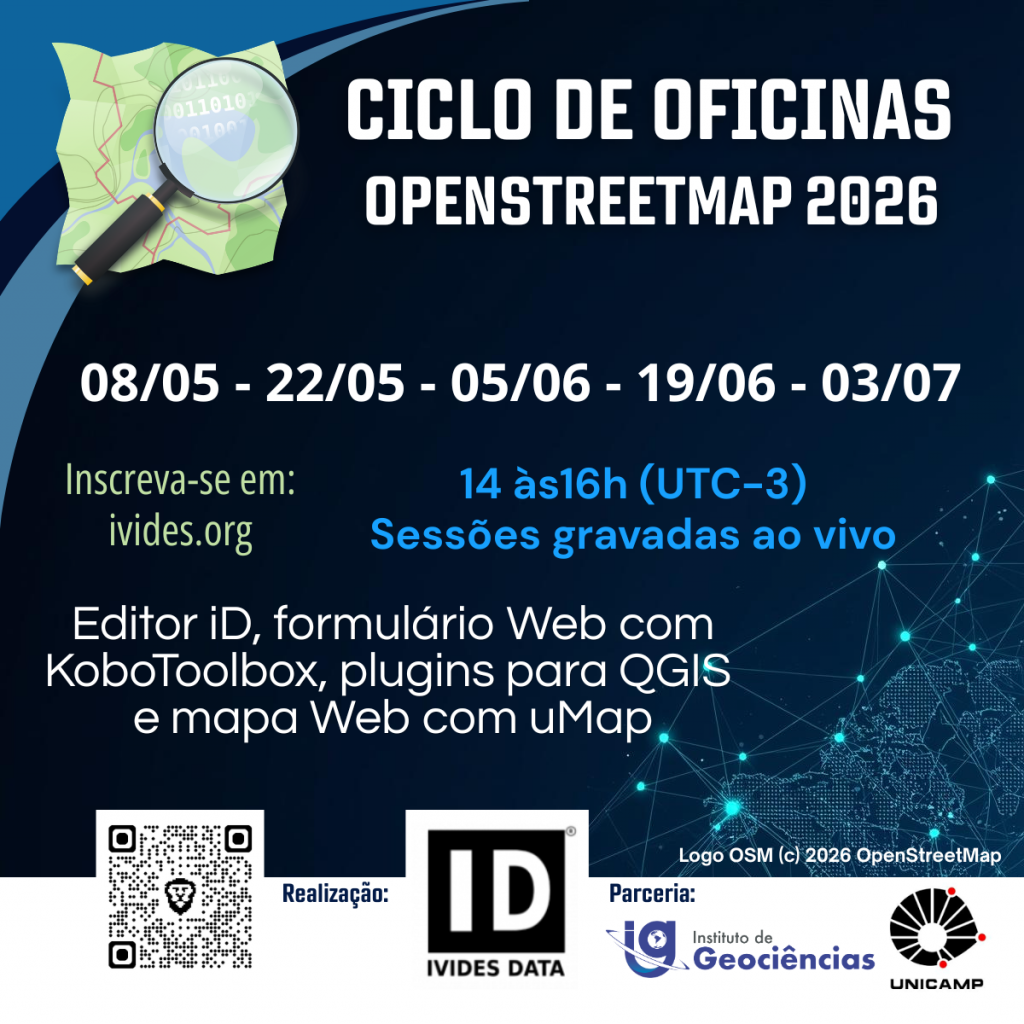
100% ON-LINE. Haverá 5 encontros de 15 em 15 dias - 08/05, 22/05, 05/06, 19/06 e 03/07 (sextas-feiras), 14 às 16h (UTC-3), contemplando diferentes temas:
* Mapeamento com OpenStreetMap
* Plugins para QGIS
* Formulários Web com KoboToolbox
* Mapas Web com uMap
Nível: para mapeadores de todos os níveis.
Perfil da professora:
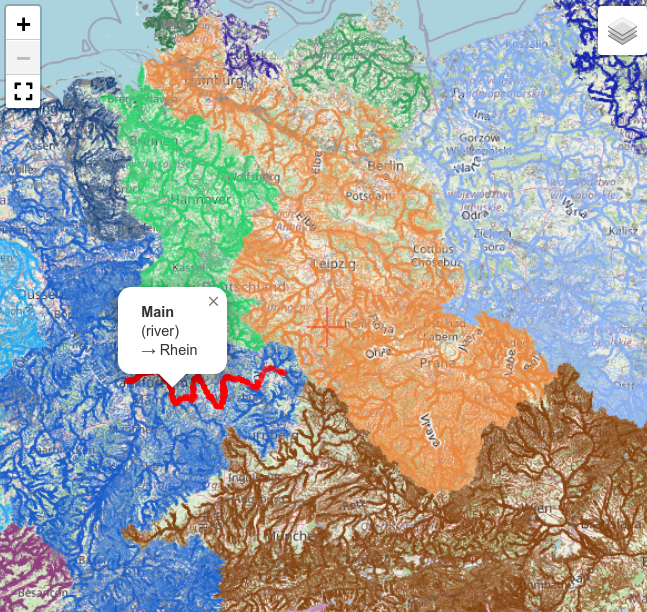
Die Karte der Flussgebiete Mitteleuropas erstelle ich nunmehr seit 13 Jahren aus OpenStreetMap Daten. In dieser Zeit gab es viele kleinere und größere Verbesserungen an der Software und an der Datenbasis. Geblieben ist das Grundprinzip: Der Algorithmus traversiert Wasser-ways und verbindet sie anhand gemeinsamer nodes zu Flussgebieten. Ein Renderer erstellt daraus eine Karte mit entsprechend dem Flussgebiet eingefärbten Wasserwegen (Details).
Das fortgeschrittene Tagging von Wasserweg-relations mit type=waterway erlaubte die Implementierung eines oft gewünschten Features: Ein Klick auf ein Element hebt den kompletten Wasserlauf von der Quelle bis zur Mündung hervor und zeigt Informationen zum Wasserweg an (siehe Bild).
Vielen Dank an alle, die durch Hinweise, Verbesserungsvorschläge und insbesondere die Pflege der Daten in OSM an diesem Projekt mitgearbeitet haben!
Posted by Bayu Nabiil on 29 April 2026 in Indonesian (Bahasa Indonesia).
.JPG)
Kontribusi Wanita dalam Pemetaan Terbuka Level Street View
Peran wanita dalam dunia professional selama ini sering kali dianggap remeh oleh beberapa orang. Hal ini dikarenakan oleh adanya stigma bahwa wanita baiknya menjadi ibu rumah tangga mengurus anak dan permasalahan rumah tangga. Sebaliknya tugas pria adalah mencari nafkah dan pundi-pundi uang untuk keberlanjutan keluarga. Namun, di zaman modern ini pandangan seperti itu sudah dianggap kuno dan kurang relevan semenjak banyaknya teknologi yang telah dikembangkan untuk mempermudah wanita dalam beraktivitas seperti pria. Apalagi sudah banyak perkerjaan yang hanya bisa dikerjakan oleh wanita.
Dalam dunia survey lapangan, pandangan orang pada saat ini pun masih berkutat bahwa ini adalah pekerjaan yang berat dan lebih cocok dikerjakan oleh pria dibanding wanita. Tetapi Pandangan seperti itu pun sepertinya sudah banyak terbantahkan oleh beberapa wanita yang ikut banyak terjun ke dunia survey dan hasil kinerja mereka sangat baik tidak kalah dari kinerja yang dilakukan oleh pria.
Posted by Emi Sunarto on 29 April 2026 in Indonesian (Bahasa Indonesia).
Seperti yang kita ketahui, perempuan sering menjadi sasaran tindak kejahatan, baik dari orang di sekitar maupun dari orang yang tidak dikenal, terutama di ruang publik. Kondisi ini menyebabkan perempuan sering merasa tidak aman saat berada di jalan, menggunakan transportasi, maupun di tempat umum lainnya, baik pada siang maupun malam hari. Terjadinya aksi kejahatan itu, dipicu oleh kurangnya imformasi mengenai wilayah yang aman, dan wilayah yang tidak aman, minimnya penerangan jalan, serta kurangnya pengawasan di beberapa lokasi semakin meningkatkan risiko yang dihadapi perempuan. Oleh karena itu, diperlukan upaya yang terarah melalui peningkatan keamanan, penyediaan informasi yang akurat, serta pemanfaatan pemetaan digital menggunakan OpenStreetMap, kegiatan ini meliputi identifikasi area yang aman, dan area yang beresiko akan munculnya tindak kejahatan.
I often need to create a single GPX file from multiple related but different GPX files from Garmin and Wikiloc. My use case is finding route recommendations for running based on GPX files. I try to get a single GPX file so I do not have to juggle multiple files during the run. Original GPX files are also noisy, so the added advantage is having a precise path to navigate instead of dealing with GPX noise.
I start by putting all downloaded GPX files into a single directory and plotting them on the map. This step allows me to see them in relation to each other and spot any outliers early. I then simplify each GPX file to reduce the number of points and match them to OSM ways. I filter the points to make them evenly spaced. Finally, I use the OSRM trip service to create a single combined GPX file, or fall back to the minimal number of split files if they cannot be merged into a single file. I plot the resulting GPX files and simplify them to reduce the point count. Now I can sync them to Garmin and use them as a kind of basemap on a device that does not support basemaps.
Of course, this only works when I know the area in advance, can find enough existing route recommendations, and there is a reasonably complete OSM map. The current pipeline is error-prone and I find myself tweaking it to make it work with any specific set of GPX files. You can try it yourself and view the complete code on GitHub: https://github.com/evgeniyarbatov/gpx-courses
Why doesn’t MapsMe keep up with OSM? Doesn’t he care about updating the map to match OSM? All programs update the map and keep pace with OSM Why MapsMe?