OpenStreetMap logo OpenStreetMap

Users' Diaries

Recent diary entries

English


Motivação e escopo


Screenshot do uMap Link para o uMap

Proposta de um fluxo de trabalho para incluir pontos de interesse (POI) no OpenStreetMap (OSM), a partir de um arquivo de valores separados por vírgulas (.csv) e gerar um mapa web dinâmico.

É importante ressaltar que este procedimento pode ser realizado por mapeadores iniciantes e que é mais adequado ao mapeamento de (relativamente) poucos dados, por exemplo, escolas, postos de saúde, sirenes de emergência etc, circunscritos a uma área que poderia ser, por exemplo, carregadas no iD ou no JOSM.

Para importar maior volume de dados no OSM, é necessário ser um mapeador experiente (nível intermediário ou avançado), documentar o procedimento na Wiki OSM e obter o aval da comunidade. Esse caso não é foco deste tutorial.

Materiais


Para esta atividade, serão necessários:

  • Arquivo de dados em .csv (ver os arquivos de exemplo, após esta lista);
  • Gerenciador de planilhas eletrônicas, algumas sugestões são: OpenOffice Calc, LibreOffice Calc ou Gnumeric;
  • Sistema de informações geográficas QGIS com plugin MMQGIS instalado e ativo;
  • Navegador de Internet com permissão para JavaScript;
  • Editor iD, editor default do OSM;
  • uMap;

Arquivos de exemplo — Para realização desta prática, são disponibilizados dois arquivos .csv, com a geolocalização de sirenes de emergência instaladas na cidade de Maricá (Rio de Janeiro, Brasil) — as estações de alerta e alarme hidrológicos - EAAH e estações de alerta e alarme geológicos - EAAG). Os dados deste exemplo são de domínio público e foram doados pela Secretaria de Defesa Civil do Município de Maricá. É necessário sempre conhecer a licença dos dados originais, a fim de verificar a sua compatibilidade com a licença ODbL do OSM.

Fluxo de trabalho


A - Obter os dados e preparar o arquivo inicial


Obter os dados de fontes oficiais, via download em portais institucionais ou por comunicação pessoal com a administração pública. Verifique se a licença dos dados é compatível com a licença ODbL, conforme explicado acima.

Abrir o arquivo .csv no gerenciador de planilhas eletrônicas e preparar o arquivo, seguindo as recomendações abaixo, antes de iniciar o geoprocessamento:

  • O ideal é que o arquivo .csv inclua os campos de latitude e longitude, porém, caso o aquivo ainda não os inclua, deve conter os endereços ou qualquer geocódigo livre, para que seja possível a geolocalização dos objetos de interesse (no caso do exemplo, as coordenadas geográficas das sirenes de emergência).

Observação: preparação do arquivo .csv, somente no caso de não incluir as coordenadas. Caso o seu arquivo as tenha, passe ao ponto seguinte. Realizar a geocodificação dos endereços com o plugin MMQGIS, após incluir o arquivo .csv como uma camada vetorial no QGIS; ou utilize outros meios para geocodificação, a fim de gerar os dois campos de valores de coordenadas - latitude e longitude. Por vezes, o geocodificador não encontra alguns endereços, mas é disponibilizado um arquivo, que pode ser utilizado para procurar as coordenadas e inseri-las manualmente no mesmo .csv.

  • Para que as coordenadas sejam lidas pelo plugin MMQGIS, é necessário que o separador de decimais das coordenadas seja o ponto (“.”) e não, a vírgula (“,”). Realize o ajuste no arquivo, caso necessário. Por exemplo: de -23,102378 muda para -23.102378.

  • Verifique a acentuação das palavras e qualquer outro aspecto importante para que os dados estejam o mais correto possível. Caso, ao abrir o arquivo, não tenham sido reconhecidos os acentos e outros caracteres especiais, verifique se ele está em UTF-8 ou ISO-8859-1, que são os charsets utilizados no Brasil (sendo o leitor de outro país, verifique o charset adequado à sua região). Isto é verificado no próprio gerenciador de planilhas.

  • O arquivo também deve conter um campo “id”, que será utilizado na geração dos pontos, conforme descrito na etapa B, a seguir. Caso ainda não haja um campo identificador, incluir mais uma coluna e a nomear desta forma (id). Atribuir valores inteiros ( 1, 2, 3 …) e preencher todas as linhas que contêm dados.

B - Gerar os pontos


Até o momento, os registros estão apenas com os atributos de coordenadas geográficas (latitude, longitude), mas ainda necessitam ser transformados em pontos (objetos espaciais). Esta etapa é realizada assim:

  • Abrir o arquivo .csv no QGIS e verificar se o projeto está no sistema de referência geodésico WGS-84 (EPSG: 4326), pois é o sistema utilizado no OSM. Isso é realizado seguindo o caminho de menu:

Projeto –> Propriedades

  • Gerar os pontos que correspondem às coordenadas, seguindo o caminho de menu:

MMQGIS –> Import/Export –> Geometry Import from CSV file

escolhendo o formato .geojson para o arquivo de saída.

C - Preparar o arquivo para reconhecimento automático das etiquetas


Para facilitar o mapeamento dos pontos no OSM, é importante realizar a compatibilidade semântica dos nomes dos atributos dos dados no arquivo .geojson com os nomes de etiquetas adotados no OSM, para que as mesmas sejam reconhecidas automaticamente. Veja um exemplo na figura a seguir:

etiquetas automáticas

Realizar este ajuste, modificando os nomes de atributos do arquivo .geojson diretamente em um bloco de notas ou processador de texto, trocando os nomes com a função “localizar e substituir”, tendo atenção para não excluir as aspas, pois elas são necessárias para a integridade do .geojson.

Exemplo de nomes de atributos no arquivo .geojson das sirenes e suas etiquetas correspondentes no OSM:

ATRIBUTOS no .geojson —- TAG correspondente no OSM

nome —- ref (ex: EAAH1, EAAG6,…)

responsavel —- operator

bairro —- addr:suburb

cidade —- addr:city

país —- addr:country

latitude —- lat (ou latitude)

longitude —- lon (ou longitude)

Observações importantes:

O arquivo .csv do exemplo das sirenes contém ainda dois atributos (tipo e rede), para os quais não há correspondente direto no conjunto de etiquetas do OSM. Mas estes atributos (tipo e rede) podem ser unificados em um único atributo, nomeado como “note”, para entrar como uma etiqueta de nota, ou podem ser excluídos.

É importante criar mais um atributo denominado “emergency” e incluir os valores “siren” em todas as linhas do arquivo. E também excluir o campo “id” que foi criado para a geração dos pontos, em etapa anterior deste tutorial. Estas duas ações podem ser realizadas no QGIS.

D - Carregar o arquivo dos pontos no editor iD e mapeá-los no OSM


No https://osm.org, buscar a área de interesse (área de localização dos pontos, no exemplo das sirenes, correspondente à cidade de Maricá, RJ), aproximar e clicar em Editar, escolhendo o editor iD;

Realizar o alinhamento da imagem de fundo, caso necessário, pelo controle Imagem de fundo –> Deslocamento de imagem, no editor iD;

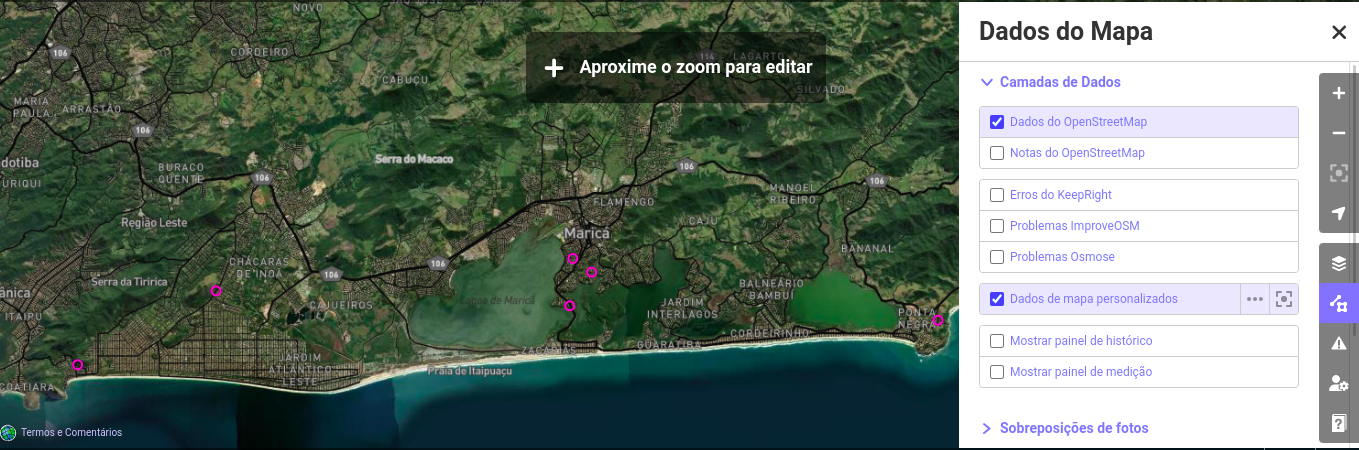
Carregar o arquivo .geojson (no exemplo, os pontos das sirenes), clicando no controle de menu à direita:

Dados do mapa –> Dados do mapa personalizados –> clicar nos três pontos e carregar o arquivo .geojson

Observação: o iD aceita o carregamento de arquivos vetoriais em outros formatos, como .gpx, .kml e .json, ou ainda, endereços de serviços de Tiles (WTMS).

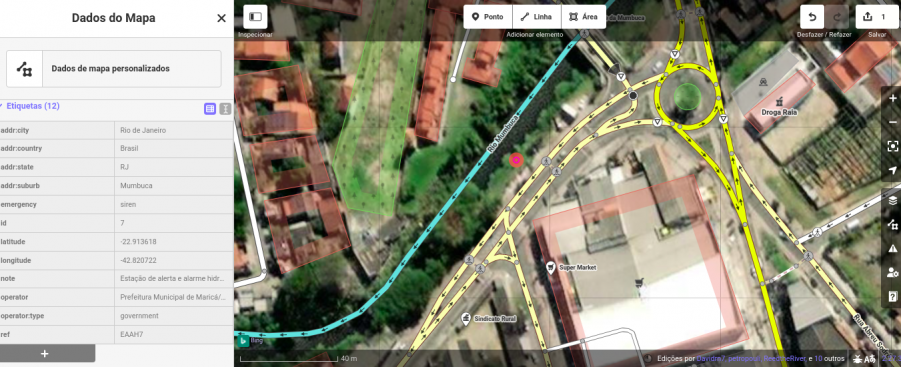
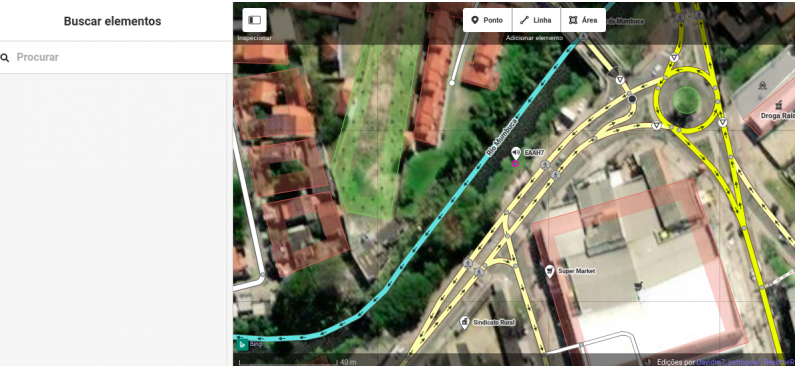
Veja que, após carregar o arquivo no iD, os pontos são mostrados em cor de destaque (no exemplo, rosa):

carregar arquivo no iD

Aqui, uma aproximação para um dos pontos:

ponto colorido no iD

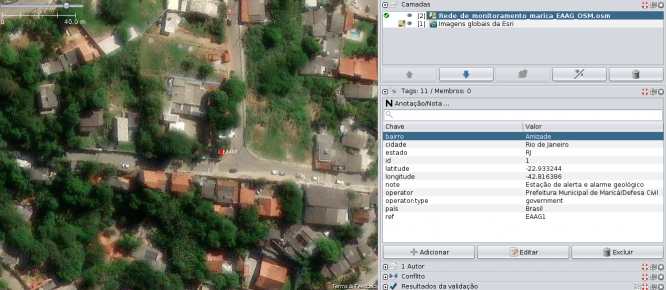
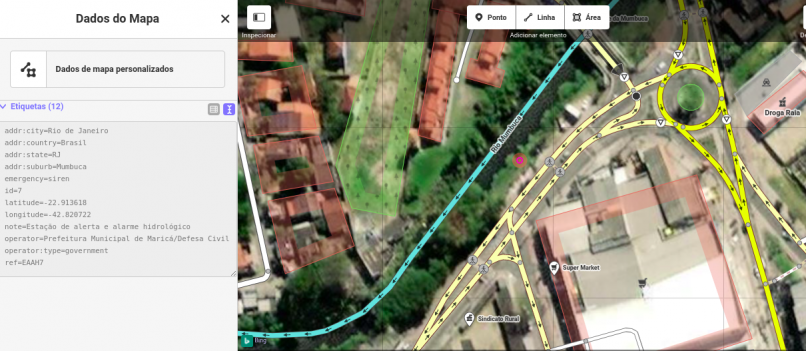
Clicando no ponto, as etiquetas são reconhecidas e exibidas automaticamente, pois já estão compatíveis semanticamente com as etiquetas do OSM:

zoom do ponto colorido no iD

Porém, estes pontos ainda não estão como objetos do OSM, estão apenas como uma camada de dados no iD.

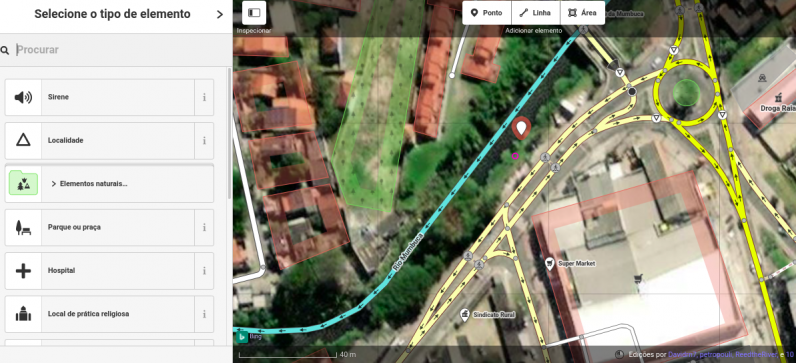
Para resolver isso, realizar a transferência dos pontos, um a um, verificando se já existem na base cartográfica do OSM. Para cada ponto, copiar as etiquetas da marca dos pontos coloridos e colar no ponto novo que adicionou.

copiar etiquetas

incluir ponto novo

colar as etiquetas

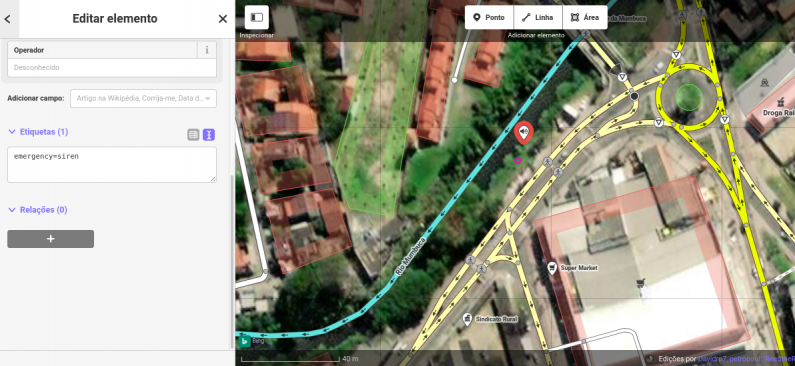
Após colar as etiquetas, o ponto assume o valor que está no campo “ref” (no exemplo das sirenes), sinalizando que o ponto e as etiquetas já são objetos OSM:

ponto pronto para upload

NO CASO DOS DADOS DE EXEMPLO, NÃO REALIZE O UPLOAD PARA O OSM, POIS JÁ ESTÃO MAPEADOS NA BASE!

Se estiver realizando o processamento dos próprios dados, pode realizar o envio (upload) dos dados no iD e não esquecer de informar a fonte e de incluir comentários detalhados que possam auxiliar mapeamentos futuros.

Algumas observações importantes sobre os comentários:

  • Lembrar que comentar apenas com hashtags não é uma boa prática, ofereça detalhes sobre o upload de dados que está realizando para o OSM;

  • Observar que há um limite de tempo para que um changeset permaneça aberto para edição, o que significa que deve realizar o upload dos dados que modificou no ID dentro de 1h. Caso haja muitos pontos, uma saída é realizar mais de um upload, enviando as modificações aos poucos e continuar trabalhando na edição;

  • Não incluir dados sensíveis de pessoas físicas e jurídicas no OSM;

Observação: se o leitor for um mapeador experiente, esta etapa pode ser realizada substituindo o uso do editor iD pelo editor JOSM e realizando o carregamento dos pontos, mediante procedimento de conflação de dados.

Criar uma visualização personalizada dos dados com uMap


Após realizar o upload dos dados no OSM, usando o editor iD, normalmente, em alguns minutos, os dados mapeados já podem ser visualizados no renderizador principal do OSM, em https://osm.org.

— Atenção: NÃO REALIZE O DOWNLOAD DOS DADOS DO EXEMPLO, POIS JÁ ESTÃO MAPEADOS —

Porém, se deseja criar uma visualização personalizada dos dados, modificando ícones, cores, realizando agrupamento de marcadores, gerando hot spots etc… e de uma maneira que seu mapa web esteja acessível a todos pelo navegador de Internet, pode ser criado um mapa dinâmico no uMap, com a mesma conta de usuário do OSM.

Para criar um novo mapa web e adicionar camadas dinâmicas – camadas que realizam a busca e o carregamento automático das feições no mapa, a cada visita na plataforma — seguir este passo-a-passo:

  1. Realizar o login no uMap com sua conta de usuário do OSM e criar um novo branco, que permanecerá em modo rascunho, até que seja compartilhado publicamente. Até lá, é possível trabalhar no mapa e as modificações não estarão visíveis ao visitante.

  2. Criar uma nova camada, clicando no controle de camadas do uMap (no modo edição), seguindo o caminho: Adicionar camada –> Dados remotos (no final do bloco)

  3. Preencher o seguinte (específico para o exemplo das sirenes de emergência):

  • URL
https://overpass-api.de/api/interpreter?data=[out:json][timeout:25];(node["emergency"="siren"]({south},{west},{north},{east}););out body;>;out center skel qt;
  • Formato: osm

  • Marcar a opção “Dinâmico”

Escolher o aspecto (aparência) das etiquetas e dos ícones nos controles da camada. Nessa via, a página Wiki do uMap oferece um guia em três línguas - inglês, francês e italiano, que podem ser consultados para esta etapa. Uma tradução do Guia do uMap para o Português (pt-BR) está disponível também neste link.
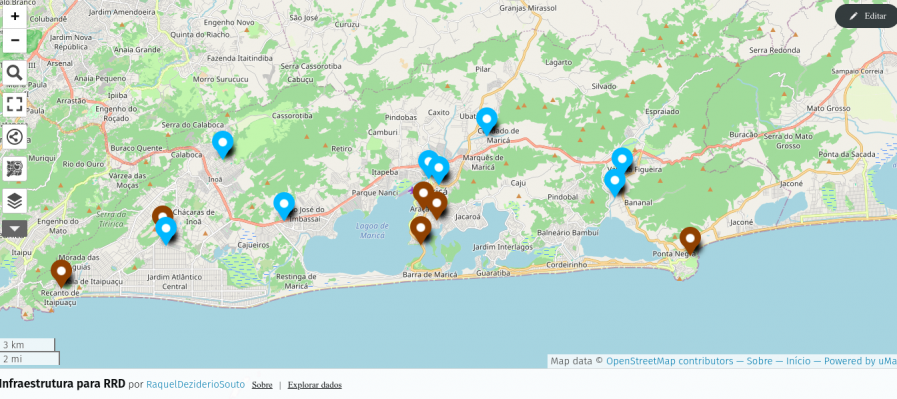
Parabéns!


Se você conseguiu realizar a prática até aqui, significa que está com um uMap parecido com este:

Screenshot do uMap uMap link

Na próxima entrada do Blog, mostrarei como criar um mapa dinâmico com o plugin Leaflet Map para Wordpress.

Este conteúdo é licenciado pela CC BY-SA 4.0 International. Você pode utilizar e adaptar este conteúdo, desde que cite o autor e mantenha a mesma licença nos conteúdos derivados.

Posted by valhikes on 7 February 2024 in English.

Ever since visiting Mount Lassic and then making edits in the region, I’ve had this nagging difficulty: What to do with a mountain whose high point is named differently? Mount Lassic has three peaks, the highest is called Signal Peak. I eventually mapped its survey point, which is also called Mount Lassic, and hoped that was done. (Apparently I shouldn’t map survey points except at the exact point indicated, so I’ve done this WRONG. I’ll just name a peak “Such-and-such Benchmark” then. Except a benchmark is specifically a vertical control and most at peaks are horizontal controls. “Such-and-such Triangulation Station” gets a bit long. Oh, the humanity!) Unfortunately, if one searches for the mountain, one only gets the Mount Lassic Wilderness and the Mount Lassic Trail, but there’s no hint that this goes to the high point of Mount Lassic. It goes, in fact, to “Signal Peak”.

Other places where there’s a named high point (peak) different from the main mountain are Marble Mountain (with Black Marble Mountain the high point). Someone seems to have simply marked a lower peak as Marble Mountain. If one does this, there’s a bit of a debate if it is the highest white peak or the most prominent white peak. Mount Konocti with high point Wright Peak. Currently both are marked close to the high point, but the main mountain has been given a lower elevation so doesn’t show often, but it is searchable.

Ideally, this all renders such that one sees the mountain name at low zoom and get individual peaks at high zoom. For purposes of clarity, I am using “mountain” to mean the landmass that may have many peaks and “peak” to refer to points where every direction is downhill. I think this is common English usage, but I’ve seen areas of maps where it looks like the usage was reversed. The only solution above that renders all eventually is the one on Marble Mountain. However, the result is not as desired and false. And which peak to you demote the actual mountain to? Mount Konocti has several named peaks to push the mount down.

Discussions in the past have gone on to relations. There’s a few in use, either of type “site” or “multipolygon” or suggested “multipoint”. Another solution is to mark the area as a natural=mountain. None of it gets rendered, but perhaps the renderers just need to catch up. All of it is currently used somewhere.

For the relations, some objections are that while points and ways are obvious from the start, even many experienced mappers don’t quite get relations. Count me among them. I’ve tried a few route relations. (And I should get back to the California Coastal Trail, I suppose.) There’s a comment about multipolygons being a bad idea after all. I’m definitely not going to delve into that. I went ahead and tried a site relation for Mount Lassic, first dropping on the other two minor peaks with the bare minimum of information. It still isn’t searchable and doesn’t render. My objections are that if someone adds a peak that should be part of the relation, it may or may not every get included.

Objections to marking an area as a natural=mountain are that the area is quite nebulous. The objectors liken the indistinct nature of where the mountain is to that of already “in use” natural=mountain_range, which seems to lack understanding that mountain ranges have many sub-ranges. Peakbagger.com will list 5 levels of ranges for any particular peak. Being part of the Rocky Mountains is far from the end of the story for mountain ranges. Mountains really don’t have so much difficulty. One person points out the object in drawing is to mark a general area that gets labeled, but that area itself is never expected to be rendered.

Although I’ve made a stab at making a relation, I think an area is best. I’m surprised that there’s 20 uses of natural=mountain worldwide and some of them don’t even make sense. How does a mountain have a leaf_type? (I must be doing this wrong?) There’s a quite old multilingual proposal. There’s a region:type that’s clearly getting discouraged now. There’s another 115 uses of natural=peak applied to ways, which seem to be generally closed. Here is one solving the problem of the different peak and mountain names.

Seriously, it’s cute that there’s a Bears Ears East and Bears Ears West, but when I zoom out, there should just be Bears Ears. It might be nice to find Maroon Bells on the map instead of Maroon Peak when zoomed out. It might be nice to have the various Mount Massive peaks represented and still known as part of the whole too.

Also, natural=mountain_range probably needs a bit of work in spite of the 5000+ uses already. The focus here is just getting the mountains right.

Location: Humboldt County, California, United States
Posted by L'imaginaire on 6 February 2024 in English.

Yesterday, I reached the point of one million map changes and twenty-thousand changesets. Leading up to this milestone, I tracked my progress on How did you contribute to OpenStreetMap? and carefully planned to make a single edit that would be my one millionth in my twenty-thousandth changeset. I eventually made a gimmicky changeset referencing my first mapping experience. Mission accomplished! However, despite the impressive numbers, my initial sense of accomplishment faded, replaced by nagging existential questions. Have the countless hours I devoted to OSM truly been worthwhile? Why have I been doing this? What is it exactly that I have been doing? … What is OpenStreetMap, really? And there it is, a question that seems very simple, but is not. It is the same question that hides far below the surface in Xvtn’s OSM Iceberg Meme. Inspired by this meme, user rtnf put it this way: “Is it a map? A dataset? A community? A trademark that encompasses an entire ecosystem consisting of the dataset, the tagging scheme, the rendering infrastructure, and the subculture around its mappers, developer-mappers, and third-party data consumers?? What is OSM, really?”

When you invite someone to go to openstreetmap.org for the first time, the first thing they read is “OpenStreetMap is a map of the world”. The next thing you usually want to explain to them is that OpenStreetMap is NOT (just) a map of the world. We then continue showing off different rendering styles, different editors, different tagging schemes … We pride ourselves being part of a secret society, where only the sworn in know what it is actually about. We giggle when we see the Iceberg Meme because it is “so true”. We say things like: “If you have been doing this for years, you will understand”. All of this without being able to answer a very simple, fundamental question: What is OpenStreetMap?

If we reflect on how important OSM has become, it’s really crazy to see how much difficulty we have to explain what this ‘thing’ is we are so passionate about. Think about it: we have been complaining that it’s not clear what the Overture Maps Foundation wants to do with OpenStreetMap, but soon it may be easier to explain what the Overture Maps Foundation wants to achieve than what OpenStreetMap actually is.

A proposal

Of course, asking questions and pointing at problems that need to be solved is relatively easy. Therefore, I will take the risk of also doing a proposal. I don’t think it is a very controversial one, but if you start reading it and immediately feel the need to start shouting at your screen because I got it all wrong, feel free to skip the rest of this section. It is just a proposal to get the ball rolling, not an attempt to convince you of anything.

I think it was at SotM.eu that I heard “OSM is a movement” and I quite liked that (feel free to stand up and let me know if it was you who said this). So, is it a movement? I cherry picked the Oxford English Dictionary definition: “A course or series of actions and endeavours on the part of a group of people working towards a shared goal”. I would say we have a winner! From here, we can explain what our common goal is (I would say “providing the data for making the best map(s) of the world”), how we want to achieve that goal, which values we adhere to, who we choose as our representatives for certain tasks … It might also influence some of the decisions we make, like what someone should see when they arrive at openstreetmap.org for the first time, what tasks the OSMF should take on, what expectations we have towards big tech that wants to capitalize on OSM … I realize this won’t solve all the challenges OSM is facing, but at least it is a start to build upon.

But what about …

But what about everything else above or below the surface? What about mapping maps? What about navigation for visually impaired people (Dutch)? What about mapping the etymology of street names? (Yes, I did sneak in some projects I like and/or care about.) Shouldn’t we celebrate the richness of OpenStreetMap instead of pretending it is something very simple? Of course! We should foster the diversity of mappers and their opinions. We should always be critical about what we have done and what we should do next. However, that shouldn’t prevent us from agreeing on the foundations on which to build our stories. Each with their own accents and anecdotes. But maybe with a bit more understanding from the outside world of what it is that we are so passionate about.

Posted by SomeoneElse on 6 February 2024 in English.

Signpost near Husthwaite

Although the raster maps at maps.atownsend.org.uk support zoom levels up to 24, until recently I’ve not made much use of that for showing extra data. However, there is a lot of room at these high zoom levels - as the picture above shows, enough for all the directions on this signpost here.

The name is shown as normal at lower zoom levels, then as you zoom in the directions are shown too, as you can see here.

Location: Acaster Mill, Husthwaite, North Yorkshire, England, YO61 4PG, United Kingdom
Posted by Jiri Podhorecky on 6 February 2024 in Czech (Česky). Last updated on 29 February 2024.

Současně s tím, jak jsem se začal věnovat mapování města, tak jsem si na vycházkách všímal dalších detailů, které jsem chtěl zanést do mapy.

Všímal jsem si, jak se realizují, či spíše nerealizují některé činnosti týkající se životního prostředí, které má v kompetenci městský úřad a Odbor životního prostředí. S některými činnostmi správy městské zeleně pro mne bylo těžké polemizovat, když jsem neměl žádné přesnější podklady o výskytu, nebo množství konkrétních jevů. Bez důkazů se argumentovat nedá.

Byly to detaily týkající se především městské zeleně kdekoliv ve veřejném prostoru. A tak jsem si je musel nejdřív shromáždit:

  • eko opatření ve městě
  • černé skládky
  • rizika území, eroze
  • Květinové louky a méně sečené trávníky
  • Ptačí krmítka a budky
  • skleněné plochy s rizikem nárazu ptáků
  • Živá divoká zvířata ve městě
  • Mrtvá divoká zvířata usmrcená a nalezená v katastru města
  • Zajímavé stromy
  • Invazívní rostliny (křídlatka česká, lupinus vlčí bob, slunečnice topinambur)
  • Suché stromy
  • vodní plochy s příležitostí revitalizace a lepšího hospodaření s vodou

Bylo jasné, že tyto informace nelze vkládat do obecné OSM mapy a tak jsem hledal konkrétní aplikaci, která nabídne kombinaci jednoduchosti a možnosti zadání vlastních mapových záznamů.

Nechtěl jsem používat Google mapu, protože s tou jsem udělal už před časem nepříjemnou zkušenost. Některé funkce a služby firma Google průběžně mění tak, jak jim byznysově vyhovuje. To znamená že pro uživatele mohou nečekaně vzniknout nová omezení nebo náklady za nově placené služby. Detaily podkladové mapy se zcela nehodí na mapování životního prostředí, protože Google se soustřeďuje na komerční záznamy firem a lidmi zadávané body zájmu.

Pak tu byly některé komerční projekty typu Mapotic, které mi také nevyhovovaly. Jednoduše proto, že služby vlastních záznamů bodů jsou omezené, nebo placené. Pro můj účel nekomerčního mapování jsem si nemohl dovolit platit takovou aplikaci. Nabídka placených funkcí nebyla pro mne tak důležitá.

Nakonec jsem došel k francouzskému projektu uMap, který je postaven nad OSM a k mému záměru vyhovuje perfektně. Měl jen drobný nedostatek, že uživatelské rozhraní nebylo přeložené do češtiny. To ale pro mne nebyl problém a tak jsem s pomocí překladové platformy Transifex projekt uMap přeložil a tvůrci český překlad do aplikace doplnili.

To bylo pro mne důležité, protože pro budoucí mapování jsem počítal se zapojením více místních lidí. A čeština hraje roli tam, kde je potřeba se rychle seznámit s neznámým uživatelským prostředím. Čekal jsem prostě, že mi s tím někdo další pomůže.

Vytvořil jsem tedy vlastní mapu Pozorování v Českém Krumlově a do ní v několika vrstvách a barvách doplňoval své body pozorování. K některým nálezům a výskytům zvířat jsem doplňoval i detaily a čas nálezu.

Překvapilo mne, kolik drobných zvířat hyne v prostoru města, většinou účinkem lidské činnosti, neznalosti, nebo dokonce bezohlednosti.

O zjištění a záměru jsem napsal na blog a požádal o spolupráci na sociální síti.

V plánu jsem měl i napsat podněty do participativního rozpočtu města, ohledně systematicky lepší péče o městské životní prostředí, v mnoha dílčích rovinách. Tak se i stalo, napsal jsem, ale podněty byly redukovány většinou z důvodů nedostatku peněz, lidských zdrojů, neochoty odpovědných lidí a všeho řečeného najednou.

Nakonec se to smrsklo na podnět k opatření ochrany ptáků proti nárazům do skleněných ploch na vybraných autobusových zastávkách. Podnět byl schválen v participativním rozpočtu města roku 2022, ale dosud nebyl realizován.

Jediné, co jsem realizoval byl dokument o ochraně drobných zvířat ve městě

Text

A jak to všechno dopadlo?

Mapa uMap byla docela rozsáhlá, ale stejně to nevedlo k cíli. Selhalo to totiž na několika okolnostech, které v celém úsilí hrály důležitou roli. Ale ty už se mapy netýkaly.

uMap mohu pro mapování vlastních bodů doporučit. Pokud jste ale milovníkem přírody, raději vyzkoušejte specializovanější projekt iNaturalist, který vaše záznamy o přírodě zahrne do odbornější celosvětové databáze. A o tom napíšu zase někdy příště :)

Location: Český Krumlov, okres Český Krumlov, Jihočeský kraj, Jihozápad, 381 01, Česko
Posted by lhirlimann on 5 February 2024 in English.

Whilst attending FOSDEM in Brussels this week-end. Of course as I’m European I was able to use streetcomplete while roaming. So I did and collected a bunch of bagdes. While spending time with a friend, as we were walking to get/find food, I was playing. When I explained what I was doing, he got immediately interested in joining, so I demoed a bit more and had one more person going to map around his home.

Location: 1820, Melsbroek, Steenokkerzeel, Halle-Vilvoorde, Flemish Brabant, Flanders, Belgium

I’m Harrison, a hobbyist mapper based in Brooklyn, New York. I’ve been a map lover for as long as I can remember. Over the last few years I have gotten more involved in OpenStreetMap including my first trip to State of the Map US last year.

Mapping Projects

My ongoing “forever” project is mapping sidewalks in Brooklyn. With about 1,600 miles of roads there’s a long way to go! Beyond just mapping sidewalks I am working on adding curbs with accessibility details.

My most interesting mapping project has been working on the map at Train Mountain Railroad, the world’s largest miniature railroad. This started out as armchair mapping from home, then when I visited this last summer I worked on Mapillary “rail-level” imagery and other detailed mapping. The most exciting part has been the engagement from the community at the railroad getting engaged. The improved map has been immediately useful in the Train Game, and is being incorporated into a new track guide. This project has been fantastic as a complete study from all kinds of mapping to end data users.

Mapillary "rail-level" imagery

As an extension of my miniature railway mapping, when Carto started rendering roller coasters there was an opportunity to clean up many of them that were mistagged as railways. Working with watmildon we cleaned up a variety of roller coasters around the world by removing lots of light rail, narrow gauge, and miniature railway tags.

Board Related Experience

Professionally, I work in non-profit accounting helping organizations to manage their whole financial picture. In this work my favorite part is reviewing finances with my client’s board and planning for their future.

Recently I have joined the OSMF’s Finance Committee to help with their financial management. In this capacity I have been able to lend my experience to their budgeting process and lay groundwork for financial reporting and enhanced finance policies.

Board Goals

My primary focus as a board member will be to review and enhance financial reporting. Based upon that reporting I want to guide strategy towards building financial reserves and securing the long term future of OSM US.

Aside from financial reporting itself, I will review the organization’s finance policies and procedures. With an eye towards implementing any missing best practices.

Looking towards the far future, I intend to encode my non-profit finance expertise into organizational knowledge so it will remain impactful far beyond my board tenure.

Posted by Thelone1986 on 4 February 2024 in French (Français).

Vous vous souvenez la semaine dernière quand je disais “mais les nouvelles images ouvrent pas mal de portes”? Et bien j’en ai profité pour… ne pas faire grand chose avec pour le moment 😅

Plus sérieusement, je n’ai effectivement pas été des plus actifs cette semaine avec seulement une poignée d’updates dans la boîte, principalement des “retouches” en rapport avec d’autres changesets récents. J’ai également fini d’ajouter les branches du Proxibus de Seraing et avait enregistré la session pour en faire une vidéo, mais c’était un peu bof pour être honnête et j’ai laissé tomber l’idée.

Au niveau vidéo, c’est aussi plus léger cette semaine avec :

Ce randonneur part faire du repérage pour chemins.be dans le Bois de l’Abbaye à Seraing - Enfin une sortie live où je pars dans le Bois de l’Abbaye pour prendre des photos pour le site chemins.be. Je montre aussi 2-3 choses que j’ai ajouté sur OSM dans le passé pour compléter ce bois

Ce mappeur OpenStreetMap retourne du côté de Bierset pour plus de modifications - Version live de ce changeset où je reviens sur Bierset après la mise à jour du SPW pour… également mettre à jour la carte OSM

Et voilà pour cette semaine. Je serai de nouveau un peu plus occupé cette semaine donc je ne sais pas trop si ce rythme continuera ou si j’aurais le temps pour trois vidéos, mais on verra bien.

A+

Location: 4100, Ougrée, Seraing, Liège, Wallonie, Belgique
Posted by Filip009 on 4 February 2024 in English. Last updated on 6 February 2024.

EN:

A lot of new mappers are trying to edit existing element instead of creating new one and set properties to them. (For example some new mapper added amenity=pharmacy to whole apartment building insted of creating one node for it.)

Also I think it would be good idea to hide some existing layers for newies (at least boundaries). New mappers do not need to work with them, because they are not changing for a lot.

In iDeditor a lot of times happens that new mapper connect road with forest boundary, because he just moved node on way for a bit and iDeditor connected this 2 elements (This can be prevented by holding Alt, but new mappers do not know this). So we can at least think about layering OSM at least for new mappers.

Also when new mapper is crating new way, which is going in the same direction as some existing way (boundary or forest boundary) he many times connect this new way with existing one.

Proposed layers:

  • POI
  • buildings, highways, railways
  • landcover
  • boundaries

In JOSM I’m using filter to hide landcover and boundaries for most of time. Only when I want to work with landcover or boundary, only then I revert filter to show only this type of ways.

SK:

Čím viac sa nad tým zamýšľam, tým viac mi to príde vhodnejšie. Veľa nováčikov sa snaží niečo pridať, lenže väčšinou len upravia existujúce elementy namiesto toho, aby pridali nové. Taktiež si myslím, že by bolo vhodné nováčikom skryť aspoň hranice. V iDeditore sa nováčikom často stáva, že spoja cestu s hranicou lesa (Nevedia, že keď podržia Alt, tak sa im to automaticky nespojí). Takže môžme aspoň pouvažovať nad nejakými vrstvami v OSM.

Navrhované vrstvy:

  • POI
  • budovy, cesty, železnice
  • lesy, lúky, polia …
  • hranice

V JOSM mám väčšinou zapnuté filtre na skrytie landcover a hraníc. Iba, keď potrebujem elementy tohto typu editovať, len vtedy si filtre prevrátim.

it’s me again speaking from beyond the grave lmao!, todays diary entry consists of a bait and switch a user is trying to do first by removing a simple note from South Australias Major Traffic Network, and therefore after based on “Whats on the Ground” change the classifications of the road network to whatever the user feels. The problem with this is that “Whats on the Ground” literally has no authority over “actual nature of the road”. If this does not make sense please read the community link below.

https://community.openstreetmap.org/t/automated-edit-to-remove-note-on-highway-trunk-in-sa/108612/12

Who Am I?

Nice to meet you! My name is Nicholas Hudanich and I am a 23-year old transportation engineer living in New York City. I currently work as an associate transportation modeler at Aimsun Inc.

I achieved my Bachelors in Civil Engineering and Masters’ in Transportation Engineering from New York University Tandon, and I graduated in December, 2023. During my time at NYU, I was the president of the Institute of Traffic Engineers Student Chapter. I additionally assisted in research at the C2SMART center, who I encourage you to read on further; their work is quite interesting. The most fascinating of the projects I worked on was helping the MTA roll out the Accessible Stations Laboratory at the Jay Street-Metrotech station. We tested over 20 new accessibility features as a testbed for full network deployment, including tactile guidance for visually impaired individuals and level boarding areas at the center of the subway platforms.

I am additionally an organizer of the annual Transportation Camp NYC, which is an “unconference” where several hundred industry experts come to discuss new innovations, and help university students network with companies for future employments in transportation engineering.

If you are curious to learn even more about me and my various hobbies, please see my bio on OSM:

https://www.openstreetmap.org/user/BeaconOSM

My Involvement with GIS and OSM

My lifelong commitment to transportation, and specifically mobility, has only naturally led to being an avid contributor to OpenStreetMap. I started mapping on OpenStreetMap in 2017, and have continually expanded the capacity with OSM since then. I have frequently contributed to ongoing humanitarian efforts via HOTOSM, as well as through the OpenStreetMap US tasking manager.

When not contributing to these targeted efforts, I have sought to improve the mapping standard across the country, by improving the accuracy of tagging, fixing relationships, and ensuring high-quality geometry of road networks, including in rural areas. A few of my efforts that I am most satisfied with and proud of include completely mapping the communities of Buras & Triumph, LA (Suffering from saltwater intrusion), and CDP-focused natural/building mapping, such as Park City WV, Baltimore VT, and Pawling / Town of Northeast NY.

Finally, I am involved with GIS-projects outside of the OSM sphere, namely using GIS to monitor the health of eelgrass populations in Duxbury Harbor, MA, and assisting the town of Norwell MA in creating a trail map for the conservation areas in that town (Which involved a lot of walking too!)

Issues of high personal emphasis

A. Improving the quality of complete map data in exurban and rural areas of the US

B. Improve the usage and effectiveness of the OSM US Tasking Manager

C. Encourage the greater use of OSM data in research initiatives, which includes adapting OSM data to be cleaner and more utilitarian.

Contact information

Please reach me at email:

Nicholas@Hudanich.net

https://www.linkedin.com/in/nhudanich/

https://hdyc.neis-one.org/?BeaconOSM

https://yosmhm.neis-one.org/?BeaconOSM

Posted by Jiri Podhorecky on 2 February 2024 in Czech (Česky). Last updated on 5 February 2024.

Jedním z kanálů je Schwarzenberský kanál, který sloužil ve své době k dopravě dřeva ze šumavských lesů.

Druhým zajímavým vodním dílem je Podkrušnohorský přivaděč , někdy také nazývaný Přivaděč Ohře - Bílina. Jeho role byla jiná, sloužil především jako ochrana povrchových dolů před povodněmi.

Zatímco první kanál využívá přírodních zdrojů vody, ten druhý potřebuje načerpat vodu z Ohře a přivést ji potrubím až na začátek kanálu. Pak už voda teče sama.

A který kanál je delší? No, jednoznačně ten Schwarzenberský. V tom Podkrušnohorském zase proteče víc vody.

Location: Vernéřov, Klášterec nad Ohří, okres Chomutov, Ústecký kraj, Severozápad, Česko

MAP

Posted by Magick93 on 1 February 2024 in English.
Map often
Map early
Map in the mornings
Map at noon
Map in the evenings
Map late at night
Map from dusk to dawn 
Map on weekends
Map daily 
Map every day in your heart
Map your town or city!
Map what you like
Map where you go
Map whenever possible
Map who you love
Map obscure and rare tags
Map for yourself
Map for humanitarian causes 
Map alone
Map together
Map to your heart's content
Map for Light, Life, Love & Liberty
Map !
Location: Colonia Valle de Aragón 1a. Sección, Nezahualcóyotl, State of Mexico, 57100, Mexico
Posted by kmpoppe on 1 February 2024 in English. Last updated on 2 February 2024.

TL;DR: There are quite a few places on the continent that still need mapping. If you want to know why and how I came to that conclusion, read on ;-)

Preface

Since March 2023 there’s a handy bot called @SmallTownUSA@en.osm.town on the Fediverse, that posts a daily “task” out to its followers, highlighting “small towns” in the United States of America, that, to use the same phrasing, “seem like they could use some mapping”, along with a screenshot of the (Carto) map of the area.

Sparing the full technical details, the program randomly picks an entry from an overpass export of all nodes that have any place tag and a population tag with a value of less than 1000 (hence the name “SmallTown”) in the USA (currently 11389), asks overpass whether there are 10 buildings or less in 800 meters around that node and if so, posts about it.

As the bot has been doing this for about 10 months now, there seem to be at least 300 places that match the above description. Naturally, I wondered, how Europe would fare in comparison. Chatting with the bot’s developer, Matthew Wildon (OSM, Fediverse), they told me, that they checked France for potential candidates and found none and then didn’t look into it any further.

What’s on on the Continent?

My interest was now piqued. Would a similar “SmallTownEurope” bot make any sense, or would it run out of things to post within a week? Or is Pascal Neis’ Unmapped Places of OpenStreetMap Result Map enough to find areas where mapping is needed?

Suffice it to say, I wouldn’t know the answer to that from purely looking at the map, I needed data. So I quickly got myself the above-mentioned Overpass Exports for Areas in Europe - where I was using the English Wikipedia definition of what’s in Europe: “[…] countries falling even partially under any common geographical or political definitions of Europe”. To cover most of the area of those countries, I also checked the “de facto independent countries with limited to no international recognition” (Abkhazia, Kosovo, Northern Cyprus, South Ossetia, Transnistria) as well as “dependencies and similar territories with broad autonomy [that] are also found within or close to Europe” (Aland, Guernsey, Jersey, Faroe Islands, Gibraltar, Greenland, Isle of Man, Svalbard).

Way to go!

263845 nodes fall into the definition of this survey (any place tag and a population tag with a value of less than 1000 and more than 0). I then asked poor Overpass for each one how many buildings there were in an 800-meter radius. That took about 3 days 😅

The beauty of knowing the buildings count for every node now is that we can easily adjust the parameters we’re looking at. When looking through the matches in Germany I found that some very well-mapped places could be considered “false positives”. 5 people living in a dwelling with 7 buildings is a very reasonable idea, but matches the “less or equal than 10 buildings” rule, so to get to my final numbers I added the filter “more people living there than buildings mapped”.

In the end, I arrived at 89338 matching towns (or 33.86%) with the 4 highest countries (Spain, Russia, Ukraine, Romania) making up 82.1845% of those matches (73422).

4 countries do not have a single match: Belgium, Malta, Norway and Switzerland

You want numbers, you say?

Alright then.

Table 1: Ordered by total matches in a country

Rank Country Matches Total Percent
1 Estonia 1 256 0.3906
1 Iceland 1 80 1.2500
1 Ireland 1 46 2.1739
1 Netherlands 1 1410 0.0709
1 Slovakia 1 1863 0.0537
6 Greenland 2 22 9.0909
7 Latvia 7 97 7.2165
8 France 10 9484 0.1054
9 Northern Cyprus 11 15 73.3333
10 Cyprus 19 55 34.5455
11 Germany 26 9991 0.2602
12 Finland 29 177 16.3842
13 Austria 31 8955 0.3462
14 North Macedonia 32 39 82.0513
15 Denmark 38 3798 1.0005
15 Hungary 38 1915 1.9843
17 Moldova 44 240 18.3333
18 Kosovo 49 95 51.5789
19 Albania 59 102 57.8431
20 Czech Republic 68 12895 0.5273
21 Montenegro 69 197 35.0254
22 United Kingdom 77 710 10.8451
23 Azerbaijan 97 109 88.9908
24 Poland 101 9586 1.0536
25 Slovenia 106 1695 6.2537
26 Bosnia and Herzegovina 115 434 26.4977
27 Armenia 133 527 25.2372
28 Sweden 223 1230 18.1301
29 Bulgaria 304 598 50.8361
30 Kazakhstan 351 479 73.2777
31 Belarus 395 4810 8.2121
32 Turkey 598 972 61.5226
33 Croatia 810 1572 51.5267
34 Georgia 883 1462 60.3967
35 Portugal 952 1562 60.9475
36 Lithuania 2328 16685 13.9527
37 Greece 2365 3156 74.9366
38 Italy 2597 16800 15.4583
39 Serbia 2953 3871 76.2852
40 Romania 7940 9840 80.6911
41 Ukraine * * *
42 Russia 20112 48180 41.7435
43 Spain 28983 52081 55.6499

Table 2: Ordered by percent of towns matched

Rank Country Matches Total Percent
1 Slovakia 1 1863 0.0537
2 Netherlands 1 1410 0.0709
3 France 10 9484 0.1054
4 Germany 26 9991 0.2602
5 Austria 31 8955 0.3462
6 Estonia 1 256 0.3906
7 Czech Republic 68 12895 0.5273
8 Denmark 38 3798 1.0005
9 Poland 101 9586 1.0536
10 Iceland 1 80 1.2500
11 Hungary 38 1915 1.9843
12 Ireland 1 46 2.1739
13 Slovenia 106 1695 6.2537
14 Latvia 7 97 7.2165
15 Belarus 395 4810 8.2121
16 Greenland 2 22 9.0909
17 United Kingdom 77 710 10.8451
18 Lithuania 2328 16685 13.9527
19 Italy 2597 16800 15.4583
20 Finland 29 177 16.3842
21 Sweden 223 1230 18.1301
22 Moldova 44 240 18.3333
23 Armenia 133 527 25.2372
24 Bosnia and Herzegovina 115 434 26.4977
25 Cyprus 19 55 34.5455
26 Montenegro 69 197 35.0254
27 Russia 20112 48180 41.7435
28 Bulgaria 304 598 50.8361
29 Croatia 810 1572 51.5267
30 Kosovo 49 95 51.5789
31 Spain 28983 52081 55.6499
32 Albania 59 102 57.8431
33 Georgia 883 1462 60.3967
34 Portugal 952 1562 60.9475
35 Turkey 598 972 61.5226
36 Ukraine * * *
37 Kazakhstan 351 479 73.2777
38 Northern Cyprus 11 15 73.3333
39 Greece 2365 3156 74.9366
40 Serbia 2953 3871 76.2852
41 Romania 7940 9840 80.6911
42 North Macedonia 32 39 82.0513
43 Azerbaijan 97 109 88.9908

* There shall be no mapping in Ukraine for now

Where do we go from here?

I think it’s clear from the numbers, that working on a single match per day isn’t feasible. That would take 244½ years, and we can’t wait that long, can we?

There is now a MapRoulette Project for all matches except Ukraine and Russia.

If you have any other ideas or questions, let me know in the comments.

Have a lovely day.

K

Imagen de kai Stachowiak. Licencia: CC0 Public Domain Imagen de kai Stachowiak. Licencia: CC0 Public Domain

Hace unos días estuve en Bogotá, que en ese momento estaba afectada por incendios forestales, lo que había levantado el interés en temas medio ambientales en mucha gente. De hecho en una reunión de mapeadores uno de los temas de conversación fue “qué” mapear para contribuir de alguna manera a visibilizar problemas urbanos que se agudizan con el cambio climático.

La charla fue larga y nutrida y todos aprendimos un poco de todos. Quedando en evidencia que se necesita hablar más sobre esto para que las personas que quieran contribuir al mapeo y de paso colaborar de alguna forma con la mitigación del cambio climático puedan encontrar fácilmente cómo hacerlo.

Así pues, a continuación los temas de mapeo planteados en esa charla y algunos otros que agregué a la lista producto de conversaciones con otros mapeadores.

Árboles. Los árboles son geniales, añaden color al paisaje, producen oxigeno, dan sombra y si están en colinas pueden contribuir a disminuir el riesgo de deslizamientos. Mapearlos debemos. En caso de dudas consultar esta guía de mapeo de árboles en la wiki.

Fuentes de agua. El agua es vida, y cubre buena parte de nuestro planeta. Si bien hay muchos cuerpos y cursos de agua, algunos todavía no están mapeados o toca actualizarlos. Acá las etiquetas e indicaciones adicionales. En la ciudad también es bueno mapear fuentes de agua, muy necesarias para cuando el calor arrecia. Acá como etiquetar los diversos tipos de fuentes existentes.

Desechos sólidos. La basura es un problema común a muchas ciudades. En OpenStreetMap podemos mapear los contenedores de basura de diversos tamaños, según lo especificado acá y acá. Adicionalmente esta etiqueta para casos de contaminación. Ahora, si queremos mapear la basura propiamente dicha podemos usar la aplicación OpenLitterMap que georeferencia en un mapa basado en OSM las fotos de basura que subamos a la plataforma.

Contaminación auditiva. Las ciudades latinoamericanas pueden ser bulliciosas, a veces demasiado. Lo sabemos por nuestra propia experiencia y lo comprobamos con los sensores que andan colocados por diversas partes de las ciudades. Para mapear dichos sensores existen estas instrucciones referidas a diversos tipos de sensores -no solo de ruido- y la etiqueta especifica para ruido. También se pueden mapear barreras de ruido. Pero si quieren mapear el ruido como tal, una herramienta que se presta para eso es Umap, miren si no este mapa de ruido de un barrio de la ciudad de Medellín, Colombia.

Jardines. Mapeamos parques y áreas verdes pero a veces nos olvidamos de los jardines, y estos ponen su granito de arena en embellecer las ciudades, pero sobre todo proporcionan un espacio donde relajarse y eliminar el stress, bien sea descansando en ellos o cultivando nuestras plantas favoritas. Acá las indicaciones para etiquetarlos correctamente y con precisión de estilo. (No olvidar mapear los huertos, hay muchas redes de huerteros).

Línea costera. Hay países que están en peligro de desaparición por el cambio climático. Debido a que el calentamiento global derrite los hielos polares, el nivel de las agua sube, y estos países -islas de poca altura- sufren las consecuencias. Pero otros países también pueden ver desaparecer parte de su territorio por esta misma razón, varios de la región entre ellos. Podemos mapear a detalle estas zonas para luego monitorearlas. Acá la etiqueta a usar y también una explicación de las complejidades de este tipo de mapeo. Para mapear específicamente el nivel de las aguas ver acá y para inundaciones acá.

Este post acepta sugerencias y correcciones, así que los invito a comentar con sus aportes al tema.

Location: San Javier No. 2, Comuna 13 - San Javier, Perímetro Urbano Medellín, Medellín, Valle de Aburrá, Antioquia, RAP del Agua y la Montaña, 050033, Colombia