-
Users' Diaries
Recent diary entries
Posted by Brazil Singh on 30 March 2024 in English.
Last updated on 15 May 2024.

Asia Pacific Hub and World Vision Bangladesh Field Mapping and Data collecion Experience.
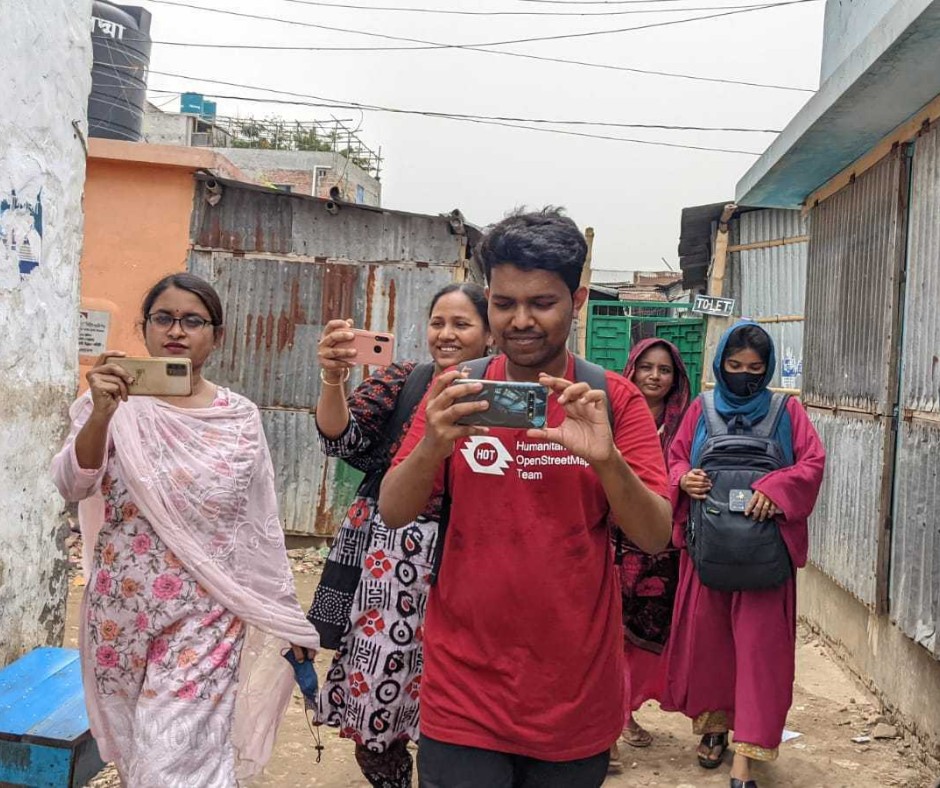 Open Mapping Guru, Brazil Singh in a field visit and data collection in Mirpur and Duaripara, Dhaka.
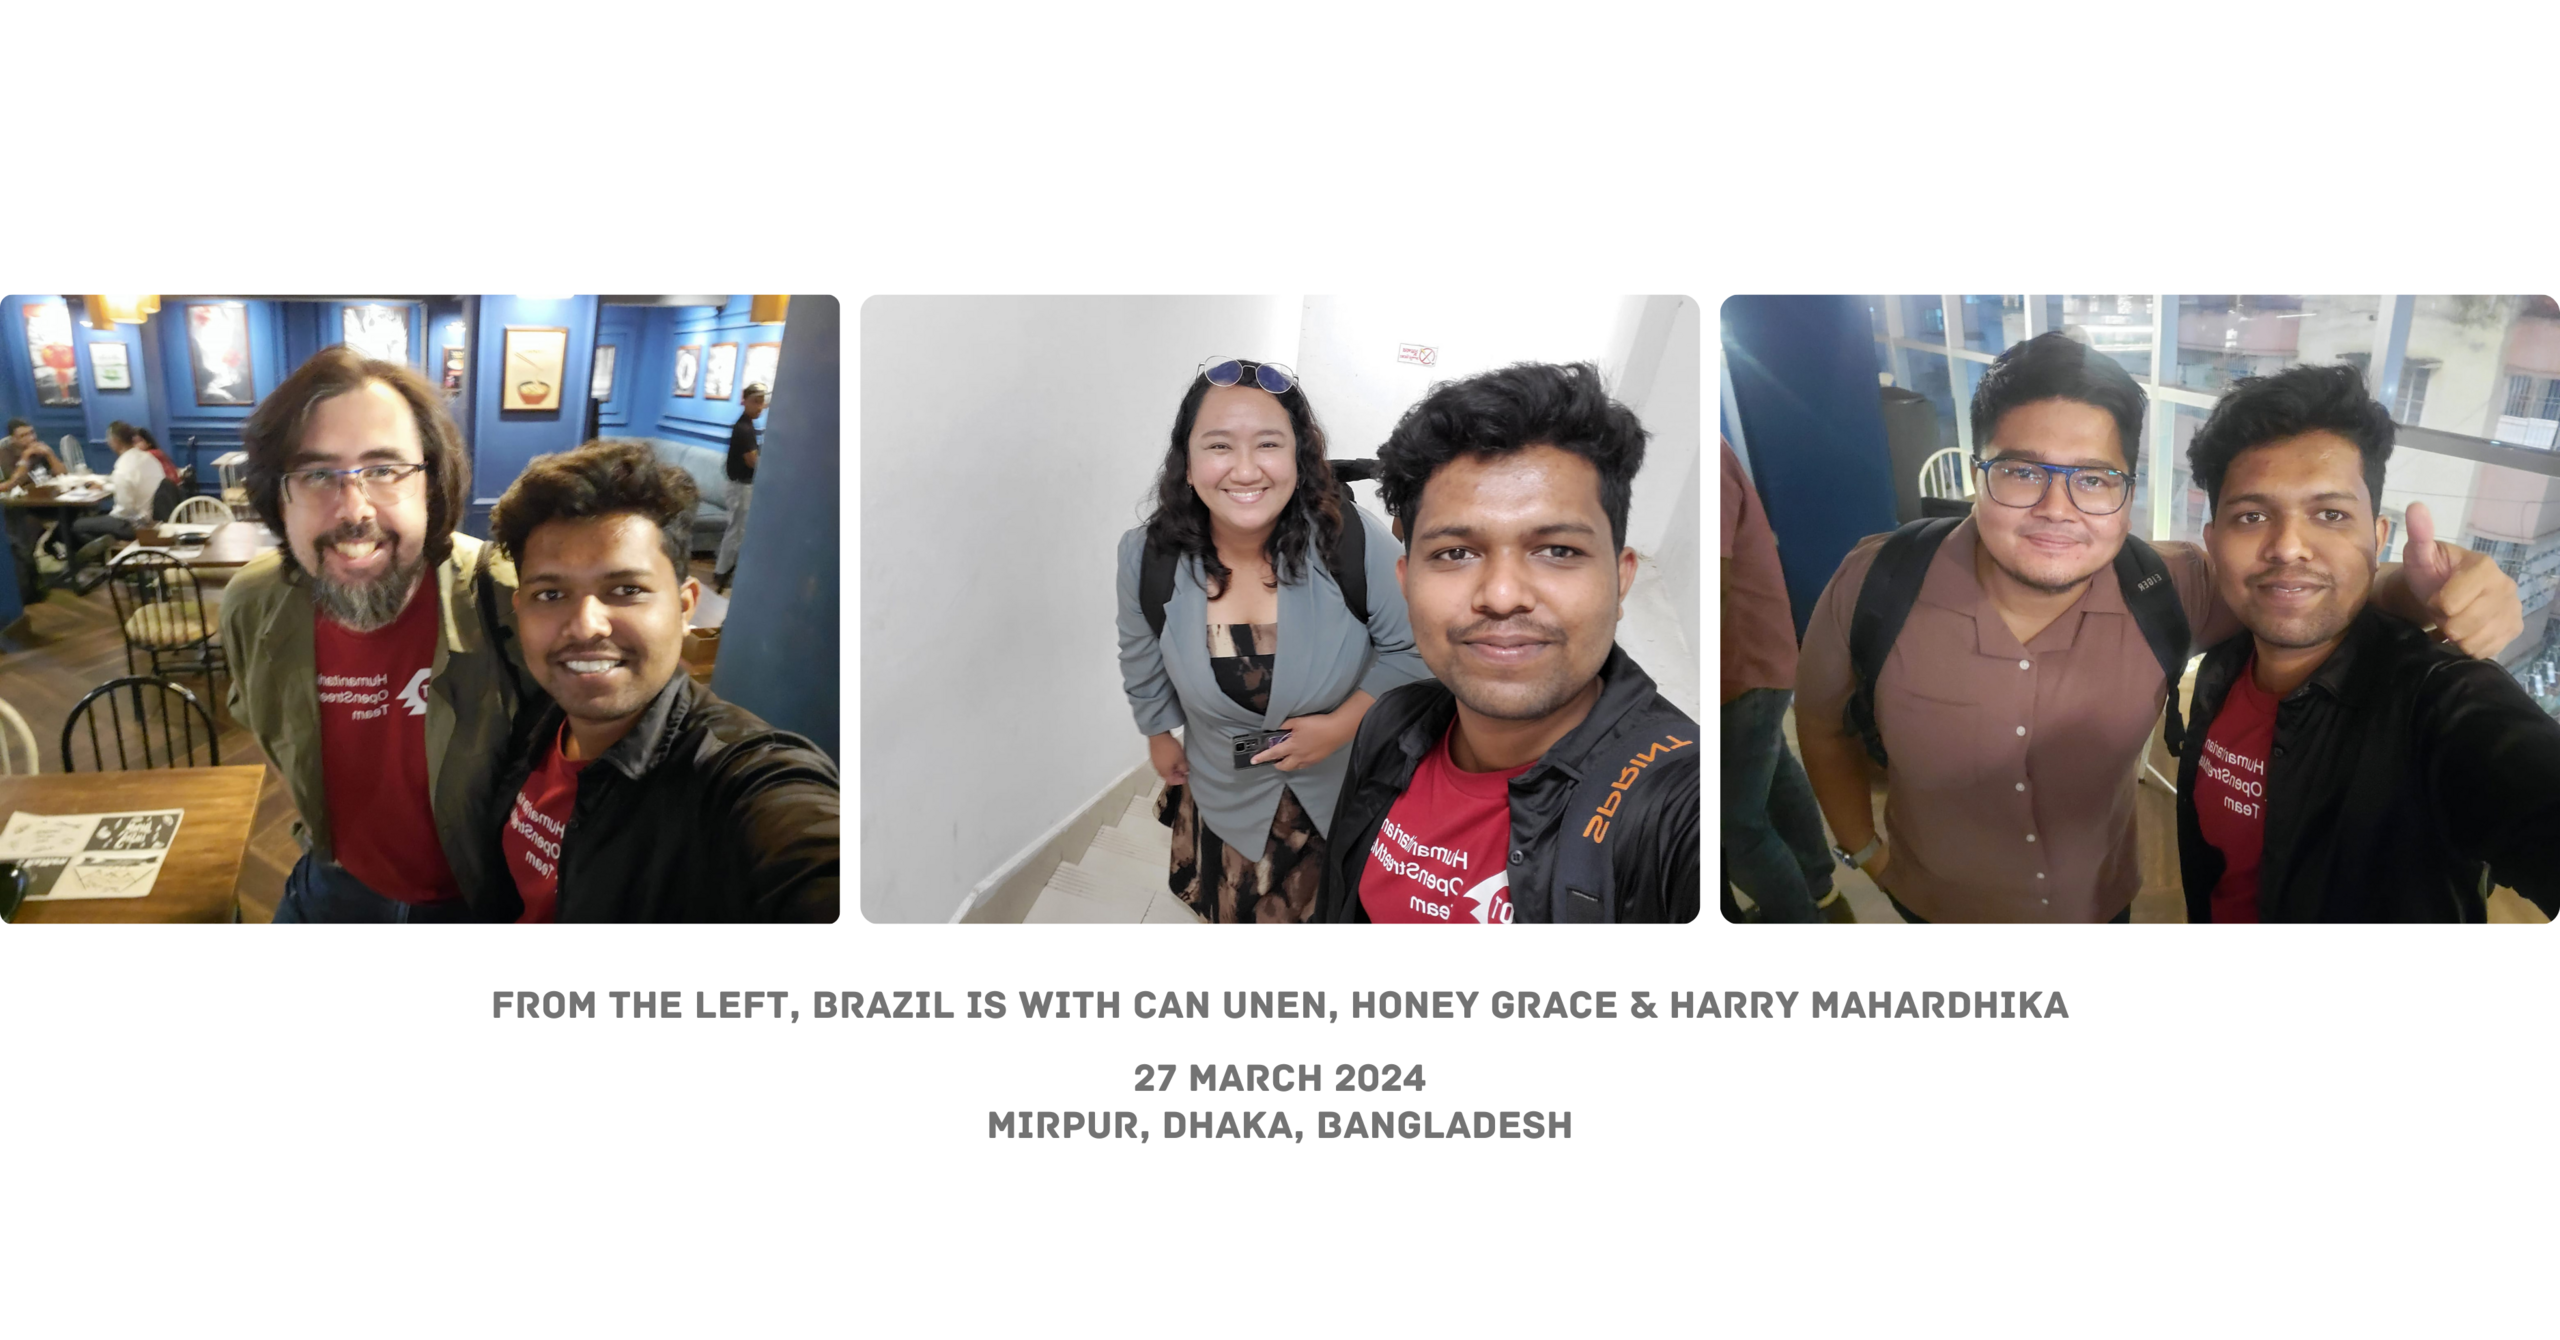
On Thursday 21 March 2024, I received invitation from Open Mapping Hub Asia Pacific & also brilliant Mikko Tamura, Community Manager for Asia and the Pacific at Humanitarian OpenStreetMap Team, for the coordination of OM Guru for Dhaka Field Visit & Data Collection. I was so much exited, and I accepted the invitation instantly. And then I got the news about the guests who are coming to Bangladesh and they were Can Unen, Senior Manager for Community & Partnerships, Humanitarian Openstreetmap Team , Honey Grace Fombuena, GIS AnalystGIS Analyst, Humanitarian OpenStreetMap Team and Harry Mahardhika Machmud, Senior Program Manager for Asia-Pacific at Humanitarian OpenStreetMap Team
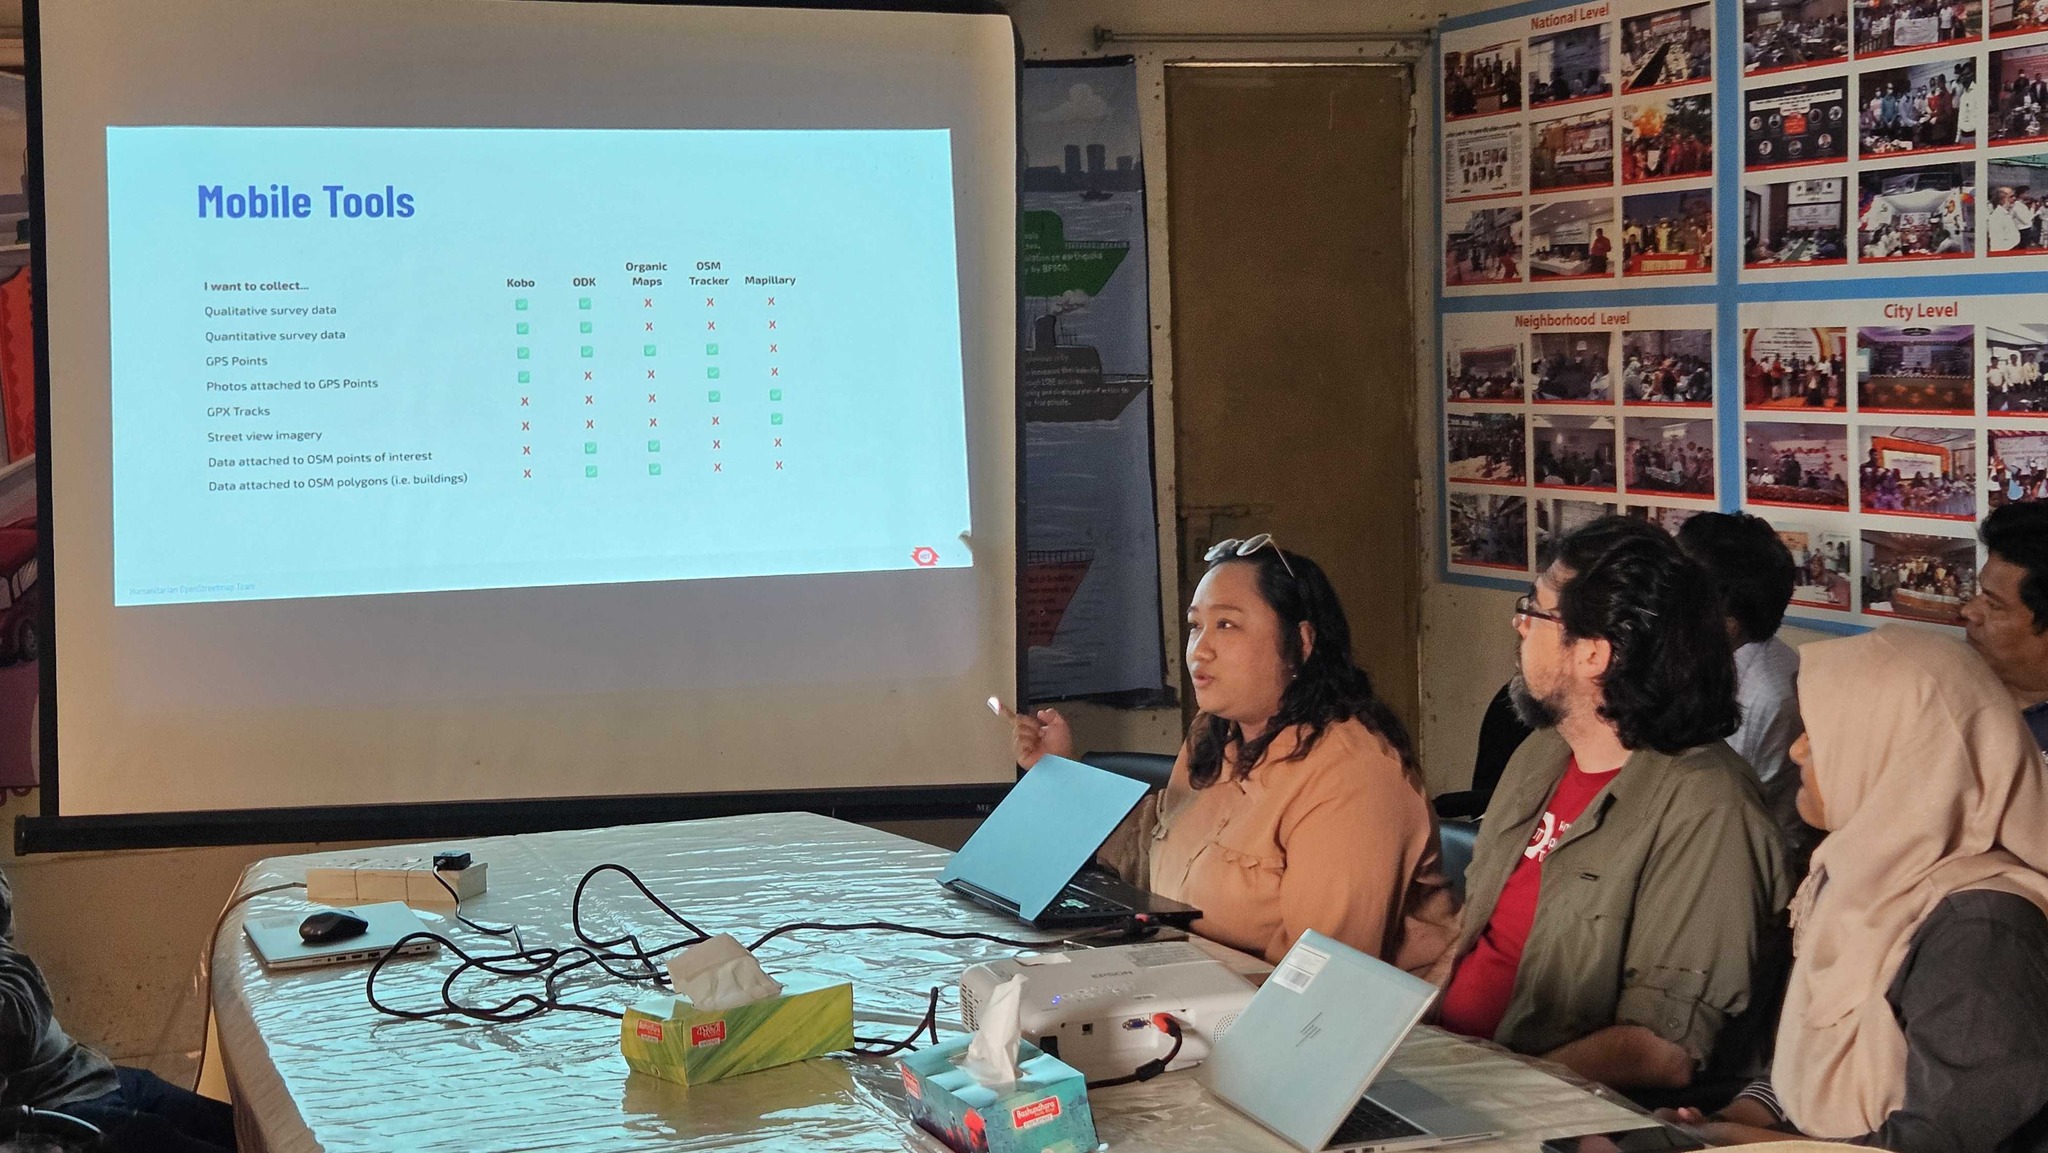
On 27 March 2024 I went to World Vision Bangladesh and there i met with other OM Gurus and also with World Vision Bangladesh’s staff members and with vouleenters. So basically we divided into three teams. Where I was leading the mapiliary with Harry and other two GURUS are in ODK with Miss Honey and Field Paper with Can Unen.
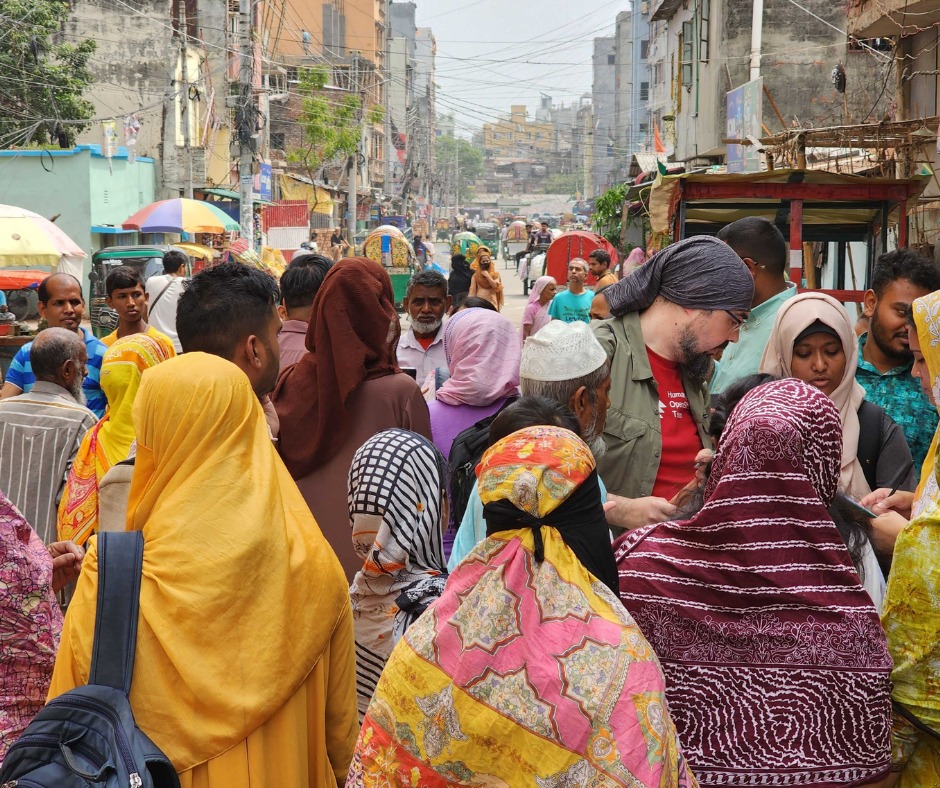 We selected two areas in Mirpur for field visit and data collection. First on was Duaripara and second one was Milat Camp. So first I trained the voulenteers and my team members about mapiliary and how to collect data. Then we went to the field visit. So, in the field, we mapiliary team divided into two groups, one group went inside the slum and collected data and another one group collected data from outside. We collected data in 1.30 hours and it was an amazing experience. Like from the field, collecting street level images. It was really amazing.
So after completing the field trip, we come back to office, and we discuss the problems, weakness, strength and opportunities of that area. We also talked with local people to know which main things basically they need. The ODK team also detected so many problems and also the field papers, which was superb. And after finishing the work, we were invited for the dinner near office. So after the office, We went to the restaurant which was also in MIrpur. The restaurant was in a beautiful place with metro rail area. So the iftar dinner was also amazing, where we 12 gurus and 3 AP Hub Members and also Tasauf A (Ribin) Baki Billah bhaiya, Executive Director at Bangladesh Open Innovation Lab (BOIL), and SM Sawan Shariar, Regional Ambassador of Youthmappers were present. After finishing the iftar dinner, we went for coffee. And there we spend quality times and discuss a lot of things about OpenStreetMap and also the traditions of our country. And after that we take a group photo and leave the resturant. When I am writing this diary, I am missing them so much.
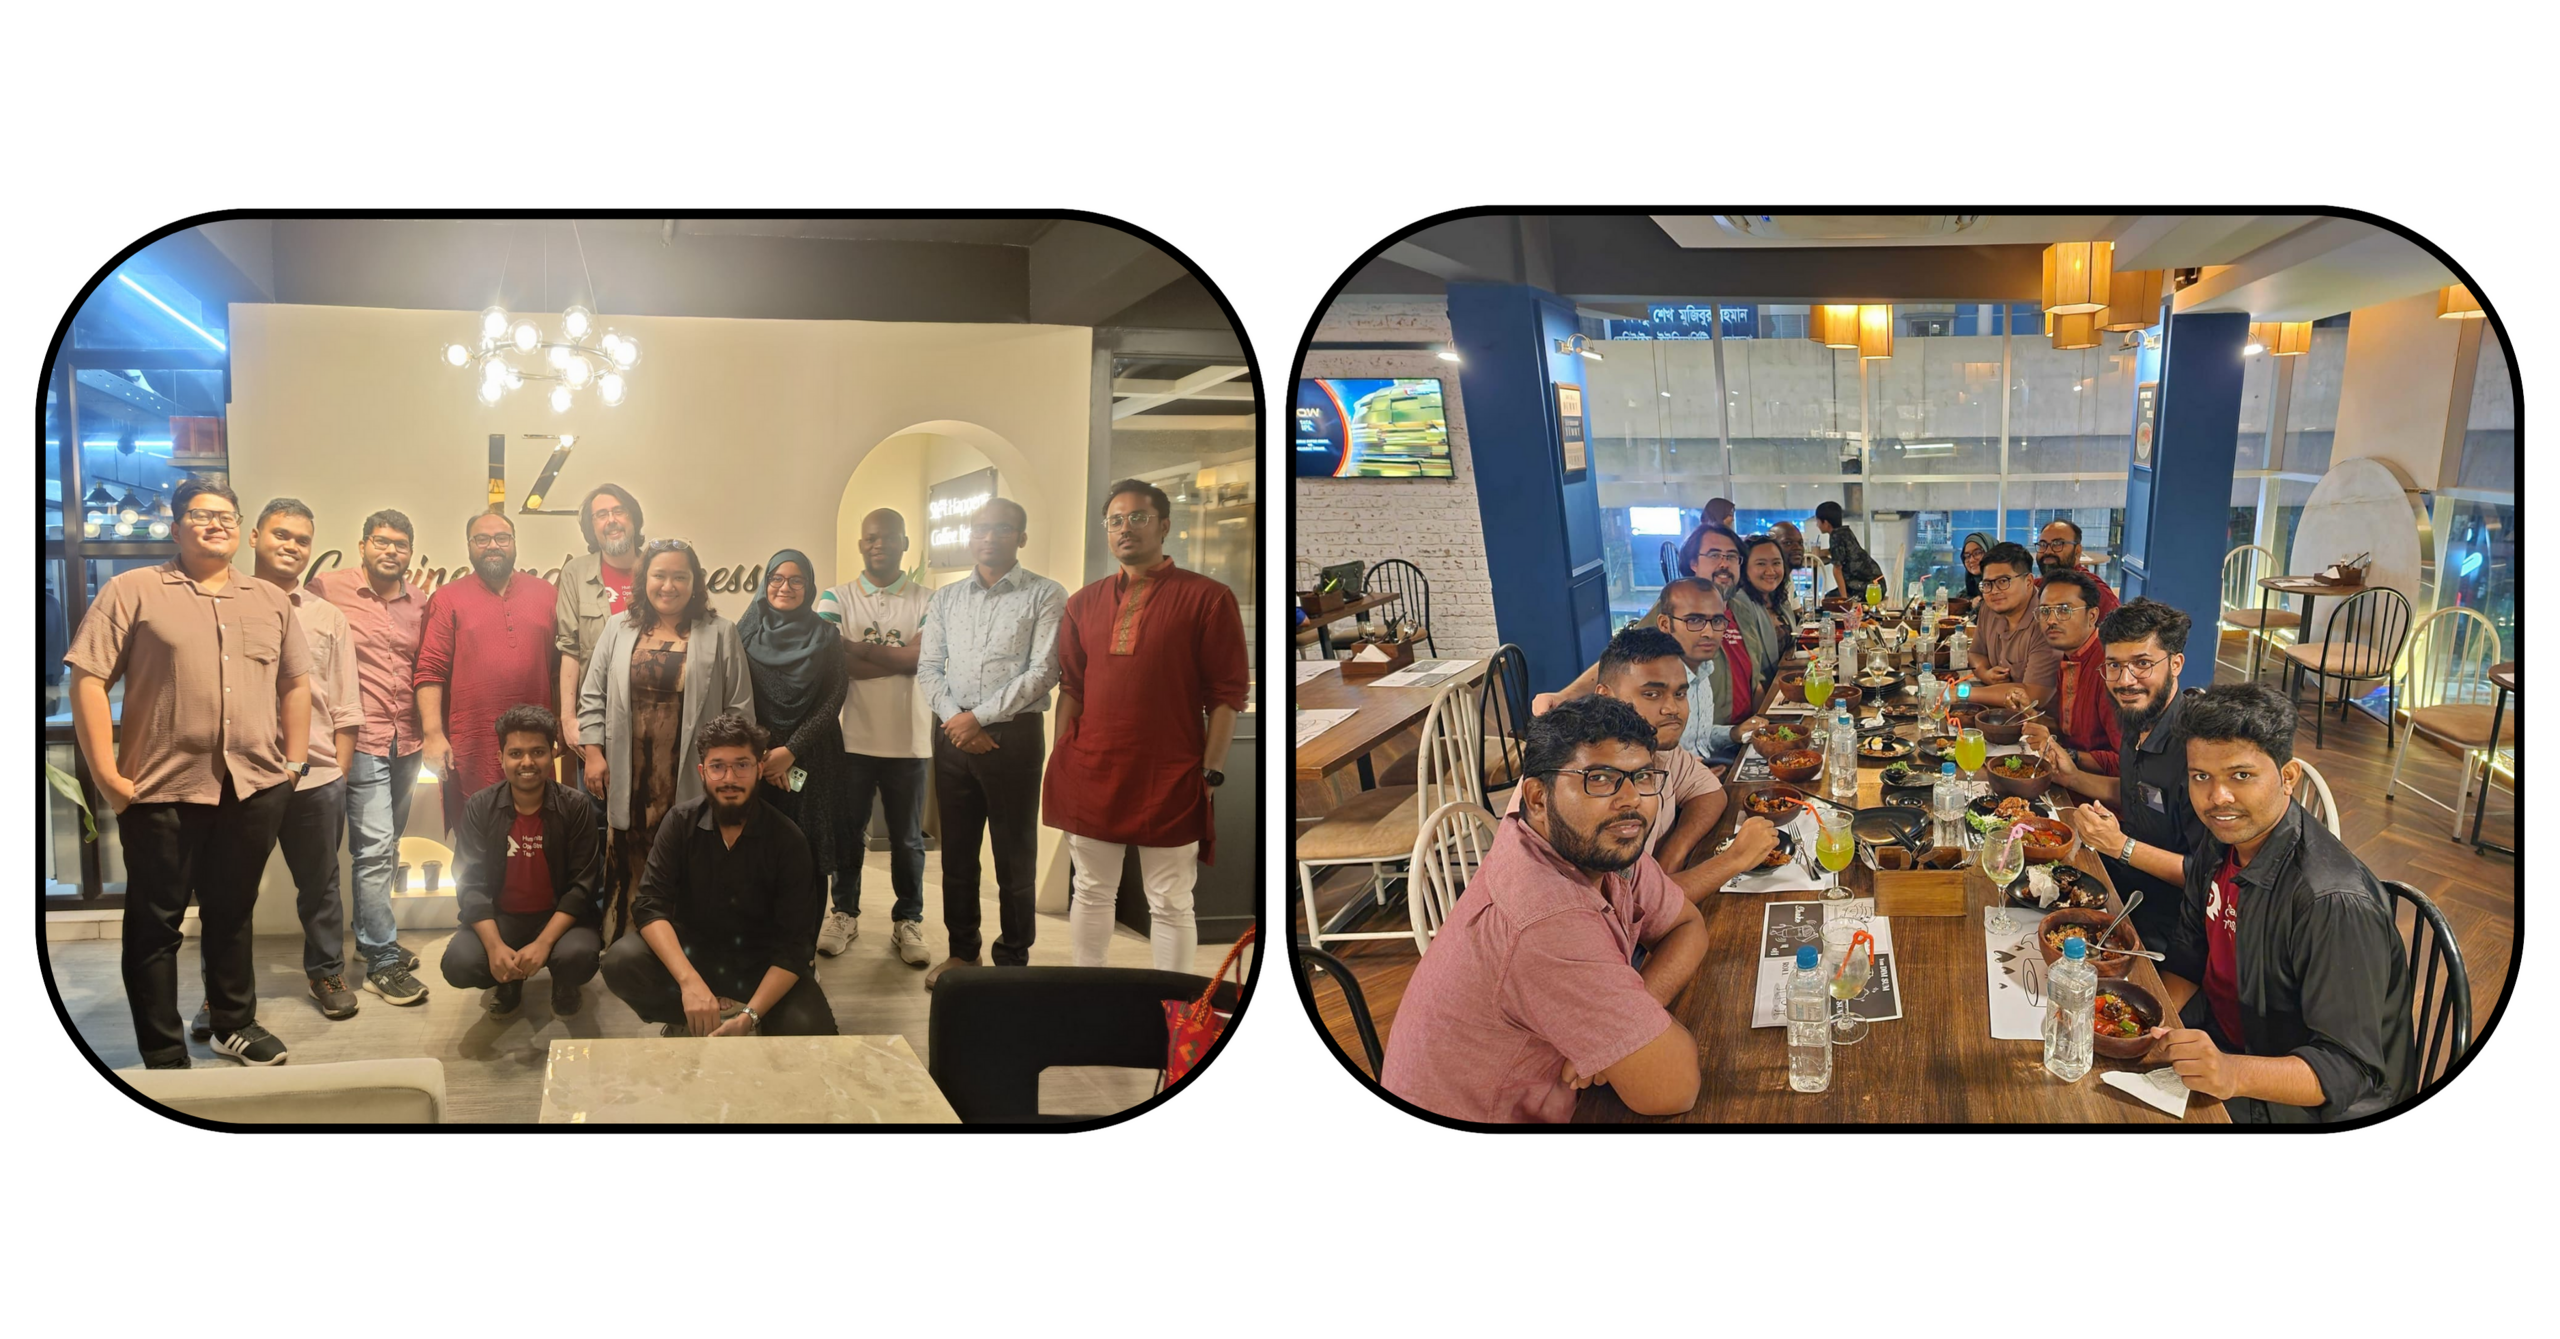 AP Hub members met together and share an Iftar with the Open Mapping Gurus in the OpenStreetMap Bangladesh Community
Now I am going to share some funny moments Which I will never forget. That is our OM guru Khan Mohhamad reached office before me and met with Miss Honey and fun part is that Miss Honey thought that is Brazil. And when I met with Miss Honey, she thoughts that I am Khan. And she started giving me some tasks of ODK. At that moment, we both didn’t know that she didn’t recognize me. So when Harry comes and told that he is mapiliary, Miss Honey is saying, “No, he is Khan, ODK one. Then I told that no, I am Brazil. Then she was laughing and said, then why you agreed to the task. Hahahaha, then I told that I love tasks. And funfact is that before knowing me like when she didn’t know that I am Brazil, we have had lunch togther and discussed so many things. And another moment is when we were in break, Can Unen, challenged me for 8 Ball pool, but the issue was Wi-Fi problem, and we played game togther. Also, I played Mobile legends with Miss Honey. And also so much memory created when we were dicusssing so many things. Soon I am going to launch something better for the OSM community with HOT and Open Mapping Hub.
小林さんに魅力教えていただきました ありがとうございました 今日からコツコツ始めます
Posted by b-unicycling on 29 March 2024 in English.
Last updated on 7 April 2024.
I was lucky enough (or maybe deserving) to have been granted one of the GoPro Maxes sponsored by Meta, a project organised by OSM Belgium - many thanks for that!
I’ve had it for a week now, and I’ve been very busy with it - around 12.643 images captured so far (some nearly duplicates I deleted and some without GPS data I didn’t bother adding it to). I don’t drive, so I only went about on my bike and on foot - so far, but I would like to try it on a car roof at some point.
My first stop was St. Mullin’s in Co. Carlow, a small village, but more importantly early Christian monastic site and National Monument. There is a relatively new bus route (887 Local Link) going there which hadn’t been mapped yet, so I took the bus from Carlow to St. Mullin’s to track the route and bus stops. The bus driver was kind enough to tell me where the bus stops were, because for most of them, they are not signposted. (Trace 1 and Trace 2, if anyone is interested, but the routes are mapped so far) Mapillary shot of bus at Carlow Train Station at unsigned bus stop
Anyways, I walked around St. Mullin’s (named after Saint Moling) and also to the holy well with a selfie stick which was included in the camera package. It looked quite different to last time I visited; the holy well is tidied up and the area around it is a tiny campsite now. Which I have diligently added to OSM, of course.
 You can see the comparison of what was there already and what I added. The bus came in from the North, so it’s a damn shame I couldn’t capture the bus route.
I also discovered a village pump and a public bookcase which I added and will use in a future video, hopefully. The pump, that is.
The rest of the footage is from Kilkenny (city, as the locals like to call it).
 Area covered within the first week, not all of it is available on mapillary yet.
I checked against GoogleStreetView coverage, and I already have a better coverage than they within the area I have surveyed. They’ve left out whole little housing estates and streets. And of course, they rarely cover parks. There seems to have been someone in Kilkenny who did a few footpath shortcuts and parks, but the image quality is not great - portrait format.
Equipment and Usage
The camera came with the “invisible selfie-stick” which you might have come across on Amazon (I know I have), several clips to attach it to the helmet, a helmet strap (of which I already had two for the previous camera, the LG360), a spare battery etc.
I used the selfie stick on the first outing, but since then, I’ve basically only used it on the helmet. I might look silly walking around with it, but I couldn’t care less. I try to have the selfie stick (and I tripod I already owned before) with me at all times, in case I need to take a picture in a shop (with no people in the image) or of a holy well or whatever.
I’m also using the GoPro Quik app to remotely control the camera which might result in quicker battery death, but I find it handy while cycling to stop the capturing sequence, when I’m waiting at a junction for longer or waiting for the bin collection lorry to pass or when I’m cycling along a street I have already captured. It saves me from deleting those images manually.
I’ve used the camera for other purposes as well, like shooting video sequences for upcoming YouTube tutorials - the built-in stabilizer is a revelation compared to my phone shots before. The microphone isn’t too bad either.
Only today, I decided to set the timer to 5sec when walking which leaves me with roughly the same distance between images as there is for 2sec and cycling.
Technical hick-ups
- Irish weather and weather forecast: The weather is very changeable and unpredictable at the moment, so there is no point in planning anything for the next day. Whenever the rain stops, I’m out on the bike. The weather forecast might say that it might rain all day, but then I could end up with 4 hours of almost continuous sunshine. Almost.
- GPS not being recorded: This happens only during the first sequence of the day, even if I wait a little. But I can adjust it using Geosetter, even though that likes to crash, when I’m not very patient. It also happens in building passages and other tunnels, of course, but they’re usually not that long, so I can add or adjust coordinates as well.
Observations
People seem to like parking in what we have mapped as turning circles. Really annoying, because I can’t go to the very end of the street, and I can’t turn easily. People also don’t give a damn about leaving access for bicycles, wheelchairs and other non-pedestrians when parking their cars.
Avoid surveying churchyards on Good Friday. At least I captured that part of Irish culture, I guess.
Beyond the scope
I’ve taken some pics inside businesses where I know the business owner and have asked them, if they are okay with it. I’ve offered to send them the images as well, so they can use them on Facebook or whatever. I will continue doing that, especially in the pubs I play music in, because it just came up with our band how useful it is to have images from inside pubs to give you an idea about the venue. Google StreetView have done that in some pubs already.
Progress link
If you want to follow my progress, this mapillary link should work until 30 April; you’ll have to adjust the date after that.
Publicity
I try to wear by “SURVEYOR” high viz, so at least people can see that I’m a geek with a mission. If they can read it. Some have read “survivor” in the past, which until that point in time is true as well.
I’m also hoping to go on the local radio to talk about the project, so that people might not look at me in too much bewilderment, when they see me with the camera on top of the helmet. Sometimes people wave or stop and smile, but so far, that always happened, when I wasn’t actually capturing.
I am Bayazid Ahmed. I am from Bangladesh. I am studying at the Eastern University of Bangladesh. I am a joint secretary of our chapter, YouthMappers at Eastern University.
A Step Forward in Mapping Together
Hello, OpenStreetMap Community!
We at Mapilio are thrilled to announce a significant update that’s been in the works for some time now — the integration of our imagery layers into OpenStreetMap, available through the iD editor. This collaboration represents a milestone in our ongoing commitment to enhancing the mapping experience for everyone in the OSM community.
 ## Why This Matters
The power of OpenStreetMap lies in its community and the collective effort to create the most detailed, open-source map of the world. By integrating our high-quality imagery layers from Mapilio, we aim to empower mappers with even more tools to enhance accuracy and detail in their mapping endeavors.
Collaboration at Its Best
Achieving this milestone wasn’t a solo effort. It required the collective expertise and dedication of many. We worked closely with Kathleen Lu from the Licensing Working Group (LWG) to ensure that our imagery adheres to all licensing requirements, maintaining the open and free ethos of OSM.
Furthermore, we extend our gratitude to Martin Raifer, whose invaluable contributions have seamlessly integrated our code into the OSM codebase. This integration not only enhances the mapping experience but also solidifies the collaborative spirit of the OpenStreetMap community.
 ## Our Imagery Layers: What You Need to Know
Our imagery layers from Mapilio are now available to all users through the iD editor. This integration ensures that every mapper has access to high-quality, recent imagery, providing a detailed and accurate foundation for mapping activities. Whether you’re mapping remote areas or updating urban landscapes, our imagery offers the clarity and detail needed for precision mapping.
Official Statement and Further Information
For more detailed information about this collaboration and what it means for the OpenStreetMap community, please read our official statement here: Official Statement on Mapilio and OSM Collaboration.
We’re excited about the possibilities this partnership unlocks for the OpenStreetMap community. As always, we are committed to supporting the OSM project and its mission to create a freely accessible and editable map of the world.
We welcome your feedback, questions, and suggestions on our forums or directly through our contact page on the Mapilio website. Let’s continue mapping the world together, one layer at a time.
Happy Mapping!
♪♫ When Girls Just Want To Have Fun ♫♪
On March 23, 2024, as part of the Women’s Month celebration, the Viscan YouthMappers organization conducted a mapping activity titled “MapaBabae: When Girls Just Wanna Have Fun Mapping the Streets Using Mapillary.” This initiative aimed to pave the way for women’s empowerment through mapping, celebrate the contributions of women in the field of mapping, and inspire each other.

It started with an introduction of mine about what the Mapillary is all about which will be used by us by updating the streets of our University Campus that hasn’t been captured last mapillary event. Sharing that Mapillary is a collaborative street-level imagery platform wherein participants in MapaBabae are able to document their journeys and highlight points of interest, and share their stories regarding about this acivity. At its core, MapaBabae is about more than just mapping streets; it’s about creating a community where women feel seen, heard, and valued.
Girls in Action! Divided into three groups with 1 officer as the facilitator of the group then proceed to their assigned areas on the VSU Lower Campus to map using Mapillary. Of course, not forgetting the safety protocols when capturing data and having fun while striding the campus.

After the mapping activity, there is pizza party where participants can share their experiences and discuss their journey as members of the organization. Sharing our own stories behind the movement, the impact we’re making in the community, and the transformative power of mapping technology. As the event concluded, we left with a renewed sense of empowerment and camaraderie, ready to continue our journey of mapping for change and inspiring others to join the movement. So, why should women map?
Simply put, because girls just wanna have fun while making meaningful contributions to their communities. To inspire and be inspired.

Posted by SeverinGeo on 28 March 2024 in English.
English below / Português abaixo
Il y a presque cinq ans, lors du SotM 2019 de Heidelberg, j’avais présenté une analyse critique du concept de mapathon sous le titre de « Mapathon Mapathon Mapathon ». L’historique du concept rappelait combien il s’agissait au début de projets menés sur plusieurs jours, pour devenir ensuite ce que j’ai appelé le mapathon 2.0, une action de cartographie collaborative sur imagerie dans une durée qui s’étend rarement au-delà de deux ou trois heures, avec des objectifs variables, au-delà de la donnée produite : promotion du projet OSM, engagement ou renforcement communautaire. communication sur un projet ou la structure organisatrice de l’événement…
Je ne pense pas que ce format 2.0 ait évolué depuis, mais il y a un aspect que j’avais identifié à l’époque sans pour autant le développer : le mapathon 2.0 en tant que forme privilégiée pour former de nouveaux contributeurs et contributrices OSM.
On pourrait penser qu’il ne s’agit pas d’une rupture avec le passé, mais plutôt d’une suite assez logique de la manière de former de nouvelles personnes à OSM avant l’avènement des smartphones, qui dans mon souvenir se sont démocratisés au Sud à partir de 2015 environ (voir ce graphique de l’International Telecommunication Union). Toute contribution dans OSM se faisait alors forcément en salle, vu que les moyens de collecte sur le terrain (terminaux GNSS classiques type Garmin Etrex ou cartes imprimées de type Walking Papers ou Field Papers) nécessitaient une reprise des données brutes du terrain sur ordinateur avec son éditeur préféré.
Pour autant, cette contrainte technique n’empêchait pas de donner la part belle au terrain pour initier les débutants, si on souhaitait le faire ainsi. La plupart des formations que j’ai pu mener seul ou en collectif depuis 2012, parfois courtes (quelques heures, parfois moins), souvent longues (une semaine consacrée à OSM), commençait le plus souvent ainsi : une introduction à OpenStreetMap suivie d’une première sortie rapide sur le terrain pour collecter des données, éditées ensuite en salle.
Mais sans doute en raison de la commodité d’utilisation d’un projet du Tasking Manager et de la composante de promotion/communication propre au format pour inciter les participants à venir à l’événement et contribuer, le mapathon 2.0 semble désormais le format standard pour former de nouveaux cartographes OSM. Le site web montrant l’activité des chapitres Youth Mappers dans le monde est particulièrement éloquent, même s’il ne présente malheureusement pas de bilan statistique général par type d’objets : il suffit de zoomer à différents endroits et cliquer sur les marqueurs pour se rendre compte que les bâtiments représentent l’écrasante majorité des données produites.
En comparaison, la cartographie de terrain semble rarement la première activité proposée aux personnes qui débutent dans OSM, malgré la diffusion désormais massive des smartphones, avec de nombreuses applications permettant d’éditer directement et facilement dans la base OSM, facilitant d’autant plus les contributions.
Pourquoi donc ne pas plutôt initier les nouveaux contributrices et contributeurs OSM à travers un exercice de cartographie de terrain (ce que certains appellent « carto-parties ») ?
Il y a plein d’avantages à favoriser cette approche :
- Presque tout le monde a un smartphone avec une puce GNSS, mais pas forcément un ordinateur personnel
- Les besoins logistiques (salle, électricité, ordinateurs pour celles et ceux qui n’en ont pas) sont moindres ; il est même envisageable de partager un tutoriel vidéo via les applications de messagerie pour se passer d’une séance introduction en salle avec un vidéo-projecteur, au cas leur disponibilité serait compliquée
- Une fois les applications installées, le volume de données internet est nettement plus réduit dans le cadre de la cartographie de terrain que dans l’édition en salle
- Pour un public novice dans la cartographie, se repérer sur une carte via son positionnement symbolisé par une tache bleue et reconnaître les objets immédiats sur les rendus cartographiques et les imageries satellitaires, est une expérience qui facilite l’apprentissage de la lecture de carte comme celle de l’identification future des objets sur imagerie lors d’un prochain exercice de cartographie en salle
- Il est aisé de coupler la découverte de la contribution OSM sur le terrain avec une application OSM pour la navigation, afin d’offrir une première expérience qui mixe à la fois contribution et réutilisation. Si le temps manque, certaines applications comme Organic Maps ou OsmAnd font justement les deux.
- Si le temps disponible ou les compétences en cartographie des participants sont vraiment limités, StreetComplete est vraisemblablement le moyen le plus simple et efficace de contribuer à OSM
- L’édition directe depuis les smartphones a rendu la cartographie de terrain nettement plus aisée, multiplie les occasions de contribuer et permet de créer un volume de données nettement plus conséquent que par le passé. À titre personnel, j’ai nettement plus contribué à OSM depuis le terrain avec ces applications par rapport à l’époque où je ne disposais que d’un Garmin eTrex
- Si on évite la pluie et les heures chaudes, cartographier sur le terrain est tellement agréable ! L’exercice offre également un point de vue nouveau sur le territoire que l’on parcourt, que l’on observe vraiment
- Dernier point, et non des moindres, il ne faut pas oublier que la donnée la plus cruciale est celle qui n’est pas visible sur imagerie et ne peut venir que du terrain, donc d’une quantité limitée de contributeurs, alors que n’importe quel cartographe OSM peut ajouter depuis son domicile les routes ou les bâtiments n’importe quel endroit du monde à partir de l’imagerie satellitaire
En dehors de ces avantages factuels, cette approche permettrait peut-être d’intéresser d’autres publics, voire de fidéliser plus de monde au sortir de l’activité ?
Si certaines personnes ou communautés ont déjà pris l’habitude de commencer l’initiation à OSM par le terrain, je serais intéressé qu’ils partagent leurs retours d’expérience.
Almost five years ago, at SotM 2019 in Heidelberg, I presented a critical analysis of the mapathon concept under the title “Mapathon Mapathon Mapathon”. The history of the concept reminded us that at the beginning these were projects carried out over several days, and then became what I called mapathon 2.0, a collaborative mapping action on imagery lasting rarely more than two or three hours, with variable objectives, beyond the data produced: promotion of the OSM project, community involvement or reinforcement, communication about a project or the structure organising the event, etc.
I don’t think that this 2.0 format has evolved since then, but there is one aspect that I identified at the time without developing it further: the 2.0 mapathon as the preferred form for training new OSM contributors.
You might think that this is not a break with the past, but rather a fairly logical continuation of the way in which new people were trained in OSM before the advent of smartphones, which to my recollection were democratised in the South from around 2015 onwards (see this graphic from the International Telecommunication Union). At that time, any contribution to OSM had to be made indoors, since the means of collecting data in the field (traditional GNSS terminals such as Garmin Etrex or printed maps such as Walking Papers or Field Papers) required the raw data from the field to be transferred to a computer with the preferred editor.
However, this technical constraint didn’t prevent us from using the terrain to initiate beginners, if we wanted to do it that way. Most of the training courses that I’ve been able to run on my own or as part of a group since 2012, sometimes short (a few hours, sometimes less), often long (a week devoted to OSM), usually began like this: an introduction to OpenStreetMap followed by a quick first outing in the field to collect data, which was then edited in the classroom.
But no doubt because of the convenience of using a Tasking Manager project and the promotion/communication component of the format to encourage participants to come to the event and contribute, the mapathon 2.0 now seems to be the standard format for training new OSM cartographers. The website showing the activity of Youth Mappers chapters around the world is particularly eloquent, even if it unfortunately does not present a general statistical overview by type of object: you just have to zoom in on different places and click on the markers to see that buildings account for the overwhelming majority of the data produced.
In comparison, field cartography rarely seems to be the first activity suggested to people who are new to OSM, despite the now widespread use of smartphones, with numerous applications that make it possible to edit directly and easily in the OSM database, making contributions that much easier.
So why not initiate new OSM contributors through a field mapping exercise (what some people call “mapping parties”)?
There are many advantages to this approach:
- Almost everyone has a smartphone with a GNSS chip, but not necessarily a personal computer.
- The logistical requirements (room, electricity, computers for those who don’t have one) are lower; it’s even possible to share a video tutorial via messaging applications to dispense with an introductory session in a room with a video projector, in case their availability is complicated.
- Once the applications have been installed, the volume of internet data required for field mapping is much smaller than for in-class editing.
- For people who are new to cartography, finding their bearings on a map by means of its position symbolised by a blue spot and recognising immediate objects on cartographic renderings and satellite imagery is an experience that makes it easier to learn how to read a map and how to identify objects on imagery in the future during an indoor cartography exercise.
- It is easy to combine the discovery of the OSM contribution in the field with an OSM application for navigation, in order to offer an initial experience that combines both contribution and reuse. If time is short, some applications like Organic Maps or OsmAnd do just that.
- If participants really have limited time or mapping skills, StreetComplete is likely to be the easiest and most effective way to contribute to OSM.
- Direct editing from smartphones has made field mapping much easier, multiplies the opportunities to contribute and makes it possible to create a much larger volume of data than in the past. Personally, I’ve contributed much more to OSM from the field with these applications than when I only had a Garmin eTrex.
- If you avoid the rain and the hot hours, mapping in the field is so much fun! It also gives you a new perspective on the area you’re covering, one that you can really observe.
- Last but not least, we mustn’t forget that the most crucial data is that which is not visible on imagery and can only come from the field, i.e. from a limited number of contributors, whereas any OSM cartographer can add roads or buildings anywhere in the world from satellite imagery from the comfort of their own home.
Aside from these factual advantages, perhaps this approach would make it possible to interest other audiences, or even to retain more people once the activity is over?
If some people or communities have already got into the habit of starting their introduction to OSM in the field, I’d be interested to hear from them.
Translated with DeepL.com (free version)
Há quase cinco anos, no SotM 2019 em Heidelberg, apresentei uma análise crítica do conceito de mapathon sob o título “Mapathon Mapathon Mapathon”. A história do conceito recordou-nos que, no início, eram projetos realizados ao longo de vários dias, e depois tornaram-se naquilo a que chamei mapathon 2.0, uma ação de mapeamento colaborativo sobre imagens que raramente dura mais de duas ou três horas, com objetivos variáveis, para além dos dados produzidos: promoção do projeto OSM, envolvimento ou reforço da comunidade, comunicação sobre um projeto ou a estrutura que organiza o evento, etc.
Não creio que este formato 2.0 tenha evoluído desde então, mas há um aspeto que identifiquei na altura sem o desenvolver mais: o mapathon 2.0 como forma preferencial de formação de novos contribuidores OSM.
Poderá pensar-se que não se trata de uma rutura com o passado, mas antes de uma continuação bastante lógica da forma como novas pessoas eram formadas em OSM antes do advento dos smartphones, que, tanto quanto me lembro, foram democratizados no Sul a partir de cerca de 2015 (ver este gráfico da International Telecommunication Union). Nessa altura, qualquer contribuição para o OSM tinha de ser feita dentro de casa, pois os meios de recolha de dados no terreno (terminais GNSS tradicionais como o Garmin Etrex ou mapas impressos como o Walking Papers ou o Field Papers) exigiam que os dados em bruto do campo fossem transferidos para um computador com o editor preferido.
No entanto, esta limitação técnica não nos impedia de utilizar o terreno para iniciar os principiantes, se assim o desejássemos. A maior parte dos cursos de formação que pude realizar sozinho ou em grupo desde 2012, por vezes curtos (algumas horas, por vezes menos), muitas vezes longos (uma semana dedicada ao OSM), começavam normalmente assim: uma introdução ao OpenStreetMap seguida de uma primeira saída rápida ao terreno para recolher dados, que eram depois editados na sala de aula.
Mas, sem dúvida, devido à conveniência de usar um projeto Tasking Manager e à componente de promoção/comunicação do formato para encorajar os participantes a vir ao evento e contribuir, o mapathon 2.0 parece agora ser o formato padrão para a formação de novos mapeadores OSM. O site que mostra a atividade dos capítulos Youth Mappers em todo o mundo é particularmente eloquente, mesmo que infelizmente não apresente uma visão estatística geral por tipo de objeto: basta fazer zoom em diferentes locais e clicar nos marcadores para ver que os edifícios representam a esmagadora maioria dos dados produzidos.
Em comparação, o mapeamento de campo raramente parece ser a primeira atividade sugerida a pessoas que são novas no OSM, apesar da utilização agora generalizada de smartphones, com inúmeras aplicações que permitem editar direta e facilmente na base de dados OSM, tornando as contribuições muito mais fáceis.
Então, por que não iniciar novos colaboradores do OSM através de um exercício de mapeamento de campo (o que algumas pessoas chamam de “mapping-parties”)?
Há muitas vantagens em encorajar esta abordagem:
- Quase toda a gente tem um smartphone com um chip GNSS, mas não necessariamente um computador pessoal.
- Os requisitos logísticos (sala, eletricidade, computadores para quem não tem) são menores; é até possível partilhar um vídeo tutorial através de aplicações de mensagens para dispensar uma sessão introdutória numa sala com um projetor de vídeo, caso a sua disponibilidade seja complicada.
- Uma vez instaladas as aplicações, o volume de dados da Internet é muito menor para o mapeamento no terreno do que para a edição em sala de aula.
- Para os principiantes em cartografia, orientar-se num mapa através da sua posição simbolizada por uma mancha azul e reconhecer objectos imediatos em representações cartográficas e imagens de satélite é uma experiência que facilita a aprendizagem da leitura de um mapa e a identificação de objectos em imagens no futuro, durante um exercício de cartografia em ambiente fechado.
- É fácil combinar a descoberta da contribuição OSM no terreno com uma aplicação OSM para navegação, de modo a oferecer uma experiência inicial que combine contribuição e reutilização. Se o tempo for curto, algumas aplicações como Organic Maps ou OsmAnd fazem exatamente isso.
- Se o tempo ou as competências cartográficas dos participantes forem muito limitados, o StreetComplete é provavelmente a forma mais simples e eficaz de contribuir para o OSM.
- A edição direta a partir de smartphones tornou o mapeamento no terreno muito mais fácil, multiplica as oportunidades de contribuição e torna possível criar um volume de dados muito maior do que no passado. Pessoalmente, contribuí muito mais para o OSM a partir do terreno com estas aplicações do que quando tinha apenas um Garmin eTrex.
- Se evitarmos a chuva e as horas de calor, mapear no terreno é muito divertido! Também nos dá uma nova perspetiva sobre a área que estamos a percorrer, uma perspetiva que podemos realmente observar.
- Por último, mas não menos importante, não podemos esquecer que os dados mais importantes são aqueles que não são visíveis nas imagens e que só podem vir do terreno, ou seja, de um número limitado de colaboradores, ao passo que qualquer cartógrafo OSM pode acrescentar estradas ou edifícios em qualquer parte do mundo a partir de imagens de satélite, a partir do conforto da sua própria casa.
Para além destas vantagens factuais, talvez esta abordagem permita interessar outros públicos, ou mesmo reter mais pessoas depois de terminada a atividade?
Se algumas pessoas ou comunidades já adquiriram o hábito de iniciar a sua introdução ao OSM no terreno, gostaria de saber a sua opinião.
Traduzido com DeepL.com (versão gratuita)
The Magdalen Islands (Îles-de-la-Madeleine) are an archipelago located in the center of the Gulf of Saint Lawrence (Eastern Canada). The heart of the archipelago is made up of seven rocky islands connected by long sand barriers, sand spits, dunes, and salt marshes. Including internal lagoons, the islands cover about 330 square km. The archipelago is sparsely populated and counts about 12K permanent inhabitants.
In June 2023, OSM describes the islands’ coastline, road network, some trails as well as some human and natural features. Overall, the islands were mapped using about 56K nodes, 5K ways, and 116 relations (Figure 1).
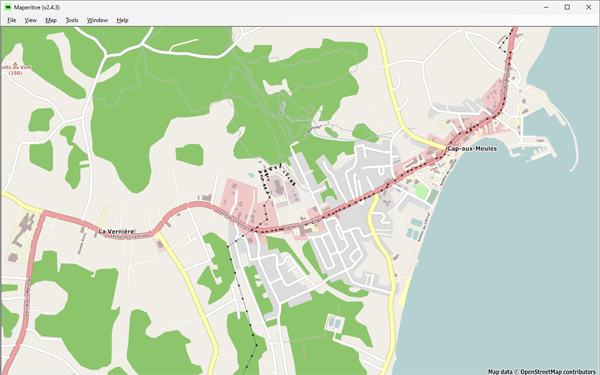 Figure 1: Cap-aux-Meules, before starting the project—Historical OSM data as of June 30, 2023, on Maperitive.
It was after traveling to the Magdalen Islands on vacation that I set out to update the OSM map. Upon my return, and over a 9-month period, I edited the existing OSM content, correcting geometries and adding as many features as I could, using local knowledge and available images (Figure 2).
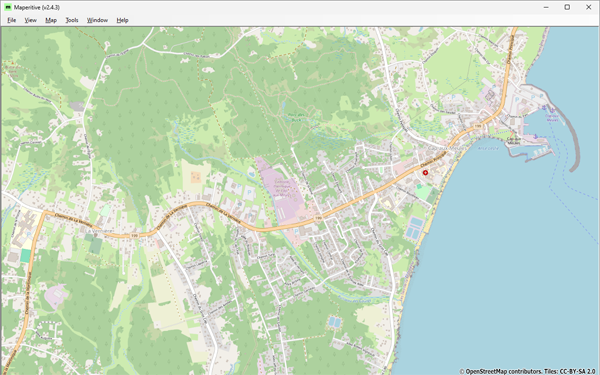 Figure 2: Cap-aux-Meules, at the end of the project—OSM data as of February 28, 2024, on Maperitive.
Once completed, I had increased the number of nodes and ways by 10 folds, the number of relations by 30. All this did not happen without a lot of work, questions, and sometimes big surprises! Here is a summary of what I did.
Fieldwork Prior to Image interpretation
We were several friends visiting the islands together. Everyone knew I was collecting data for mapping in OSM and, as usual, some were teasing me when I was moving around tagging features with a GPS! With their help, I was able to bring together a wide range of islands’ landscapes from photos and videos we all took during our stay (Figure 3). In addition to photos, videos, and GPS tracks, I also accumulated receipts for my purchases, which gave me the names and addresses of some businesses and stores I visited.
 Figure 3: View of the Cap-aux-Meules Nautical Club from a nearby observation point.
During my stay, I paid attention to landscapes I was unfamiliar with, particularly sand dunes and vegetation (Figure 4). I also had a look at buildings and their distribution outside the urban environment. On the other hand, the coastline and associated infrastructure did not pose any interpretation problem as I am familiar with coastal environments. In this context, the islands tide magnitude (about a meter) just simplified the delimitation of the coastline at MHWL.
 Figure 4: Informal hiking trail toward L’Étang-du-Nord (Îles-de-la-Madeleine) showing islands’ typical vegetation.
GPS Tracks and Images Adjustment
In addition to GPS tracks from OpenStreetMap, I used those from Strava Global Heatmap (SGH). This was a great discovery! SGH is an image of Strava users GPS tracks density that can be used with OSM. The number of users (e.g., cyclists, runners) who traveled the islands is so large that it allowed me to adjust the geometry of most of the road network and main hiking trails. SGH is available in JOSM via a plugin for Chrome and Firefox browsers. However, aligning satellite images with the SGH can be difficult when it obstructs the road network visibility (Figure 5). To overcome the problem, I first adjusted the road network and main hiking trails on the SGH, then aligned the images to those roads/trails. This alignment was particularly useful in areas with rolling topography.
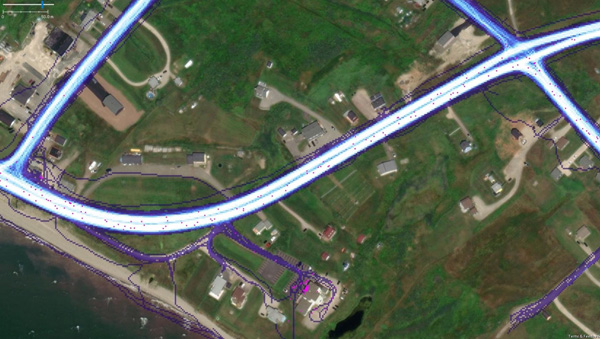 Figure 5: Overlay of Strava Global Heatmap (SGH) and GPS tracks from OSM (pink dots) on Esri World imagery (Havre-aux-Maisons, Îles-de-la-Madeleine).
Available Satellite Images
All available images are generally well georeferenced. However, except for Sentinel-2, I could not find details on the orthorectification process or what type of digital elevation model was used, if any. Without using it (i.e., DEM or DSM) the images are distorted where there are changes in ground elevation and the effect increases with the viewing angle. Each following image was used, according to its characteristics.
Esri World Imagery: The primary image used. The most recent one except for the eastern end of the islands. Probably taken after the storms of 2019 or Hurricane Fiona in 2022. The viewing angle is not negligible, causing distortions on buildings and around cliffs.
Mapbox Satellite: An almost vertical image that shows little distortion. The image is clear but older than that of Esri World.
Bing Aerial Imagery: The image seems older than the other ones but is of better quality for the western part of the islands. Unfortunately, its resolution over the eastern end made it useless.
Sentinel-2: I used a Sentinel-2 image from summer 2023 as a validation data source. Its resolution is low, but it allowed me to locate some large recent features seen in the field.
Mapping Process
I chose to carry out my project using JOSM. I’ve been using the software for a while, which offers several tools that I consider essential.
Keeping Track of Mapped Areas
For mapping projects of this scale, I keep track of which areas have been mapped as well as the one in progress in a dedicated .osm file. Both areas are delineated using different tags (Figure 6). In order to prevent accidental uploads, I add the attribute upload=never to the header.
Where possible, the working area is small and its boundary easily visible on the ground (e.g., roads). When completed, the current working area is joined to the mapped area polygon, and the next working area is delineated.
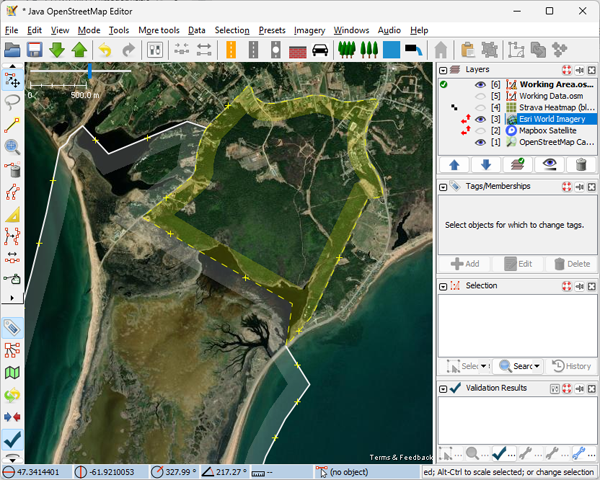 Figure 6: The map production tracking layer, with mapped area (white) and current working area (yellow).
Iterative Data Capture Operations
I generally use the same sequence of operations to map all the features I’m interested in. My main interest is to “put colors on the map”, but my priority is to fit the images on available GPS track when required. To make both easier, I divide my edits into the following steps:
- Download OSM data for a working area.
- Align images to available GPS tracks.
- Map a subset of features on a temporary layer.
- Merge the layer with OSM data once completed.
- Run the Validator to detect and fix errors.
- Upload the data to OSM.
- Back to step three unless everything is mapped!
Some of above steps need further explanations. In step 1, The OSM data layer is saved as a file since a working area can take several days to complete. In step 2, aligning images using Strava Global Heatmap required first adjusting the geometry of the existing transportation network to the SGH (Figure 5), and then aligning each image to the network. In Step 3, dividing map features into thematic subsets made it easier to track which features are mapped and which need to be mapped (see next section). When an existing feature needs an update, it may be easier to capture it again on the current layer and merge them later. In step 5, among the errors will appear as duplicate or overlapping features those that were capture again for an update. I strongly suggest to use the ReplaceGeometry tool to do this (Figure 7). It allows us to replace the previous geometry with the new one, while retaining tags, feature history, and nodes. It is a way to acknowledge the work done by the previous contributors.
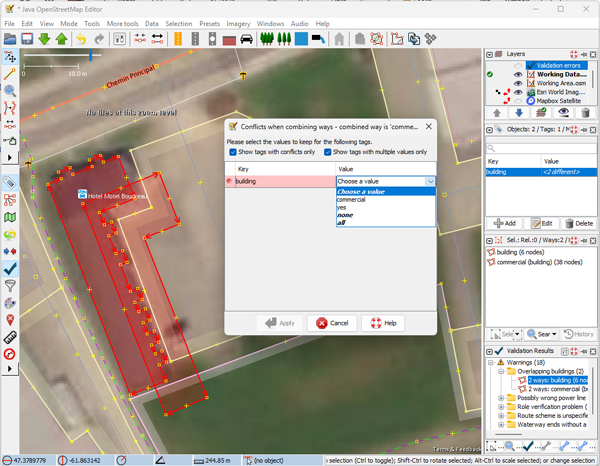 Figure 7: Replacing an existing feature with the new version using the ReplaceGeometry tool.
Hierarchy in Mapped Features
The diversity of OSM’s content reflects the diversity of interests of its contributors. Since mine is to “put colors on the map”, it implies a feature hierarchy that roughly prioritizes features based on their size. However, dividing map features into thematic subsets also depends on how I map them.
When delineating adjacent polygons, which was the case most of the time, I clearly prefer to connect multiple line segments (ways) into multipolygons rather than duplicating these segments in closed ways. I find it more efficient this way. Consequently, the map features included in each thematic subset were mainly selected based on their topological relationships.
The order in which thematic feature subsets have typically been mapped is:
- Coastline
- Bare coastal lands
- Natural features
- Land use
- Buildings and amenities
- Service roads, tracks, and trails
Each subset presents different challenges. Here is the subsets characteristics.
Coastline: Mapping coastline is a bit different than with other features (e.g., drawing direction). So, working on this feature alone helped me do it right. Another reason was that since the coastline is longer to render on the map, the sooner I did it, the sooner I was able to see the results with adjacent features.
All the images used to update the coastline were older on the eastern end of the islands. Browsing the results with a much recent Sentinel-2 image, I was surprised to see differences of up to 400m between the updates I made and what appears to be its current position (Figure 8). I knew the coastal dynamics were important there, but I didn’t expect such a difference. I will probably adjust the coastline in a future update unless another contributor has already done so.
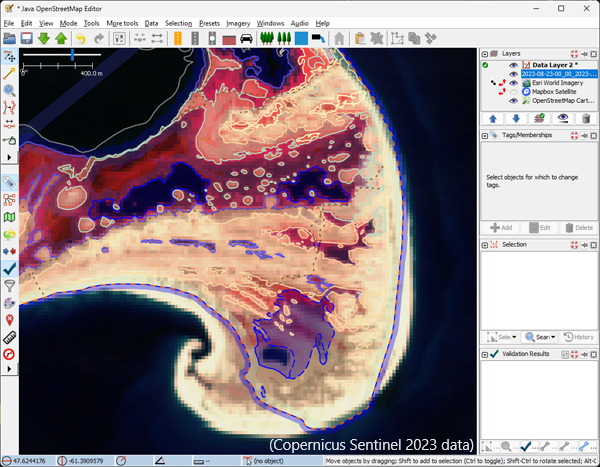 Figure 8: Updated OSM data overlaid on a recent Sentinel-2 image shows differences of up to 400 meters between shoreline locations (Copernicus Sentinel 2023 data)
Bare coastal lands: These features fall into two categories. Features at sea level such as beaches or breakwaters, and features overhanging the coastline such as bare rocks, screes, and cliffs. These overhanging features often required using the Mapbox image to avoid significant distortions due to elevation changes.
Natural features: Islands’ natural landscape consists mainly of grasslands with large patches of forest and wetlands. Long beaches, sand barriers and dunes connect the islands together, creating large lagoons. So, traveling around the islands and hiking a few trails was necessary to later interpret this complex set of features (Figure 9).
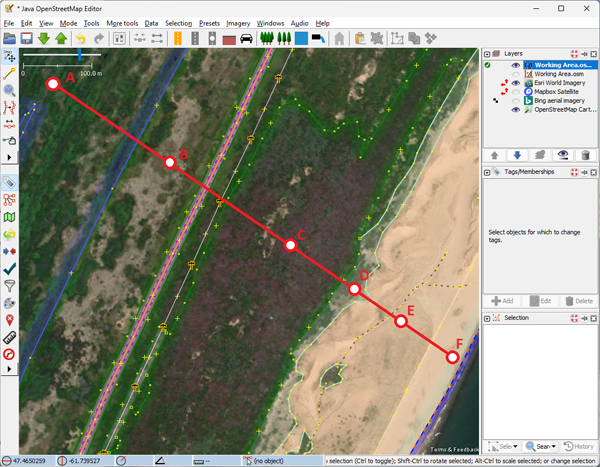 Figure 9: Adjacent natural features (A-F): string bog, scattered shrubs, stunted wood, grassland, sand dunes, beach.
I identified five types of vegetation: grasslands, heather, shrubland, wetlands and woodland; Forest is mostly made up of evergreen needle leaved vegetation. Tree heights vary greatly depending on their location, ranging from normal inland to stunted trees on hilltops and near the coast. Identifying wetland types was also difficult and often like dividing shades of gray into categories. I nevertheless assigned a wetland=* tag value to all of them, including on some string bogs. However, these string bogs, as well as most inland salt marshes, were fossilized landforms (i.e., no longer active). It was the same for the sand dunes system, although I didn’t try to map the landform. While active dunes were easy to identify, it was difficult to choose whether to tag them as sand, or grasslands as the vegetation was taking over. Finally, most water bodies were already mapped and therefore only needed some adjustments to their shore and tags. Some closed (or almost closed) bodies of water were converted from “coastline” to “lagoon”.
Land use: This feature subset included both the usual landuse=* tag values as well as parking lots. Farmland is the main land use I identified, although I was only able to find a few farmyards. Next come the residential areas, then the industrial ones. The largest industrial complex on the islands is the Cap-aux-Meules thermal power plant, followed by the Seleine salt mine.
Buildings, service roads, tracks, and trails: I mapped the buildings in two iterations. I first used Mapbox for buildings’ geometry, as its near-vertical viewing angle minimized distortions. I then used Esri World to update the result since the image was more recent. In doing so, I found many buildings that had disappeared, in the meantime, especially near the coast. Browsing local newspapers, I discovered that most of them had been destroyed in severe storms over recent years. To make sure other mappers would not map them again using older images, I kept them in the database while using a life cycle prefix to turn them off on the map (Figure 10). Outside of urban areas, most family housing units consist of a detached house, a garage, and a shed. These units are generally dispersed across the landscape and connected to the road network by long driveways.
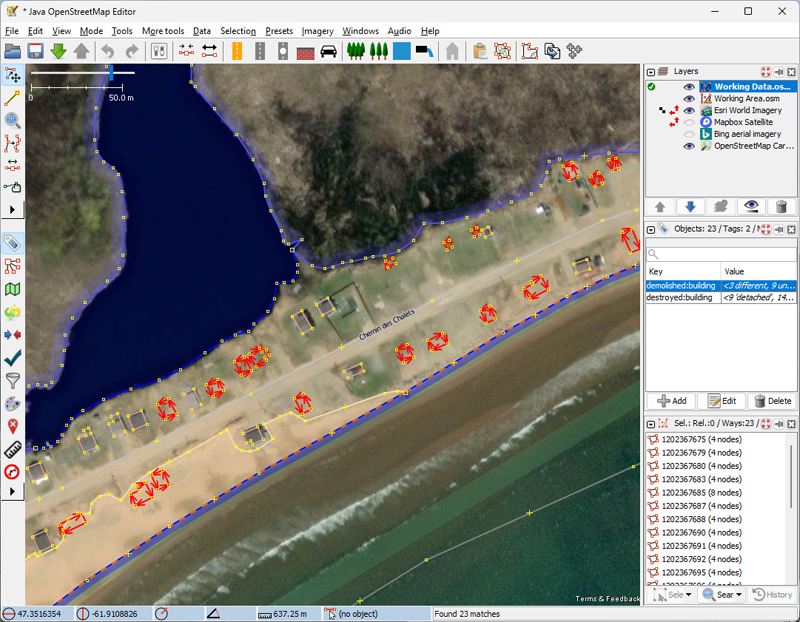 Figure 10: Destroyed/demolished buildings after recent severe storms (in red). Esri World image (Îles-de-la-Madeleine).
I complete my mapping with tracks and trails, which have little topological relationship with the previous features. There is an extensive track network on the islands, most related to farming or tourism (including all-terrain vehicles). Due to islands ground characteristics, it is difficult to know whether these tracks contain compacted material or not, without going through each one. So, when in doubt, I assumed they did not (i.e., tracktype=grade5). As for the trails, it seems I was preceded by a few OSM contributors. None of the trails I walked through were missing, so I just had to adjust a few of them to fit SGH data.
Thoughts About the Project
This was my longest mapping project, and I learned a lot from mapping such a diversity of natural map features. Here are my thoughts about what went right, should be done differently, and could have helped.
What went right: Obviously, most of the mapping went right. My crush is having discovered the Strava Global Heatmap (SGH). After using OSM’s GPS tracks for years, I was blown away by the volume of tracks found in SGH, their display (i.e., data density), and ease of use in JOSM. From now on, I will continue to use SGH for all my mapping projects, both to adjust images when necessary, and to find/confirm the locations of popular hiking trails.
The next thing is to have kept track of mapped areas (via a dedicated file) and features (via iterative data capture). It really simplified my work. I could have mapped one feature at a time over all the islands, but the pleasure of seeing the map get colored, one patch at a time, motivated me to continue.
Finally, I will keep using life cycle prefixes when required. This allowed me to remove buildings from the map while keeping them in the database. Until all images tell the same story, it may prevent other mappers from capturing them again by using older images.
What should be done differently: My main concern is that in my eager to map, I have started merging identical natural features into single multipolygons, for efficiency. As all these features were going to be set as multipolygons anyway, it was faster to proceed that way than to create a new multipolygon, duplicating tags, and so on, for each individual occurrence. One could argue it all depends on what a multipolygon relation represents. An isolated feature? All the occurrences of a feature in a specific context (e.g., the wooded areas of a nature reserve)? If for some instances, I would do the same (Figure 11), I am quite sure I could not use this argument for many others.
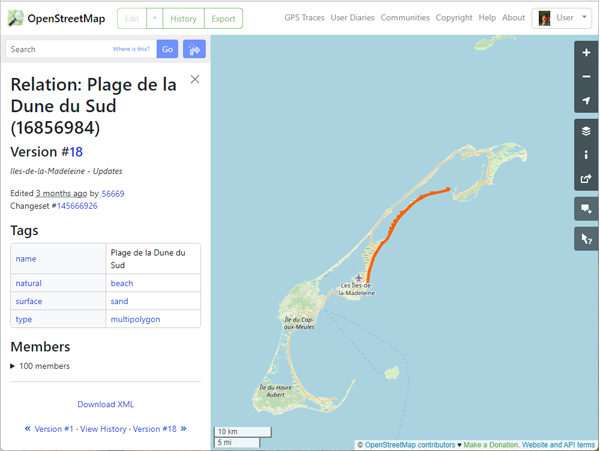 Figure 11: Plage de la Dune-du-Sud (Îles-de-la-Madeleine). The beach is mapped as a 22 km long multipolygon.
As far as I know, there is no consensus within the OSM community as to the best way to map adjacent polygons. I prefer using multipolygons rather than duplicating common line segments of adjacent polygons. However, the downside of using multipolygons is that it can be more difficult for new contributors to modify them. Having multiple outer rings spread around for a feature, unless really required, can only make things worse. I’ll probably try to fix the worst cases manually over the next few months.
Another thing I should have done differently is to use Sentinel-2 imagery in a first iteration to map the coastline. I would have kept the location of the coastline and adapted my mapping using older available images in a second iteration (Figure 8). These older images are probably just fine around cliffs/rocky shores, but Sentinel-2 data should have been used where coastal dynamics is important (i.e., erosion and deposition).
What could have helped: Image metadata would make it easier to decide which image to use. Without knowing about the recent storms and seeing their impacts on the ground, I probably would have used Mapbox Satellite instead of Esri World. The same goes for the eastern end of the islands where I could not identify which was the most recent image.
What is next: I just hope to return to the Îles-de-la-Madeleine soon for another vacation!

Posted by Supaplex on 28 March 2024 in Chinese (Taiwan) (中文(台灣)).
藉由 TomTom 台灣辦公室牽線,由他們成大測量系系友去洽談,再加上 OpenStreetMap Taiwan 申請社群的 Tasking Manager 管理權限,能夠新增適合本地進行的專案,才有此次的機會前往成大進行 OpenStreetMap 圖客工作坊,並且用 Tasking Manager 來分配繪製台灣本地圖資。
- 專案連結:https://tasks.hotosm.org/projects/16316
- 簡報連結:https://hackmd.io/@osm-tw/HJJqv7HC6#
- OSMCha 連結:學生的編輯監控
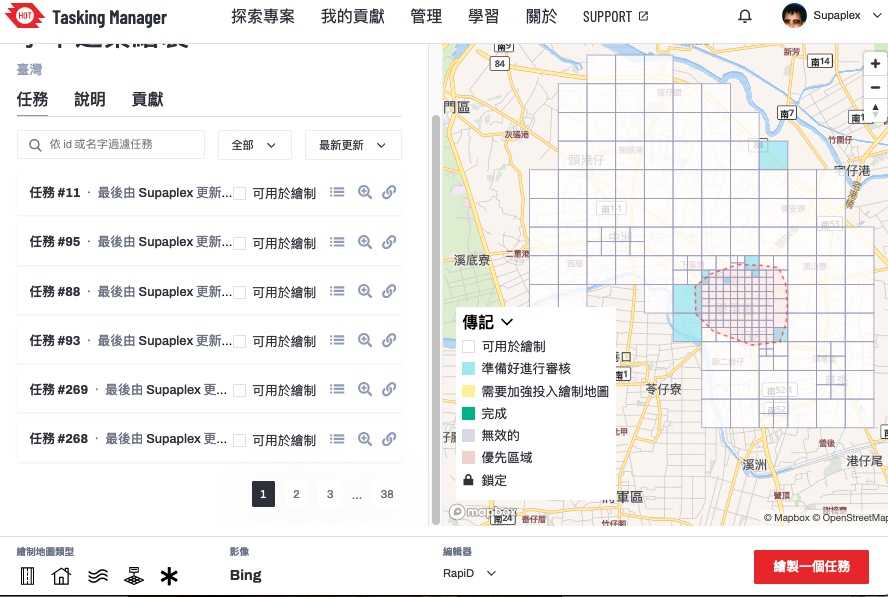 ▲ Tasking Manager 的專案,本次要繪製的範圍台南學甲區
本次成大圖客松截至 3/26 共計 107 個編輯變動,29 個工作人員的編輯變動,3個社群朋友的編輯變動,22 位學生投入編輯總共有 75 個編輯變動,設定繪製目標的建築,總共畫出 369 棟。
學生實際動手之後,投入狀況還不錯,先介紹他們 OpenStreetMap 的基礎知識,再來知道資料怎麼產生,最後自己動手來做。由於整體時間只有一個半小時,並不太夠,除非選到比較郊區的任務,不然連一塊當中的建築都畫不完。
這次邀請方是成大測量系,與老師聊天時,他們蠻常運用 OpenStreetMap 資料,然後社群部分跟早年的 OpenStreetMap 台灣社群活躍者 Dongpo 比較熟,與 OpenStreetMap 相關認識是從 Dongpo 來的,也蠻合理的,因為 Dongpo 是相同空間資訊學科背景的。
 ▲ 台南成大在 OpenStreetMap 上面畫得相當詳盡
之前已經由社群資深成員把過大的土地利用拆解處理,這是先前台南土地利用的歷史遺留問題。社群朋友建議可以教關掉特定圖徵。我的回應是如果要畫台南市東區或是中南區我會關掉,但學甲的資料量還好,要畫的時候要放大,應該不至於不小心把地址點位合併掉。
先前討論工作坊要實作的內容,有想到用 MapRoulette 的任務,但一來解微型任務太技術與資料導向,學生可能不明白在做什麼,二來是 MapRoulette 網站太不穩定了,上次 OSMF Board meeting Martijn van Exel 還有上去報告,打算請求 OSMF 資源協助。到時候如果真用 MapRoulette 有可能遇到網站掛了。
後續任務的話,還是要請台灣社群的大家抽空畫畫,因為工作坊參與者再次編輯比率沒有很高。學生太多好玩的事情可以做了。目前在 OpenStreetMap Taiwan 下面有四個畫地圖專案,之後再試情況再多開 HOT Tasking Manager 專案來處理台灣特定地方資料,敬請期待。
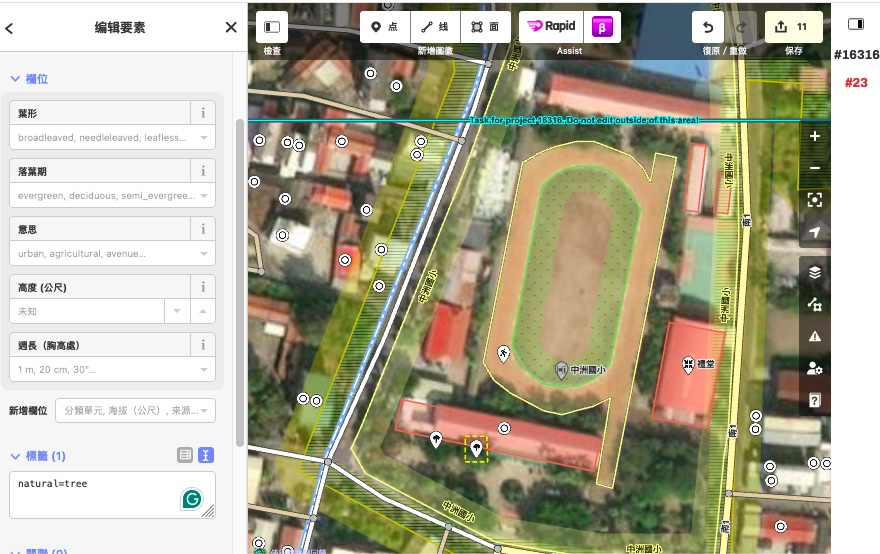
另外要回饋 HOT 這邊的狀況,他們的訓練 HOT Tasking Manager 管理員的線上操作教學蠻不錯,而且加入 HOT 的 Slack 之後,也能隨時去反應問題與交流狀況。不過盡管台灣社群處理 iD 編輯器與 HOT Tasking Manager 翻譯都有持續隨新字串加入翻譯成台灣華語,但是在 HOT 實作的 iD 編輯器與 Rapid 編輯器,判斷裝置的語言出錯,變成 zh 的,導致該出現的 zh-tw 翻譯字串沒出現。在上工作坊時,只能跟台下同學解釋,社群都有翻譯,不是故意要出現簡體字,要再跟 HOT 反應介面語言呈現的技術問題了。
另外也想要爭取在其他學校,不論是大學還是高中,能由社群朋友進去帶幾堂課程,以真實 OpenStreetMap 社群運作方式去帶新手,例如像這次成大工作坊用 Tasking Manager 分配任務來繪製。不然先前只會在台灣這邊的編輯歷史列表當中,看到大量以學校為中心繪製 OpenStreetMap 的狀況,但帶頭的老師認識不深的狀況下,學生繪製的狀況落差相當大,如果學生人數多時,很容易出現問題編輯狀況,社群看到出現問題被動處理。這時候如果有 OpenStreetMap 社群成員在旁提醒與指導,第一時間避免問題編輯,避免出現必須移除或回退資料的情形。
not been lazy but busy with so many other things, but got suddenly a new JOSM install fit for use an got catched for a few hours by now: I read some old wiki docs from 2008/09 i. e. the pilot work for Karlsruhe house number tagging schema in our town, added a few obviously missing objects, peeked into current issues nearby on Osmose did some corrections - all that feels good, this might even start a new series of contributions. :-)
Overpass Turbo Query
10 examples of overpass queries to be used in Openstreetmap

Exemplos OVERPASS
• PTo query objects in another municipality, use this part of the query in red to change the name of the Municipality and state and you will have a search for objects in your location. • for a search by neighborhood, enter the name of the neighborhood and the city of the search
“Exemplo”
[out:json][timeout:25]; // fetch area “Terceira” to search in {{geocodeArea:campos dos goytacazes,rj}}->.searchArea; // gather results
Consulta de Ilha
[out:json][timeout:180]; area [‘ISO3166-2’ = ‘BR-PA’][admin_level=4] (area.a) -> .uf; nwr [place~”islet|island|archipelago”][name] (area.uf); out geom;
Consulta de Escolas em Município
[out:json][timeout:25]; // fetch area “Terceira” to search in {{geocodeArea:campos dos goytacazes,rj}}->.searchArea; // gather results ( // query part for: “amenity=school” node“amenity”=”school”; way“amenity”=”school”; relation“amenity”=”school”; ); // print results out body; >; out skel qt;
https://overpass-turbo.eu/s/1J8l
Consulta de Posto de Saúde em Município;
[out:json][timeout:25]; // fetch area “Terceira” to search in {{geocodeArea:campos dos goytacazes,rj}}->.searchArea; // gather results ( // query part for: “amenity=clinic” node“amenity”=”clinic”; way“amenity”=”clinic”; relation“amenity”=”clinic”; ); // print results out body; >; out skel qt;
https://overpass-turbo.eu/s/1J8L
Consulta de Nomes de Rua Residencial sem nome por Bairro;
[out:xml][timeout:25];
{{geocodeArea:Parque Doutor Beda,Campos dos Goytacazes}}->.searchArea; ( way[“highway”=”residential”]“name”!~”.*”; ); out meta; >; out meta qt;
https://overpass-turbo.eu/s/1J8n
Consulta de Rua sem nome em toda a cidade – “Essa pesquisa consulta todos os tipos de de Estradas” “Rua, Avenida Primaria, secundaria e terciaria”
[out:xml][timeout:25]; {{geocodeArea:Campos dos Goytacazes,RJ}}->.searchArea; ( way[“highway”~”unclassified|residential|tertiary|secondary|primary”]“name”!~”.*”; ); out meta; >; out meta qt;
https://overpass-turbo.eu/s/1J8v
Consulta de Igreja
[out:json][timeout:25]; // fetch area “Terceira” to search in {{geocodeArea:campos dos goytacazes,rj}}->.searchArea; // gather results ( // query part for: “amenity=clinic” node“building”=”church”; way“building”=”church”; relation“building”=”church”; ); // print results out body; >; out skel qt;
https://overpass-turbo.eu/s/1J8O
Consulta de CEP em Ruas de um Bairro
[out:xml]/fixed by auto repair/[timeout:50]; {{geocodeArea:Cohab,Recife}}->.searchArea; ( way“postal_code”; ); out meta; >; out meta qt;
https://overpass-turbo.eu/s/1J8R
Consulta de Ruas sem CEP em Cidade
[out:xml][timeout:25]; {{geocodeArea:cavaleiro,jaboatão}}->.searchArea; ( way[“highway”=”residential”]“postal_code”!~”.*”; ); out meta; >; out meta qt;
https://overpass-turbo.eu/s/1J8S
Consulta de CEP fora do Padrão Brasileiro “XXXX-XXX” para Correção
[out:xml][timeout:900]; {{geocodeArea:Jaboatão}}->.searchArea; ( nwr [“addr:postcode”!~”^[0-9]{5}-[0-9]{3}$”] “addr:postcode”!; nwr [“postal_code”!~”^[0-9]{5}-[0-9]{3}$”] “postal_code”!; nwr [“postal_code:side:even”!~”^[0-9]{5}-[0-9]{3}$”] “postal_code:side:even”!; nwr [“postal_code:side:odd”!~”^[0-9]{5}-[0-9]{3}$”] “postal_code:side:odd”!; ); out meta; >; out meta qt;
https://overpass-turbo.eu/s/1J8T
Consulta de Delegacias em uma área do mapa overpass “ consulta pesquisa qualquer área do mapa”
[out:xml]/fixed by auto repair/[bbox:{{bbox}}][timeout:800];
// determine set of police stations ( node[amenity=police]; way[amenity=police]; rel[amenity=police]; )->.polices; // put them into the set “polices” (._;>;); out meta;/fixed by auto repair/
https://overpass-turbo.eu/s/1J8U
Consulta em formato csv para Rua sem nome por Área.
[out:csv(::type,::id,name,::count)]; ( way[“highway”=”residential”]“name”!~”.”; ); out meta;/fixed by auto repair/ >; out meta qt;/fixed by auto repair/
https://overpass-turbo.eu/s/1J8j
some examples of overpass query https://overpass-turbo.eu/
Posted by German C on 26 March 2024 in Spanish (Español).

En su pueblo tal vez ya tenga:
- ✅ Calles urbanas:
- ✅ Areas de casas de habitación:
- Algunas con la dirección (Carrera 4B, Calle 17C, etc)
- Algunas con el número de casa (3-21, 9D-87, 6Bis-54, 1-23 Piso 4, 4-56 Interior 7)
- ✅ Campus escuela o colegio:
- La mayoría con el nombre.
- Algunas contienen otra área de la cancha deportiva.
- Algunas contienen otra área de edificación escolar.
- ✅ Campus universidad e instituto tecnológico:
- Todas con el nombre.
- Todas con la página web institucional.
- Algunas con la cantidad de pisos.
- ✅ Area Hospital:
- Algunos con los edificios hospitalarios.
- Algunos con nodo por donde es la entrada a urgencias.
- ✅ Areas Parque:
- ✅ Area del cementerio:
- Algunos con otra área de la capilla.
- ✅ Areas del templo:
- Algunos con el nombre (Catedral Nuestra Señora, Basílica San, Iglesia Santa, Capilla Sagrada, etc).
- Algunos con la religión y su denominación.
- ✅ Areas de bosques por algún borde del pueblo:
- Tal vez pensando en reclasificar algún pedacito como área de arbustos.
- ✅ Area de piscina, edificación, césped donde pasan la guadaña de vez en cuando, estación de policía, estación de bomberos, estación de combustible, parqueadero, acueducto, etc.
- ✅ Nodos de bancos, farmacias, hoteles, supermercados, papelerías, restaurantes, panaderías, cafeterías, heladerías, carpintería, misceláneas, tienda de zapatos, arreglos de zapatos, pequeño zapatero, tienda de ropa, modistería, taller de motos, tiendas de barrio, estación de carga eléctrica, tiendas naturistas, etc.
Pero tal vez en su pueblo aún le haga falta mapear cosas fácilmente visibles:
- Semáforos.
- Paso de cebra.
- Reductor de velocidad.
- Señal de tránsito stop dibujado en el suelo o como una paleta clavada cerca al anden .
- Sentido de la calle.
- Postes con transformador eléctrico de distribución.
- Lámparas de alumbrado público (que también puede estar montado en el mismo poste donde está el transformador de distribución).
- Banquitos del parque principal.
- Valla publicitaria.
- Hidrantes (boca-tomas) de incendio.
- Torre de comunicación.
- Postes para sostener lineas eléctricas.
Cosas no tan fácilmente visibles pero muy útiles:
- Horarios de apertura de algún sitio (supermercado, banco, tienda, laboratorio médico donde toman muestras biológicas, iglesia, colegio).
Elementos por los bordes del pueblo:
- Torre de alta tensión.
- Subestación eléctrica.
- Subestación de gas.
- Estación de bombeo de agua.
- Linea eléctrica entre torres de alta tensión o línea eléctrica entre postes.
Y hay un montón de cosas más.
[deleted]
What is this why is there a diary
Hi again,
It’s just 2 days before this diary post was published, and I’m very happy to announce that I will start proposing tags again. I already have exciting ideas and hopefully the community approves them.
EDIT: Next proposal will hopefully come tomorrow or this week, stay tuned!
Ewrt1
Posted by EkMapa on 24 March 2024 in Spanish (Español).

-
Cullera:
· Crear áreas de casas en la urbanización Cullera Park. (+58 edificios) · Crear áreas de casas en la urbanización Bonavista. (+132 edificios) · Crear áreas de edificios en parte Noroeste de la ciudad. (+88 edificios) · Crear áreas de edificios en Cullera centro. (+123 edificios) -
Bilbao:
 · En el parque de Amezola (+ 1 camino)
 · En el parque de Amezola (+ 6 áreas verdes)
Posted by yvonnepaje on 24 March 2024 in English.
Shape my future with OSM Mapping and Youthmappers: Post Graduation Blog
A few months after my graduation, I find myself questioning how prepared I am to face the real world. Will the knowledge I acquired in school, particularly regarding organizational management, truly benefit me? Or could OSM mapping play a pivotal role in shaping my career path?
But how exactly do OSM mapping and YouthMappers influence career decisions?
Through mapping activities, I've gained critical thinking, problem-solving, and collaborative skills—qualities highly sought after in today's job market. Little did I anticipate that within these communities, I would uncover aspects of myself previously concealed. Leadership, once abstract, found a nurturing environment within the supportive ecosystem of YouthMappers. It was here that I discovered my capacity to lead, inspire, and effect change.
YouthMappers became my haven for personal development more than merely a platform. With every mapping project, my confidence increased. Although it was scary at first, public speaking became a skill I developed whenever I got the chance. Our community's response to our influence extended well beyond the boundaries of our maps, creating a lasting impression on people's emotions.
These days, certificates appear on my résumé as credentials as well as proof of my experience. They talk about the hours spent creating, learning, and working together. With the support of mentors and the friendship of other mappers, I learned things that went beyond what was found in textbooks.
Today, I stand not just as a graduate, but as a leader forged in the crucible of YouthMappers. I have the privilege to educate others on utilizing OSM mapping for change. Once reticent, my voice now brims with the fervor of someone who has experienced the potency of unity in action.
Yet it's within YouthMappers that I found my true community—a family united by a shared vision of leveraging mapping for societal good. It's here that I witnessed the transformative power of collective action and the boundless potential of collaborative mapping.
I'll forever be proud and grateful to be a member of the OSM Foundation and part of the expanding community of mappers, the YouthMappers. Thank you for affording me the chance to sculpt my future and leave a mark on the world through collaborative mapping. With pride in my heart and gratitude in my soul, I eagerly anticipate continuing this journey alongside you, charting the course toward a brighter, more inclusive future for all.

Welcome to my second OpenStreetMap NextGen development diary. I am ready to highlight this week’s progress — and there was a lot 👷!
You can subscribe to my diary updates on RSS here:
https://www.openstreetmap.org/user/NorthCrab/diary/rss
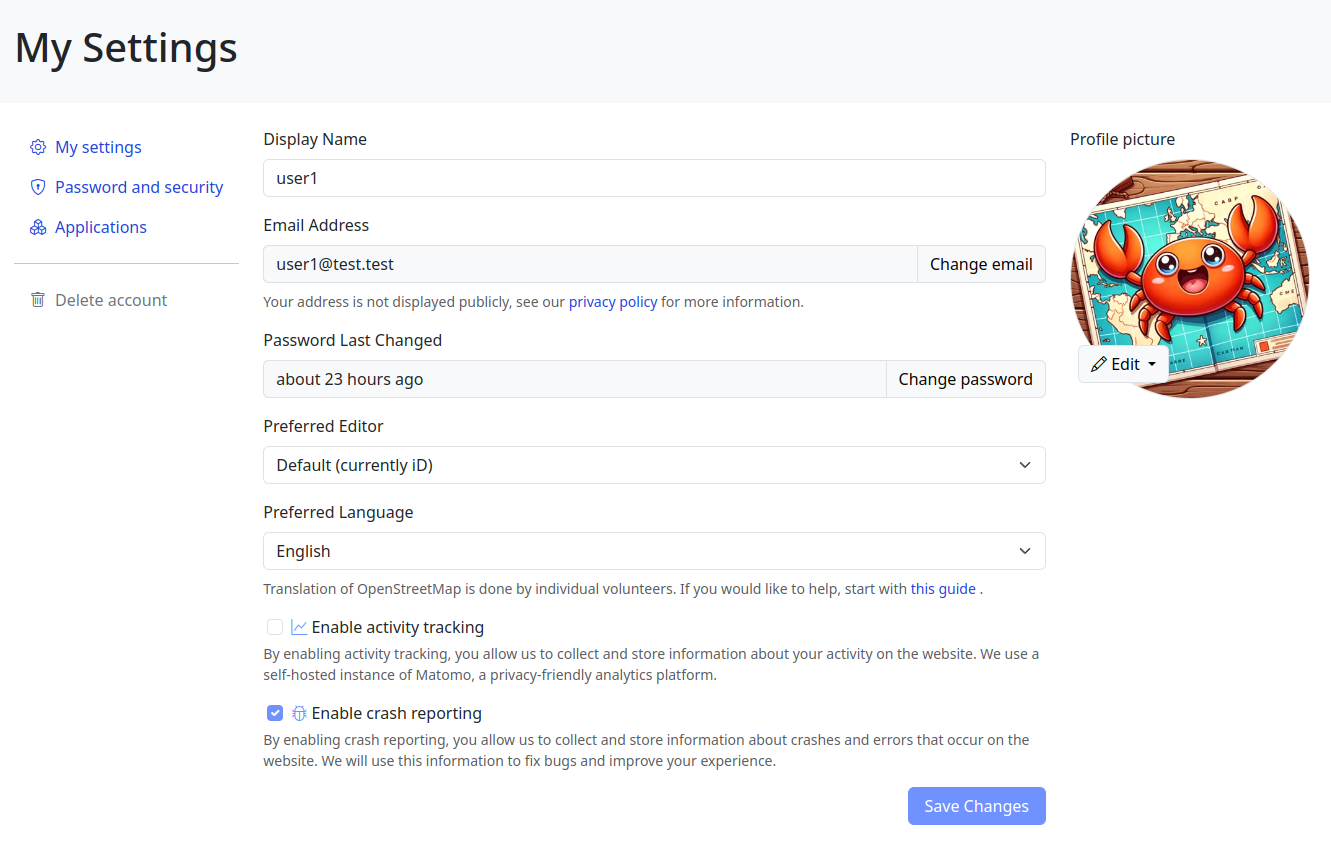
Finished Settings Page
Last week I showcased initial progress on the new settings page for OpenStreetMap. This week, I’ve finished it. Here’s what’s new. Keep in mind that if you believe some features should be done differently, there will be a period of public testing where I’ll collect this kind of feedback 😉.
Click here to view it in full screen.
Aside from the improved layout, I’ve introduced two notable changes. First, the application language selection has been redesigned; it’s now a simple dropdown selector. I believe the current system (where you input locale names by hand) is difficult for less technical people to understand, and I want to make the website more accessible to everyone!
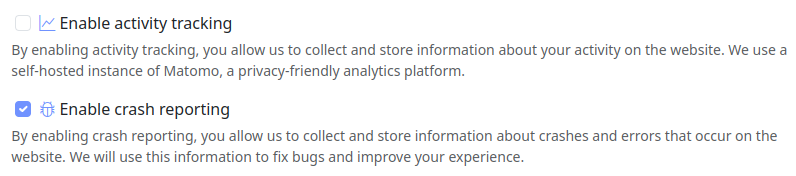
Secondly, OpenStreetMap finally gains account privacy controls. Want to opt out of activity tracking but still send crash reports? No problem! Today’s opt-out implementation relies solely on the Do-Not-Track browser setting. Even when opted out, you’ll still connect to analytics servers (for some reason). The NextGen codebase supports Do-Not-Track headers, the new Global Privacy Control, and does not connect to analytics servers when opted out. Account configuration takes precedence over browser configuration.
Seamless 180th Meridian Handling
This week I’ve invested time in smoothing out handling of the 180th meridian in both the frontend and backend. When browsing the map around the 180th meridian, there are no more visual glitches when crossing it. Additionally, the map and notes layers will no longer throw exceptions around it. The new position handling script is also significantly smaller compared to the existing Ruby codebase. The backend API now seamlessly handles 180th meridian requests.
The current API integration when requesting an area from 160° to 200°:
- Send 1st request from 160° to 180°
- Send 2nd request from -180° to -160°
- Merge results
The new integration:
- Send 1 request from 160° to 200° (or from -200° to -160°)
Splitting, wrapping, and merging are done under the hood by the API, significantly reducing code complexity in many consumer applications. Less complexity means fewer bugs and easier integration with OpenStreetMap.
System Apps and Test Users
As I actively work towards creating the best developer experience, this week I focused on two new features: system apps and test users.
System apps are OAuth2 applications managed by the application itself, not by users. Currently, there are two system apps: iD and Rapid — the supported web editors.
INFO:     | 2024-03-23 23:43:45 | Registering system app 'iD'
INFO:     | 2024-03-23 23:43:45 | Registering system app 'Rapid'
In the current Ruby codebase, you need to follow all these steps just to get your own iD instance running. OpenStreetMap-NextGen does this automatically on application launch for you — you’re welcome 🙂.

Test users are just that: users for testing. I like when applications provide developers with multiple users ready to be used, rather than requiring them to go through the registration process. Contributors can now log in to any of these users with a single button press!
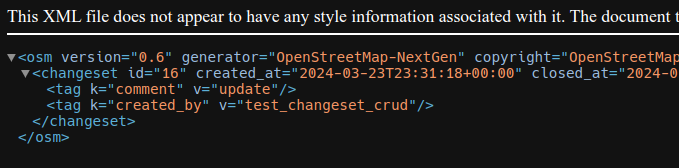
Progress on Notes and Changesets API 0.6
I’m actively working on the migration of existing API features. This week, I successfully tested CRUD (Create, Read, Update, Delete) operations on notes and changesets. There were a few issues that needed correction, but nothing notable.
And More…
All of my work is publicly accessible on this GitHub repository. While my development diaries focus on selected highlights, there are many more details to read through. You can browse the commits history.
Project Sponsors 🦀
I want to take a moment to personally thank this week’s project patrons. It was super motivating to see new supporters! I really appreciate all of you! 🫰
Currently, my work is sponsored by 5 patrons on Liberapay, including three private donors. I have one public donor on GitHub Sponsors and have also received a private donation via PayPal.
~1847430, gileri, 快乐的老鼠宝宝/LaoshuBaby
If you’d like to join my development sponsors, you can find me on Liberapay or GitHub Sponsors. Currently, all contributions go directly towards the development of OpenStreetMap NextGen 🚀.

Disclaimer
Please note that this project is not affiliated with the OpenStreetMap Foundation. It’s the result of my voluntary work and personal choices.
Posted by Kanoxitu_zh on 22 March 2024 in Chinese (China) (中文(中国大陆)).
求助,今天补充地图的时候网络卡了,结果回来的时候就变成这样了,右键显示的都是[missing “en.javascripts什么的,重启清理数据也没用,只能换其他游览器,有没有什么别的处理方法。 图:https://ibb.co/S0KVzp8