OpenStreetMap logo OpenStreetMap

Users' Diaries

Recent diary entries

Posted by KNaing on 9 June 2024 in English.

Introducing myself as first post.

Hello, I’m Naing Win Tun.

I touch in Openstreetmap last 10 years ago and contribute randomly.

This year I contacted AP-Guru program and was exposed to better methods, tools, trainings.

Although previously I thought that when adding POIs, you can only add them if you have local knowledge When I came into contact with tools like Mapillary, I realized that I can search and install in unlimited places.

I also found HOT-TM (Hot Tasking Manager) to be an excellent management tool when creating and collaborating on projects with people.

I have also been exposed to other interesting technologies and Now I’m contribute more efficiently on OSM data development.

Thanks.

Posted by Kshitijraj Sharma on 9 June 2024 in English. Last updated on 14 June 2024.

Welcome ! First lets start with overture , if you don’t know what is Overture Maps Foundation and what it does I strongly recommend you to go through this website : https://overturemaps.org/ , I tried to build small utilities and hosted them so that readers of this blog also can look into the data and analyze by themselves.

Release Used

  • Overture release: 2024-05-16-beta.0

Objectives

Primary Objective

  • To perform qualitative and quantitative analysis of Overture map data.

Secondary Objectives

  • Visualize the releases on a country level.
  • Conduct qualitative analysis to identify additions to existing OSM data and differences across countries.
  • Facilitate general users in forming their own opinions based on the available data.

Approach

  1. Build a script to retrieve Overture data as geoparquet with multiple themes (streamlining and automating the process).
  2. Convert geoparquet to geojson.
  3. Convert flattened geojson to pmtiles.
  4. Develop a viewer for comparison and loading.
  5. Automate the entire process with a bash script.
  6. Compare with population data, existing OSM buildings in the area, and if possible, the number of people per building.

Considerations

  • Duckdb, overturemaps-py, and GDAL were tested for extraction, with overturemaps-py standing out as simple and perfect. The repo was forked, and enhancements were added to the viewer and filters to support any custom key and value.
  • Tippecanoe was used to convert geojsonseq to pmtiles.
  • A bash script was used to automate the entire process, making it configurable using config.json (base and default) for layers, their properties, tile generation settings, combining multiple layers into a single tile, and fetching the right key and value for specific layers.
  • The primary statement being validated is: “Overture Maps data will undergo validation checks to detect map errors, breakage, and vandalism to help ensure that map data can be used in production systems.”

    image

Study Areas

  • Argentina
  • Indonesia & Malaysia Area
  • Kenya
  • Liberia
  • Malawi
  • Nepal
  • Nigeria

Note: Covering bounding boxes were drawn to somehow match the country boundary in above listed countries ( this is not true for all of them - actual boundary may differ ). Data on those bbox were downloaded, viewed, analyzed, and compared regarding its distribution and how it fits with the existing population.

image

View Geojson Here

Qualitative Analysis

Buildings

  • Buildings seem to have undergone good conflation.
  • Offset and merging of ML datasets have been taken care of.
  • Buildings present on satellite images seem to be included in the dataset.

    image

    image

Roads

  • Roads are not cleaned and validated.

    image

  • When a release is published, there are no major enhancements, and orphan roads remain in the datasets.
  • Tags are not fixed or validated (For eg: In Nepal, most of the roads were classified as unclassified - same as OSM. Some major roads have inconsistency in trunk and primary). It appears that tags validation is still ongoing or something is not being looked into.

Some Validation Issues

  • Pular Pisau, Borneo (Near Malaysia):

    image

  • Height feature is present in only some buildings. In countries like Nepal, it is minimal.

    image

  • Inconsistent tags in road dataset along with orphan roads as mentioned above

  • Meanwhile , POI datasets appear to be detailed and populated in most places, making them easily importable into OSM. You need to be aware of confidence though

    image

Quick summary

  • Overture datasets stand out well for building footprints and POIs, relatively speaking. Transportation, Land, and Land Use seem somewhat similar to OpenStreetMap. (This is before overture released new land cover datasets which I haven’t looked into)
  • Validation and conflation are poor in layers other than buildings.
  • Good offset alignment with roads.

Quantitative Analysis

Buildings

Area Google Open Buildings % Microsoft ML Buildings % OpenStreetMap (as per Overture info) % Total Overture Buildings Population Estimate P.E. (in mil) People per Building Approx Current OSM Buildings
Argentina 34,545,592 73% 8,998,855 19% 3,457,499 7% 47,001,946 78,765,589 78.77 1.68 3,497,866
Liberia 1,557,014 55% 144,185 5% 1,148,863 40% 2,850,062 10,157,546 10.16 3.56 1,151,027
Indonesia 4,314,085 41% 2,485,377 24% 3,641,263 35% 10,440,725 27,523,228 27.52 2.64 3,651,924
Nepal 26,280,737 68% 4,396,928 11% 8,078,311 21% 38,755,976 129,874,888 129.87 3.35 8,243,272
Malawi 8,882,648 61% 1,758,044 12% 3,927,989 27% 14,568,681 29,256,446 29.26 2.01 3,943,125
Kenya 20,334,091 59% 3,734,399 11% 10,414,457 30% 34,482,947 75,320,339 75.32 2.18 10,557,014
Nigeria 50,787,453 68% 7,150,013 10% 16,304,722 22% 74,242,188 252,698,591 252.70 3.40 17,966,401

Overture release: 2024-05-16-beta.0

PS: Population and Current OSM Buildings Estimate is from Kontour API
People per building = Population Estimate on the Area / Total Overture Buildings Approx current OSM buildings = Fetched from the OSM at current date to validate the overture osm building numbers may not match as overture kept snapshot of osm and by the time of this analysis buildings might increase or decrease in osm, should give rough idea
Analysis was not done on exact country boundary, its bbox taken in the area as provided in the geojson and shared the same geometry using different parameters

Places distribution based on confidence value

According to overture confidence values in places is about the existence of the place itself, which means if it has 50 % that means there is 50/50 chance that place exists there. I tried to see how much can I trust may be those above 80 % ? or 70 so I tried to figure out how much data is there in this threshold .

Country Above 90 % Confidence 80-90 % 70-80 % 50-70 % Below 50 %
Argentina 0.438 17.3557 1.6333 38.1136 42.4594
Indonesia & Malaysia Area 0.1412 12.3793 0.3198 47.8856 39.2741
Kenya 0.2197 12.8847 1.8883 41.023 43.9842
Liberia 0 10.0957 0.3299 58.1326 31.4418
Malawi 0.1422 12.9801 1.2269 51.0135 34.6373
Nepal 0.4004 11.0466 5.9221 33.3404 49.2904
Nigeria 0.1078 10.2943 1.3312 38.5526 49.7141
Average 0.2070428571 12.43377143 1.807357143 44.00875714 41.54304286

P.S. Table is in percentage distribution for example in Argentina out of POI available there only 0.4 percentage of data with more than 90 % confidence

Conclusion

From the qualitative analysis conducted on different parts of the world, the data is impressive in terms of offset management when different sources are grouped. I am preetty amazed to see the coverage along with conflation and offset accross the different parts of the world. Buildings seem to be well-matched with each other on an obsolete level, and when ground truth checking with Esri imagery, it covers most places. However, when combined with the tabular analysis in most of the places people-per-building ratio are not that realistic yet they are not worst too (seems it doesn’t left out and covers most , it might have some extra clutter buildings). For example, in Argentina, it’s 1.68 which seems pretty low. It appears that OpenStreetmap buildings are preserved and are as told (given highest priority - if you look into current approx OSM buildings and numbers included in overture they are quite similar). A massive number of AI building footprints are added to the datasets, whereas google buildings are almost more than 50% in all of the area (Except Indonesia). For roads, validation is still poor, especially in areas like Nepal and Indonesia, where many orphan roads exist in the datasets.I expect tags validation and cleaning specially on road which is not case in the areas I looked into , tags such as primary roads , trunk , unclassified roads are inconsistent. The POI datasets seem well-detailed, and there is great potential for them to be added to OSM after validation, as RapID already has this functionality. While doing so you need to be aware that higher confidence data is low as compared to number of datasets available . On average : only 0.2 % are of above 90 % and 12.4 % on 80 - 90 percent confidence values so even though total row numbers are large better to filter them based on higher confidence. 3D height data is not impressive in the developing countries yet I was surprised to see some of them in countries like Nepal. Building footprints seems to be well defined and aligned with transportation layers exploring the potential that it might be quickly checked validated and used in case of pre-disaster response.

This analysis might be incomplete and is my only personal view with quick analysis on the area I looked into. It is suggested to form your own opinion using the developed tools and data shared as shown in the video by the end of this blog.

Tools and Resources Developed

Querier

https://queryparquet.streamlit.app/ (Tool might go in sleep mode if there is no usage , Please wake it up if needed)

Image description

Source code : https://github.com/kshitijrajsharma/qrp

**Features : ** - Allows you to shoot custom queries on the parquet data , such as stats , how many rows are their which are from microsoft , meta etc - Default query to get stats based on the source - Provides a box where you can form your own query if you like - Integrates OpenStreetMap current buildings and population of the area (based on bbox supplied) so that you can use it in your query for the analysis - Supports remote parquet url as input and prepopulates the study area that I did

Example dirty query to get % distribution for places

Image description

Viewer

I made a quick dirty viewer to do qualitative analysis, The viewer can directly be accessed from Querier or also available here: https://hotosm.github.io/overture-to-tiles/

Image description

Viewer supports remote pmtiles and custom styling , Example viewer with default styling : https://hotosm.github.io/overture-to-tiles/?url=https%3A%2F%2Fstaging-raw-data-api.s3.amazonaws.com%2Fdefault%2Foverture%2F2024-05-16-beta.0%2Fargentina%2Fpmtiles

Source code : https://github.com/kshitijrajsharma/overture-to-tiles/tree/master/docs

**Viewer features : ** - Simultaneously view the place in OpenStreetMap , Overture and ESRI satellite image - Open all layers in OpenStreetMap Editor : RapID - Allows user to download geoparquet of source - Query the attributes and tile bounds - Custom styling supports for the vector layers like this : https://github.com/kshitijrajsharma/overture-to-tiles/blob/master/docs/styles/default.js - Supports remote pmtiles using url parameter - Toggle vector layers and their classes along with OpenStreetMap and ESRI Satellite image - 3D view with both overture height data and OSM no of floors data

Quickly View Study Area Datasets

Extractor

https://github.com/kshitijrajsharma/overture-to-tiles/blob/master/scripts/Readme.md

https://github.com/kshitijrajsharma/overture-to-tiles/

**Extractor features : ** - Automates extraction from overture data using custom theme : https://github.com/kshitijrajsharma/overture-to-tiles/blob/master/scripts/base_theme.json - Supports children layers to be combined into single pmtiles layer - s3 upload

Quick demo how you can visualize and analyze the data

Watch Video :

https://github.com/kshitijrajsharma/overture-data-analysis-report/assets/36752999/31eb9917-3fff-42db-9f5d-d2c53649bb81

Resources and Credits :

  • Pmtiles , Overture-py , Tippecanoe , Overture-docs , RapID

I welcome your thoughts and comments.

Hablando con otros miembros de la comunidad de Colombia, en especial con Rafa - risturiz con quien he resuelto miles de notas de Colombia y LatAm, nos pusimos a soñar cómo podría ser una aplicación para recolectar información por medio de notas masivamente y de una forma segura.

Esta charla surgió gracias a los avances que hemos notado con las notas. Inicialmente, las notas solo eran texto (y bueno, lo siguen y seguirán siendo) pero ahora hacen referencia a otro tipo de elementos multimedia. Por ejemplo, Fediphoto puede crear notas en OSM, asociando una foto subida a un servidor federado de Mastodon (como en.osm.town), y de esta forma subir muchas fotos que persistan junto con una nota.

Otra forma avanzada es con StreetComplete que también permite asociar fotos pero son temporales (mientras la nota está abierta, lo cual es una lástima y restringe la aplicación). Por otro lado, ahora permite capturar una traza GPX, subirla a OSM, y asociarla en la nota. Esto ha permitido que las notas tengan información más rica al momento de resolver notas, sobretodo para nuestro rol de resolver notas.

Con los avances de tecnología, y dispositivos disponibles en el mercado, consideramos una aplicación móvil así:

  • Tener una aplicación dedicada a notas, que no sea una aplicación que tenga otro propósito y que permita crear notas, sino algo 100% notas. Esto permite algo enfocado para la recolección de datos en terreno. Algo muy cercano es la aplicación OSM Tracker, que actualmente mantiene la comunidad de Costa Rica, solo que esta es para crear trazas, y no notas.
  • Nos gustaría poder integrar un botón bluetooth, de los mismos usados para la selfies, pero en vez de activar la cámara activen el modo de captura de datos de notas. Y mientras se tenga oprimido se recolecten datos.
  • Que la aplicación de notas se integre con las gafas inteligentes (smart glasses) que tienen cámara, de manera que “ven” lo mismo que el mapeador está viendo. De esta forma, graban video (algo corto de 30 segundos) para crear video notas, lo cual sería más rico en información que las notas actuales.
  • Gracias a las capacidades de grabado de audio del teléfono celular, y por medio de un manos libres, dar la descripción de lo que se ve mientras se graba el video con las smart glasses. Esto sería grabado en el mismo video, e inclusive convertido a texto con un analizador de voz.
  • Subir el video con el audio a una plataforma federada como loops - https://mastodon.social/@loops@pixelfed.social.
  • Además, la aplicación podría estar capturando en background la ubicación del mapeador de forma permanente, pero que al momento de oprimir el botón bluetooth conserve los previos 10 segundos antes de comenzar a grabar y otros 10 segundos después de terminar de grabar. Con una traza más larga del segmento de video, permite ubicar mejor dónde fue capturado el video y entender mejor el contexto del terreno. Además, si se captura de forma permanente, la ubicación será mejor, que cuando se comienza desde cero una traza.
  • Utilizar las propiedades de orientación de la cámara, para saber a dónde apuntaba (norte, oriente, hacia 45 arriba, a una altura de X metros). Esto suponemos lo traen las gafas
  • Finalmente, que la aplicación le notifique de comentarios sobre las notas creadas recientemente. Esto permite que se realice un notathon en tiempo real, lo cual sería beneficioso por ejemplo en mapeo humanitario.

Con todo esto, el mapeador en terreno tendría su celular guardado, unas smart glasses que tienen apariencia de gafas normales, un pequeño botón bluetooth en la mano, y un manos libres en la oreja. Recolectaría mucha información por medio de un mecanismo sencillo como son las notas, no pondría en riesgo su celular, que es el problema en sitios peligrosos. Tampoco generaría dudas en las personas del entorno, quienes no les gusta que les tomen fotos, y desconfían de las personas que levantan datos en terreno. Y finalmente, los mapeadores en el computador (arm-chair mappers) tendríamos mucha más información, mejor contexto del terreno, y podríamos mapear de una manera más rica las notas reportadas.

Bueno, esto fue nuestro resultado de soñar el futuro de las notas, pero puede que esté muy cerca, a la vuelta de la equina, y sea tan solo unir varias herramientas.

IVIDES.org promoveu oficina para ensinar a mapear feições ecologicamente importantes


O Instituto Virtual para o Desenvolvimento Sustentável - IVIDES.org promoveu uma oficina sobre mapeamento de árvores e cobertura vegetal utilizando o OpenStreetMap, a maior base cartográfica colaborativa da atualidade.

https://upload.wikimedia.org/wikipedia/commons/9/9e/Renderiza%C3%A7%C3%A3o_da_vegeta%C3%A7%C3%A3o_no_OSM.png

Na oficina, foram mostradas as etiquetas utilizadas para mapear árvores e cobertura vegetal no OpenStreetMap, além de destacar as iniciativas especiais, como o Environmental OSM.(OSM Ambiental), o mapeamento de árvores de Paul Dassori (OSM Latam) ou o esquema de conjunto de etiquetas proposto por Pedro Tharg (OSM Brasil).


Na página das oficinas temáticas, encontram-se todos os recursos e o vídeo está disponível no canal IVIDES no YouTube.

Também foi mostrado como mapear nos editores iD e JOSM, além da apresentação do plugin FastDraw, que permite o desenho à mão livre no JOSM.

Editor iD

Editor JOSM

IVIDES.org® é uma marca registrada.


IVIDES_logo

Posted by Jiri Podhorecky on 8 June 2024 in Czech (Česky). Last updated on 1 July 2024.

Tenhle blog je o několika argumentech, proč se čas od času věnovat něčemu užitečnému. Třeba mapám OpenStreetMap.

Je to tip pro úplně nezkušené uživatele mapy, jak sobě i druhým rozšířit dovednosti. Samozřejmě, že není exkluzívním návodem na vyplnění času a není jediným a hlavním. Využijte ho podle svých možností v rámci všech dalších aktivit, které ani nemusí být u počítače, ani na internetu.

Čtenářem, který si něco odnese, je tedy někdo, kdo s mapami ještě nic netvořil, ale mohl by. Jen neví jak začít. Tento blog se k němu dostal třeba tak, že mu jej někdo jiný doporučil. Někdo, kdo má spoustu zkušeností s mapami, třeba i profesionální, ale nemá spoustu času to všechno najednou vysvětlit. Od začátku.

Tak pojďme na to.
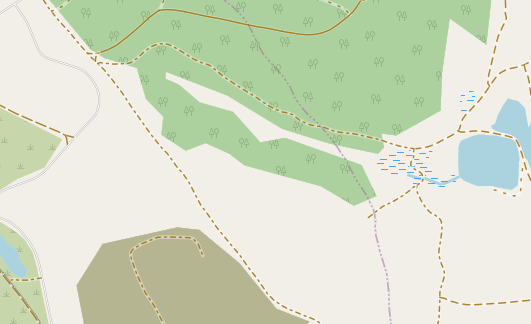
Je toto mapa místa někde mimo civilizaci, nebo je to v Čechách?

Sdělení je tedy zjednodušené a pokud možno nebude zacházet do odborných termínů, technických zákoutí. Ty raději přenechám na někoho jiného. Existují další výukové materiály LearnOSM, návody, OSM wiki a další stránky týkající se pouze OpenStreetMap.

Proč vlastně mapovat?

Orientace v mapách je kognitivní dovednost s vysokou mírou abstrakce a myšlení nad skupinou zeměpisných informací. Potřebujeme v mapách najít cestu od někud někam, nebo místo, které víme že existuje, ale nevíme kde. A to se může hodit v životě i v práci, ať už to bude kdykoliv, kdekoliv a vaše práce, nebo zábava bude velmi různorodá.

Po základní znalosti práce s mapou, můžou přijít nové znalosti, praktické zkušenosti z geografie. Je to tedy zkušenost škálovatelná a je možné se v ní zdokonalovat. Pro mladé lidi se může práce s mapami stát výhodou při hledání zaměstnání.

Mapování je nadstavbová zkušenost s mapami, které už dokážete číst a používat… Mapováním se orentujete v terénu, něco prohlížíte, rozeznáváte nerozeznané a zároveň i nově zakreslujete, vytváříte, upravujete, doplňujete detaily.

Mapování se dá dělat samostatně i v kolektivu, systematicky i nepravidelně, může z něho být okamžitý i dlouhodobý dobrý pocit Většina této činnosti je snadná a úroveň složitosti můžete sami, nebo s pomocí zkušenějších nastavit. Učíte se i vzdálené spolupráci s dalšími lidmi. Zlepšíte své jazykové vybavení odbornými slovy. Pro dobré výsledky vás to přiměje hledat informace odjinud, z veřejných zdrojů, nebo z terénu vlastním průzkumem.

Mnozí z nás používáme počítače intenzívně celý den, jako pracovní nástroj a také i jako zdroj zábavy. Odborníci zkoumající vliv používání počítače a internetu na zdraví člověka už vědí, že přemíra všeho škodí. Přinejmenším je vhodné mít pod kontrolou, jak dělit svůj čas u počítače, jak pracovat i odpočívat.

Vše co děláte opakovaně, umíte po zhruba dvaceti dnech dělat se zlepšenou schopností - na opakující se činnost jste si zvykli, zdokonalili jste ji - ale také si na ní můžete vytvořit závislost. Mozek bude za pravidelnou činnost vytvářet více hormonu štěstí a odměny - dopaminu. Práce i zábava se mohou stát návykovými, podobně jako drogy.

Pokud se chcete odreagovat a vyhnout se nezdravému návyku, zkuste činnost, která se dá dělat nepravidelně, ne moc dlouho a bez zbytečně složitých příprav podmínek. A to je právě mapování. Zatímco z nadměrného pasívního sledování internetového videa hrozí vážné psychické potíže, tak mapování je veskrze tvůrčí činnost s pozorováním a uvažováním, kdy se musíte soustředit a moc dlouho to v jednom kuse nevydržíte. Mapovat budete chvíli, pak zase dělat něco jiného. Lépe se tím odreagujete.

Jaký je stav map a co se mapováním dosáhne?

Na světě je obrovské množství map. Ať už historických, současných, papírových, elektronických, účelových, technických i podivuhodných. Jsou specializované i obecné, nesrozumitelné i jednoduché.

Tady se bavíme především o obecné, veřejně dostupné a univerzálně využitelné mapě OpenStreetMap. OSM existuje paralelně s jinými, komerčními, nebo soukromými mapami. Postupem času a zkušeností můžete sami zjistit, jakou s nimi má, nebo může mít souvislost, jaké jsou přednosti i nedostatky té které mapy. OSM už je velmi obsáhlá, ale rozhodně ne úplná mapa. Mapování je nekončící úkol.

Mapy nikdy nebyly a nejsou konečným a definitivním obrazem mapovaného. Jsou vždy jedním konkrétním obrazem k danému místu a času vzniku, Mají tedy své technické i časové omezení. A to je vpořádku. Je potřeba jen přijmout fakt, že mapy schopné změny se neustále mění k obrazu svému. Proto, aby byly nejen kvalitnější, krásnější, ale také přesnější s novými údaji. Úkolem mapování je tedy blížit se k nějakému ideálnímu popisu reality v přítomnosti a budoucnosti a zároveň mapy používat právě teď a tady.

Kdo dokáže mapovat?

Mladí lidé to zvládnou bez debat, ….druhá věková hranice je individuuální. Při dobrých motorických schopnostech rukou, přijatelném zraku a nějaké té zkušenosti s počítačem se může pustit do mapování i senior.

Důvody, proč starší lidé neradi používají počítače jsou různé… Možná jim totiž někdo počítače vysvětloval jako tajemnou skříňku na složitá počítání… a to je od PC odradilo. Ale naštěstí současná generace seniorů má dnes stále více základních zkušeností s ovládáním počítače i internetu. Takže je i stále snažší příležitost seznámit se s internetovými mapami. A stát se jejich aktivním uživatelem a tvůrcem.

Také lidé, kteří mají nějaký fyzický hendikep, omezený pohyb, mnohdy neví jak aktivně doplnit svůj život. Sledování televize je pro ně pastí a vstupenkou k depresím a pak už ani nepátrají, že by mohli dělat i něco užitečnějšího. Mapování je činnost, která je může svou smysluplností nadchnout a vrátit k pocitu užitečnosti.

Jak začít mapovat?

Začátek bývá vždycky nejistý a zpravidla to není věc nezkušenosti, ale věc obav z neznáma. Dobrý postup je být seznámen s mapami osobně někým, kdo má s mapováním osobní zkušenost. Může se tak stát například na mapovacích akcích s účastí veřejnosti. Tedy konkrétních událostech, kterým se říká mapathon.

organizování Mapathonu na LearnOSM česky

Je to slovo podle vzoru slova maraton - určitá kolektivní počítačová aktivita, kde jde o skupinové dosažení vytýčeného cíle. Vlasně tu ani nejde o vítěze, jde vždy o to zúčastnit se a společně mapovat. S pomocí počítačů a základních počítačových programů se uživatel seznámí s principy mapování, se základními operacemi, nástroji a postupy. Z mé zkušenosti vím, že i člověk, který to nikdy nedělal se dokáže naučit mapovat základní věci zhruba za deset-patnáct minut. Nejdéle trvá ústní vysvětlení hlavních pojmů, aby bylo o čem si dále povídat.

Dobrým prostorem pro realizaci skupinových akcí mohou být centra vzdělávacích aktivit, jako například veřejné knihovny s přednáškovým sálem, ale také vzdělávací a kulturní centra městských organizací, výukové prostory soukromých nebo neziskových organizací, coworkingy, které mají v místě dostupný internet přes wifi.

S kým mapovat?

Kromě začátku na dobrovolnickém mapathonu se nabízejí i další možnosti, kde a jak se s mapováním setkat.

Mezi své zájmové aktivity to mohou zahrnout například dětské skupiny a oddíly mladých lidí jako jsou Skauti, mladí ochránci přírody. Jejich zájmem může být mapování v terénu konkrétní lokality, se zaměřením na dosažení konkrétního cíle a pak prezentace výsledku. To vše může posloužit jednomu účelu, ale zároveň doplnit i veřejnou mapu pro všechny.

Jinou příležitostí může být zapojení seniorů aktivních v nějaké univerzitě třetího věku. Může se stát, že senior po seznámení s mapami skutečně začne s chutí a zaujetím mapovat, protože to je pro něj činnost, kterou může dělat vlastním tempem, nikdo ho nebude rušit, ani mu překážet.

Může se stát velmi aktivním mapovačem, jako už jsem se osobně přesvědčil na mapathonech pro Lékaře bez hranic. Přicházela tam dáma v pokročilém věku, která měla s počítačem malé zkušenosti, ale co se týče mapování, odváděla dlouhodobě skvělé výsledky.

Co mapovat?

Pro začátek je dobré si ujasnit, jak detailně a co přesně je pro vaše mapování vhodné. Je dobré najít místo které dobře znáte, například okolí svého bydliště a dát si nejdřív snadnější úlohy - a s postupně nabytými zkušenostmi přidávat i složitost mapových prvků. Je jen potřeba dodržet pár základních pravidel, jak pracovat s metadaty popisující mapové prvky. To vše je vysvětlené v příručkách a školitel by se měl o nich zmínit.

pár tipů co mapovat: podle svých zájmů to můžou být mapové prvky z oblasti **motorismu a dopravy, prvky architektury historické i současné, body zájmu turistiky a cestovního ruchu, nebo celé oblasti volné přírody.

Jsou lidé, kteří mapují nové prvky jen z jednoho konkrétního důvodu, zájem je buď součástí jejich zaměstnání, jejich osobní priority a nebo pouze konkrétního místa. Jsou i lidé, kteří pracují s OSM především jako validátoři, kteří kontrolují již zakreslené objekty a opravují chybně zanesené vlastnosti mapových prvků.

Toto jsou tipy spíš pro nové mapovače:

jednoduché zakreslení nebo úprava

  • pěších cest různého druhu podle fotomapy
  • krajinných a městských zelených ploch podle fotomapy
  • vodních ploch a malých toků podle fotomapy

středně náročné zakreslení nebo úprava

  • změny menších a větších dopravních cest se zachováním relací
  • rozeznání objektů a skupin objektů na fotomapě, přiřazení oblastí
  • doplnění názvů zjevných objektů, které znáte
  • změny a opravy objektů, které jsou zastaralé nebo nepřesně zakreslené, podle katastrální mapy

náročnější zakreslení nebo úprava

  • zvolení oblasti, kterou chcete detailně mapovat
  • mapování všech chybějících objektů na mapě,
  • doplňování metadat k objektům, včetně názvů veřejných budov, firem, jejich vlastností a parametrů, získávání veřejně dostupných informací z jiných zdrojů, například z webových stran, z wikipedie, opravy a mazání zastaralých informací

vyjímečné a náročné zakreslení, nebo úpravy

  • zakreslení velmi specifických mapových prvků, z konkrétních důvodů
  • systematické opravy prvků, nebo specifických bodů zájmu po celé ČR
  • vytváření velkých strukturovaných relací, např. dopravní trasy veřejné dopravy

Některé zákresy se jen těžko dají udělat “rychle importem odněkud” … pokud tato importovaná data nemáte přesná, v přesné datové formě a pokud si nejste jisti, že budou v OSM adekvátně správně zanesena. Navíc by měla bý tato data pod otevřenou licencí, aby mohla být vložena do OSM. Někdy je prostě lepší věnovat se ručnímu zákresu prvků tam, kde jste si jisti.

Strach z rizika že se něco pokazí?

Mapování v OSM je podmíněné základní znalostí a také vůlí a odpovědností ke své práci.
Je skvělé, že projekt OpenStreetMap je živý, takže i úplní začátečníci se seznamují na reálných mapách s tím, jak se má tato mapa nově tvořit a vylepšovat.

Je zde několik stupňů kontrol a oprav, které zamezí nevratným omylům a chybám. Pokusy o záměrné poškození mapy by byly brzy odhalené a mnoha jinými lidmi znemožněné. Přehnaný strach z chyby tedy není na místě. Respekt, pozornost a vědomí co dělám, je potřeba podobně, jako když děláte cokoliv jiného.

K čemu mapovat, když všechno zvládne umělá inteligence?

Fenomén umělé inteligence se pouští do téměř všech oborů lidsko-počítačové činnosti. Ovšem s mapovacími aktivitami to je překvapivě vlažnější, než u jazykových modelů, nebo generátorů obrázků, hudby, filmů. Zjednodušeně řečeno, umělá inteligence (AI) se u základních mapování ještě tak nerozvinula a zřejmě jsou vážné důvody proč.

I přes schopnost rychlého zpracování gigantických objemů dat, je zde pro tvůrce sestavující A.I. programy poměrně problematické vytvořit mapově kvalitní algoritmus. Z něj pak výstup, který by silou “strojové inteligence” předčil lidské zadání, práci a výsledek. Dosud výsledky vyžadují i nemalé úsilí člověka, aby tyto strojové, geoprostorové datové výsledky kontroloval a zpracoval do použitelné mapy přesně tak, jak chce.

Existují profesionální nástroje s vlastnostmi AI , které složitý úkol mapování a prací s geoprostorovými daty rozdělí na několik dílčích úloh. Rozeznávání objektů z fotomap nebo jiných datových zdrojů (např. LIDARu), pokročilé analytické zpracování… a čištění dat a vizualizací na uživatelských mapách. Tyto nástroje jsou určitým vývojovým krokem, někdy i skokem… ale zatím se nedá říci, že vše dokonale nahradí činnost člověka pro tak základní mapovací činnost, jako je zákres různých detailů do mapy.

Ale kdo ví? Třeba pozítří to bude snažší. Zítra se ještě stále mapuje “skoro po starém” . Ale už velmi pokročilými nástroji :)

Co je odměnou?

Už jsem se setkal s položenou otázkou, proč by někdo měl něco dělat, když za to nic konkrétního nedostane? Nebo snad dostane? Kdo mu za to dá nějaké peníze, když se tedy bude zabývat kreslením mapy?

Tohle je poněkud nesnadné vysvětlit někomu, kdo se na to takto přímo zeptá. Asi bude stačit říci, že to je dobrovolná činnost a nechat dialog být. Aby jindy samovolně, nebo jen s lehkou dopomocí přišly důvody, proč dělat dobrovolnou práci bez peněžní odměny.

U lidí, kteří už znají dobrovolnictví, to může být snažší. S nimi už můžete navázat na jejich praktické zkušenosti. Možná že někdo pomáhal potřebným, pracoval jako dobrovolník pro jiné lidi, nebo organizace. No a tady je to podobné, dobrovolně přispíváte na internetu ke vzniku projektu, který je neziskový a prokazatelně pomáhá mnoha jiným lidem po celém světě. Už dlouho. A úspěšně. S mapami OSM se potkáváme na mnoha různých místech.

Na závěr

Věřím, že jsem zde v několika odstavcích přinesl příklady, důvody a argumenty proč se mapováním na dobrovolné a amatérské úrovni zabývat. Vše přijměte jako příležitost sebe, nebo někoho nového něco naučit, do něčeho proniknout a stát se s dostatkem pokory a pocitu spoluúčasti členem obrovské a různorodé komunity lidí, jejichž úsilím vzniká tato mapa světa. Mapoví odborníci jistě pochopili, že tento článek nebyl zrovna pro ně. :)

Sdílejte, nebo přidejte do komentáře svůj postřeh i praktickou poznámku. Napište jak namotivovat jiného člověka, vyzkoušet si něco tak nevšedního, jako vytvářet mapu v celosvětovém projektu.

Začít může kdykoliv. Třeba hned teď.

Open source, open source. What is open-source software?

My dear mentor at HOTOSM, Kshitij explained this to me using a food I like, which is pasta and I would like to share it.

Open-source software is any software whose make-up(source code) is available for anyone to see and contribute. Like pasta, anyone can make it. You can make it however you like. You can add different ingredients to it which can be likened to adding features to open source software.

Being open-source doesn’t mean free. Open-source software is not synonymous with free software. Let’s hit it home with pasta. That anyone can make pasta doesn’t mean that pasta will be free. Cooking pasta costs me effort and resources, and I could charge for that. Likewise, it is the same for software, it could be open-source but not free.

If however, I have a restaurant where anyone can come in to help cook pasta to distribute freely to people, that is what you will call Free and Open-source pasta. This is mostly the case with most open-source projects Do a quick check. Check if your favourite applications are open-source and appreciate the community behind them.

How about proprietary software? Think about your favourite restaurant to eat pasta. I assume you don’t know how to make it taste like theirs, as you don’t have their recipe. You can’t walk in there to add ingredients to it while they cook because you are not a chef at the restaurant. That is the opposite of open-source. You can’t access the make-up(source code) and you can not add to it. Proprietary software can either be paid or free. Just as your favourite restaurant can either charge you for their pasta or give it to you for free (winks).

I hope this short explanation was worth your read. Let me know.

Posted by hobbesvsboyle on 8 June 2024 in English. Last updated on 17 June 2024.

I love to ride my bike. Long distances. New roads. Usually starting from my home in Madison, WI. I also love mapping. And so whenever I’m out riding I try to do at least a bit of OpenStreetMap data collection. When I see interesting features, like a bike repair stand, or stop at a potential point-of-interest, like a café or gas station, I take a picture on my phone and add the data to OSM once I’m home.

Wandrer.earth map of roads I have bike in around Madison, Wisconsin. I have ridden a lot of them.

Recently I became interested in improving the quality of surface tags for highways. Dane County is known to have a very high proportion of paved roads. Even small rural farm roads are almost always paved. But pavement data in OpenStreetMap is spotty. Therefore I was interested in developing a workflow that allows me to add/update surface=* tags through my bike rides.

I asked for advice on this on the OSMUS Slack channel and got some good suggestions. Based on these suggestions, I developed the following workflow.

During the ride

My default assumption is that a road is paved. Thus, I don’t need to do anything whenever I’m on a paved road. Most paved roads are asphalt (I’m not going to get into the question whether asphalt and chip sealed roads should be tagged differently), and so again, on an asphalt-paved roads I’m not doing anything. Some state and US highways and some rare local roads have different paving, usually concrete. When I encounter one of those (and am in the mood for it), I’ll take a geotagged photo or take a mental note.

Highway bridges almost always have a concrete deck, and so I only note deviations from this. When I encounter an unpaved road, I’ll take a geotagged photo at the beginning and end of the unpaved section, or sometimes record a voice memo to capture more complex information. (Okay, I don’t really do the voice memo in practice – photos are usually much better to capture the information.)

The geotagging on my phone can be less-than-accurate, especially when using battery saver mode. I record a GPS track of my rides with my phone or, preferably, a Wahoo Element bike computer.

Editing at home

  1. Download the GPX file from Strava and the geotagged photos from Google Photos.
  2. Open photos and GPX file in JOSM.
    • If the location of the geotagged photos looks off, I correlate the location of the photos with the GPX track, using the Photo Geotagging plugin.
  3. Right-click on the GPX track layer and select “Download from OSM along this track” JOSM dialog box
  4. The default settings have too wide a buffer around the track. I find that 10 meters gets you everything you need and keeps the downloaded data manageable. In densely mapped areas, you may have to reduce the “Maximum area per request” setting to something lower to avoid errorsJOSM dialog box
  5. The downloaded data includes buildings, waterways, and all kinds of other stuff that is not useful. It also includes highways that already have a surface tag. Therefore, you set up a filter in JOSM. If the filter pane isn’t already active, activate it in the “Windows” menu: Screenshot of the JOSM Windows menu.
  6. Add a filter by clicking on the + symbol in the filter pane: JOSM filter pane
  7. The filter term is surface=* | -highway=* JOSM filter dialog This filters out any object that already has a surface tag and any object that is not a highway.
  8. I found it helpful to make the GPX track drawing a little wider. Right-click on the track’s layer, select “Customize track drawing,” and set “Drawing width of GPX lines” to 8. Main window of JOSM, of an intersection and aerial imagery. A 8-px wide magenta line marks the GPS track
  9. Now we have everything set up to add tags. I follow the GPX track and add surface=* tags to any highway I biked on. Often this is also an opportunity to make other improvements, such as removing old TIGER tags.
    • If I’m unsure about the specific surface type (e.g. concrete vs asphalt), I default to the more generic tag (surface=paved), skip tagging the way, or add an OSM Note.
    • If I only crossed rather than traveled along a highway segment, I may add surface tags to it if I’m really confident and the segment is not very long.

Tips and tricks and quirks

  • When you work with the filtered view, make sure to make any edits to a way before you add the surface tag. Once you have added the surface tag and closed the “Add tag” dialogue, the way will disappear – as the filter you set up now applies to this way.
  • The filter also removes all points along the ways. Thus, if you want to adjust the geometry of a way, you have to temporarily disable the filter by checking the “E”(nabled) checkbox in the filter pane. JOSM filter pane, with one filter having the E checkbox enabled
  • Turning on aerial imagery can sometimes be helpful; sometimes it’s distracting. I don’t recommend relying too much on aerial imagery for surface information. One possible exception: Concrete vs other types of bridge decks are usually easily to distinguish based on imagery.
  • Keyboard shortcuts speed everything up. The most important default shortcuts are:
    • Option-A: Add tag
    • CMD-1, 2, 3, … within the “Add tag” dialog to quickly access previously added tag/value combinations
    • CMD-Option-E: Enable/disable filter (this one doesn’t actually work for me on my Macbook)

Like almost anything within JOSM, you can modify shortcuts too or create custom shortcuts. The defaults seem to be working well enough for me and I haven’t messed around with customization.

I make no claims that this is the best workflow for what I’m trying to do—please let me know if you can think of improvements or have your own alternative workflows!

Location: Mifflin West, Madison, Dane County, Wisconsin, United States

Hi, dear reader.

This is over a week-due post. I posted it on my blog on Dev.to and decided to share it here. Enjoy.

………………………………………………………………………………………………………………………………………………

The people I admire the most used to be healthcare professionals, like my eye doctor. Once, I spent a good time telling him how he was improving lives. I mean he helped me see better. That was noble to me.

Now you know my new set of favourite people? They are the ones who have chosen to dedicate their time to improving people’s lives with open software. They come in different forms: open-source contributor/volunteer, maintainer, committer (I just learnt of this, courtesy of Open Source Guide). These people come together with the shared goal to build and improve software whose source code is available to everyone. As opposed to private proprietary software.

It is with joy that I share that I will get my first experience contributing to open-source for the next 3 months. Through the Outreachy internship, I was selected to work with HOTOSM from May to August 2024.

Outreachy is a paid internship that supports underrepresented individuals in tech to contribute to open-source projects. And HOTOSM(Humanitarian OpenStreet Map), the organisation I will be working with uses open mapping for humanitarian purposes, providing map data to aid in disaster management, community development and the achievement of Sustainable Development Goals.

I have had a great first week with HOTOSM. I have received warm welcomes from my mentors, fellow intern and our coordinator.

Really surprised

This explains how I felt when I received the news that I was selected. I had put in a lot of effort during the contribution phase, but there were many contributors, so I wasn’t sure about the outcome. I am incredibly grateful to have been selected, and I’m also thankful for going through the contribution phase because it taught me to concentrate on tasks and get things done, no matter how many people were working towards the same goal.

This is day 1 of forever making an impact through my work. I get to work on projects that will directly impact lives. I have long envisioned this and I am excited to begin. My name is Oluwanifemi, and I am now among my favourite group of people 😊.

My core values are compassion and optimism. I am driven by compassion for those in unfavourable conditions.

I also value optimism. I hope all things, I believe all things. Some people describe me sometimes as one who puts their head in the clouds 😂 (I must add though that it is not to the point of being counterproductive. Just enough to help me dream lofty dreams).

Posted by IrdiIs on 8 June 2024 in English.

Qerret (18/40.56564/20.40550) was pretty well mapped but while searching for Qerret, many villages with the same name came up, so i decided to map a couple of them.

  • Qerret (Kavaje) 18/41.21660/19.52769, mapped most of it.

  • Qerret (Gramsh) 18/40.90477/20.16848, mapped most of it.

  • Qerret (Elbasan) 18/41.21761/20.19745, added some buildings.

I just realized that instead of adding the tag “#100villagesin100days” under Hashtags i have been adding under Sources… I do not know if there is any way to correct the mistake.

“#100villagesin100days #day8”

There is a growing trend for youth in India to use smartphones throughout universities and colleges alike. At this moment, I saw a potential chance as an OSM enthusiast to introduce a smartphone OSM app called Map Swipe. I had the pleasure of visiting St Anne’s College to discuss the mission of mapping for a community and a good cause. During my visit, I introduced MCA students to the amazing software Map Swipe. This app is a double-edged sword, but when utilized for a good purpose, it may have a big influence. The initiative focused on mapping earthquakes in Papua New Guinea and healthcare in Champai, India.

I am grateful to the Open Mapping Hub - Asia Pacific and GRED Institute of Geoinformatics for their contributions to this research. Their assistance has been crucial in making this endeavour a success.

Mapping has the potential to be a strong instrument for positive change, and I’m excited to see how it continues to improve communities.

OSM Guru St Ann's Field Visit

Location: Ward 70 Mehdipatnam, Greater Hyderabad Municipal Corporation Central Zone, Hyderabad, Asif Nagar mandal, Hyderabad, Telangana, India

Este é o terceiro entre os diários de campo que compõem o caderno de campo da minha pesquisa sobre interações sociotécnicas nos Altos e Córregos da Zona Norte do Recife e sua área contígua em Olinda, cidades localizadas na Região Metropolitana do Recife (RMR). Mais detalhes sobre a pesquisa vocês podem ver na minha tese de doutorado, publicada em https://repositorio.ufpe.br/handle/123456789/48802. Para a tese a delimitação socioespacial foram os Altos e Córregos da Zona Norte do Recife, a parte de Olinda foi agregada depois da tese.

Os diários de campo foram realizados em minhas idas ao território objeto de estudo. Nessas idas sempre registrei o percurso com o aplicativo OSM Tracker. Esse diário diz repeito a ida para a sede do Maracatu Nação Estrela Brilhante do Recife, no Alto José do Pinho, Recife/PE http://u.osmfr.org/m/749769/ .

alt=track do percurso realizado neste campo

Segue abaixo o diário de campo na íntegra, apenas com alterações de nomes pessoais, com o intuito de resguardar a identidade das interlocutoras:

No dia 19/04/2022 fui para a sede do Maracatu Estrela Brilhante no Alto José do Pinho, entrevistar Dona Mariana, presidente da agremiação. Meu interesse em entrevistá-la era por lá ser um ponto de cultura (então procurar saber sobre quais as benesses e limitações de participar do programa cultura viva), também para saber como a entidade se articula com outras do mesmo bairro e buscar pistas sobre uma certa concentração de alunos da turma de Recondicionamento de Computadores na Rua Avenca, que é uma rua transversal à Rua onde fica a sede do Estrela Brilhante que é a Rua Tuína.

Eu já tinha ido ao Alto José do Pinho algumas vezes, tendo como destino o Centro Dom João Costa. Assim, a parte que eu tinha explorado do bairro, eram as duas principais vias de acesso a partir da Avenida Norte (Rua Monte Horebe – sentido Mangabeira; e Valeriano Lobo – sentido Córrego do Bartolomeu) e as Rua Maragogi e Severino Bernardino Pereira, que são duas das ruas que concentram mais comércios, escolas, o terminal de ônibus, dividindo o espaço com as moradias. É uma área de ruas mais largas no bairro, ainda que com curvas sinuosas e diversos becos em suas transversais.

Contudo, para o setor do bairro onde fica a sede do Maracatu Estrela Brilhante, eu nunca tinha ido. Desci no terminal da linha Alto José do Pinho/Cais de Santa Rita e fui seguindo pela Severino Bernardino Pereira, no sentido oposto ao do Centro Dom João Costa, quebrei num beco que dava na Rua Avenca, segui pela Rua Avenca até o ponto de entrada na Rua Tuína, onde passa uma escadaria que vai levar à Rua do Rio, no limite com os bairros da Mangabeira e Bomba do Hemetério. Esta parte do bairro já possui ruas mais estreitas, onde predominam residências, com construções irregulares, algumas casas feitas em cima das outras, outras com reboco exposto, marcando uma área em que a vulnerabilidade social é mais acentuada.

Mais acentuada também é a presença do tráfico de drogas neste setor. Quando cheguei na esquina entre as ruas Avenca e Tuína, havia um movimento o qual eu suspeitei que fosse de tráfico de drogas, depois confirmado durante a entrevista com Dona Mariana. Contudo, como eram as pessoas que estavam bem na entrada da rua do Estrela Brilhante, os perguntei sobre onde ficava a sede do maracatu e eles me indicaram de pronto.

Ao chegar na sede, havia um movimento na entrada, como se fossem pessoas em algum tipo de reunião ou curso algo do tipo. Depois, ao indagar Dona Mariana sobre a atividade, ela me falou que era um curso de arte em cerâmica.

alt=Oficina de arte em cerâmica na sede do Maracatu Estrela Brilhante

alt=Material oficina de arte em ceramica na sede do Maracatu Estrela Brilhante

alt=Escudo e tambores na sede do Maracatu Estrela Brilhante

Como o barulho das pessoas fazendo o curso poderia atrapalhar a captação do áudio da entrevista, Dona Mariana me chamou para uma parte atrás da casa, onde pudéssemos ter privacidade e silêncio para a entrevista. Ela já havia me dito que também mora na casa. Esta parte em que ficamos, era uma espécie de barracão do maracatu: havia máquina de costura, adereços, cartazes, tambores, entre outros tipos de material necessários a agremiação. Desta parte da casa há uma vista bastante interessante, em que prevalece a vista do Alto do Pascoal.

alt=Alto do Pascoal da perspectiva do Alto Jose do Pinho no terraco da sede do Maracatu Estrela Brilhante

alt=Adereços do Maracatu Estrela Brilhante

alt=Cartaz Yle Axe Oyaonira na sede do Maracatu Estrela Brilhante

Fizemos a entrevista, a qual eu não vou entrar em maiores detalhes porque ela foi transcrita na íntegra, mas sobre as minhas expectativas iniciais, digo que em termos de articulação com outras entidades do bairro, ela falou que não havia, talvez fruto de um certo isolamento no bairro, mais distante dos setores onde ficam as sedes do Centro Dom João Costa e da Escola de Samba Unidos do Escailabe, por exemplo, apesar da minha entrevistada do Centro Dom João Costa ter dito que tinha boa relação com o Estrela Brilhante, na ocasião, a pessoa não relatou como se dava essa boa relação. Pelo fato do Dom João Costa ser administrado pela igreja católica e o maracatu ser uma agremiação que cultua as religiões de matriz africana, pode ser que essa dita boa relação, seja no âmbito de haver tolerância religiosa, o que aliás, Dona Mariana citou como ponto positivo da sede ser no Alto José do Pinho, pois falou que, no bairro, a entidade, apesar de cercada por igrejas evangélicas é respeitada no seu culto, ao contrário de terreiros sediados em outros bairros, que ela citou, que chegaram a serem atacados por organizações evangélicas.

Também percebi certa confusão em identificar programas e repasses de verba de entes federais e estaduais na narrativa dela, sobretudo, sobre o programa Cultura Viva. Sobre a violência no bairro, Dona Mariana foi mais enfática do que outros entrevistados do Alto José do Pinho, relatando problemas com o tráfico de drogas, inclusive com membros e ex-membros do Estrela Brilhante, novamente atribuo essa visão ao contexto mais próximo ao tráfico no qual está inserida a sede do maracatu.

alt=Tambores de compensado e de macaíba do Maracatu Estrela Brilhante 2

Sobre a concentração de alunos do curso de Recondicionamento de Computadores advirem da Rua Avenca não consegui muitas pistas. Aliás, nem com o Estrela Brilhante, nem com o Centro Dom João Costa (que recrutou os alunos) e nem com o Professor das turmas. O que ficou marcado pra mim ao ir nessas imediações foi a já citada agudização do contexto de vulnerabilidade social e da presença do tráfico de drogas.

Ao final da entrevista seguimos por um corredor, entre o barracão lá atrás e a sala de entrada, onde se localiza uma espécie de terraço, novamente com uma vista muito interessante, onde se vê mais próximo parte da Mangabeira, mais adiante a Bomba do Hemetério e mais distante, os bairros do Arruda e Água Fria, com o estádio de futebol do Santa Cruz Futebol Clube, se destacando na paisagem. Quando me despedi de Dona Mariana as pessoas continuavam no curso de arte com cerâmica. Segui pelo mesmo caminho de volta e desci pela Rua Valeriano Lobo até a Avenida Norte.

alt=Vista da sede do Maracatu Estrela Brilhante Mangabeira - Bomba do Hemeterio - Agua Vria - Arruda

Location: Mangabeira, Recife, Região Geográfica Imediata do Recife, Região Metropolitana do Recife, Pernambuco, Região Nordeste, Brasil

Este é o segundo entre os diários de campo que compõem o caderno de campo da minha pesquisa sobre interações sociotécnicas nos Altos e Córregos da Zona Norte do Recife e sua área contígua em Olinda, cidades localizadas na Região Metropolitana do Recife (RMR). Mais detalhes sobre a pesquisa vocês podem ver na minha tese de doutorado, publicada em https://repositorio.ufpe.br/handle/123456789/48802. Para a tese a delimitação socioespacial foram os Altos e Córregos da Zona Norte do Recife, a parte de Olinda foi agregada depois da tese.

Os diários de campo foram realizados em minhas idas ao território objeto de estudo. Nessas idas sempre registrei o percurso com o aplicativo OSM Tracker. Esse diário fala sobre duas datas, pois no dia 22/03/2022 fui fazer uma entrevista e acabei gravando da entrada do Córrego do Jenipapo até o local da entrevista http://u.osmfr.org/m/735905/.

A ideia inicial seria andar pelo entorno, mas estava chovendo muito, além do meu interlocutor estar coordenando uma campanha de vacinação no dia. Assim, retornei no dia 07/04/2022 para circular pelo entorno do Córrego do Jenipapo e fazer registros fotográficos http://u.osmfr.org/m/744616/

alt=track do percurso realizado neste campo

Segue abaixo o diário de campo na íntegra, apenas com alterações de nomes pessoais, com o intuito de resguardar a identidade das interlocutoras:

Marquei com João (nome fictício) no dia 22/03/2022, ele foi aluno do curso de Recondicionamento de Computadores realizado no CRC/Marista em 2018 e também do curso de Produção Cultural Multimídia e Gestão em Produção Cultural Comunitária, oferecido pelo Instituto Intercidadania também durante o ano de 2018, no mesmo espaço em que ficava o Polo de Formação e Reuso de Eletroeltrônicos, nas dependências do Marista, na Avenida da Recuperação em Apipucos. Marcamos na sede do Conselho de Moradores do Córrego do Jenipapo. Foi um dia em que choveu muito na Região Metropolitana do Recife, especialmente no bairro da Macaxeira onde está localizado o Córrego do Jenipapo. Inclusive por pouco não desmarcamos a entrevista, pois no início do dia dois ônibus colidiram na entrada do Terminal Integrado da Macaxeira, o que casou muitos transtornos, com parte da operação tendo que ser realizada na parte de fora, nos arredores do terminal e gerando um trânsito que congestionou a Avenida Norte desde o bairro da Macaxeira até o bairro do Vasco da Gama. Contudo, mesmo sob forte chuva cheguei ao local da entrevista.

Chegando lá, estava havendo aplicação de vacinas contra a Covid-19 na sede do Conselho de Moradores, de maneira que a entrevista foi efetuada em meio aos isopores com as vacinas, as pessoas que estavam aplicando e as pessoas que estavam indo se vacinar. Mesmo com uma quantidade elevada de ruído, não houve comprometimento do áudio da entrevista. Contudo, eu também tinha o objetivo de realizar o registro fotográfico dos arredores, o que definitivamente, ficou inviável em decorrência das fortes chuvas. Com isso, combinamos que eu iria outro dia para fazer o registro fotográfico.

alt=track do percurso realizado neste campo

No dia 07/04/2022 fui, em um dia já ensolarado, ao encontro de João para fazer os registros fotográficos. A rua onde fica a sede do Conselho de Moradores é ladeirada, de maneira que ela desemboca no largo do Maracanã, local onde foi feita a foto acima, do dia 22/03/2022 quando choveu. Este largo é um centro comercial do Córrego do Jenipapo, abrigando mercadinhos, quitandas, bares, escolas, casas de frios, entre outros tipos de comércio e é também onde fica o terminal da linha Largo do Maracanã, que segue de lá para o centro do Recife.

Pegamos a escadaria subindo pelo Córrego do Maracanã até chegar ao Alto do Formoso onde eu buscaria então fazer os registro com as perspectivas: à oeste da Mata de Dois Irmãos e vias de circulação (Avenida da Recuperação, BR 101 Norte), equipamentos públicos (Upinha Dr. Hélio Ramos, Terminal Integrado da Macaxeira) e de espaços de sociabilidade (campo de futebol de várzea do Barreirão); à Sul o emaranhado de prédios na paisagem começando pelos de Casa Amarela e seguindo até os da zona Sul do Recife; à leste a visão dos morros da Zona Norte. Este foi o mote do registro cujas fotos seguem ao final do texto.

A sede do Conselho de Moradores também abriga uma geladeira-biblioteca, que fica na calçada da sede, o que permite o acesso dos moradores a biblioteca, mesmo quando a sede do Conselho está fechada. Na volta, paramos um pouco na sede, para descansar da subida e descida da escadaria e beber uma água, onde aproveitei para subir as fotos no Nextcloud (plataforma descentralizada de armazenamento de dados em nuvem).

Ali ficamos conversando sobre um curso chamado de Habilidades Sociais, que é ministrado aos sábados pela vice-presidente do Conselho de Moradores, pois observei um cavalete com o título do curso e alguns conteúdos a serem ministrados nele. Perguntei a João do que tratava o curso e ele disse que era um curso sobre como elaborar currículos, se portar e entrevistas de emprego e fazer encaminhamentos para vagas de trabalho. Edson explicou que a motivação para o curso era a de que os jovens, mesmo sabendo utilizar as tecnologias, muitas vezes não tinham a habilidade de elaborar um curriculum ou enviar e-mails formais pra entrevistas, nem se vestir adequadamente para os processos seletivos. Uma turma de 30 jovens assiste à aulas deste curso nos sábados lá na sede do Conselho de Moradores.

Depois João, cuja os pais eram agricultores do município de Buenos Aires na Mata Norte de Pernambuco, falou das expectativas que ele tinha quando jovem, a vir conhecer a tão falada “Capital”. Ouvia falar que era um lugar mais desenvolvido e que tinha de tudo e que um dia ele conheceria a Capital. Foi quando ele disse que a mãe veio primeiro pra Região Metropolitana do Recife, apoiada por familiares, e que depois ele veio para ficar em definitivo.

João também organiza algumas excursões para Toritama, no agreste pernambucano, um dos municípios que compõem o Polo de Confecções do Estado. Estas excursões da região metropolitana do Recife para municípios como Toritama, Caruaru e Santa Cruz do Capibaribe é muito comum, onde algumas pessoas compram vestuário para a sua própria necessidade e outras compram para revenda, especialmente nos meses que antecedem dezembro (por conta do uso e revenda dos vestuários para as festas de final de ano: natal, réveillon e demais confraternizações feitas nos finais de ano). Perguntei se ele tinha organizado as excursões no final de 2021, já que ainda haviam restrições a circulação de pessoas no Estado de Pernambuco, por conta da pandemia da Covid 19. Ele disse que sim, conseguiu realizar, pois mesmo com as restrições havia condições de realizar as excursões. Falou também que estava organizando para outros municípios e que estava tentando articular um para Triunfo, no sertão do Pajeú, no mês de julho.

Depois dessa breve conversa desci rumo ao Largo do Maracanã, com o objetivo de tomar o ônibus de linha homônima para o centro do Recife, mas chegando ao terminal, havia um ônibus parado e então perguntei ao motorista se estava saindo. Ele respondeu que não, que iria demorar. Então me dirigi à Avenida da Recuperação (pista local da BR 101 Norte, entre os bairros da Macaxeira e Apipucos), há cerca de 200 metros dali e peguei a linha Guabiraba/Córrego do Jenipapo, rumo ao centro do Recife.

alt=Ladeira do Alto do Formoso sentido Alto do Cruzeiro

alt=Geladeira biblioteca no Conselho de Moradores do Corrego do Jenipapo

alt=Geladeira biblioteca no Conselho de Moradores do Corrego do Jenipapo Aberta

alt=Perspectiva do Alto do Formoso avistando os morros mais perto com o Corrego da Areia mais proximo e os predios do Recife ao fundo 2

Location: Córrego do Jenipapo, Recife, Região Geográfica Imediata do Recife, Região Metropolitana do Recife, Pernambuco, Região Nordeste, Brasil
Posted by nicyK20 on 7 June 2024 in English.

My name is NISENGWE Claudette and I go by nicyK20 in open street map. I joined OSM in March, it was in in ,mapathon organized by OSM Rwanda community to celebrate International women day. I saw a link in a WhatsApp group, I applied and they selected me. At time I didn’t know what mapping was, but they explained to us what they do and I became interested. I took their contact, they gave me more information. OSM Rwanda community is a very good community and I like how they make me feel included. much respect to its founder Rebecca and all mentors.

Location: Kabacuzi, Muhanga District, Southern Province, Rwanda

I found out Faqekuq is one of tens of villages surrounding my hometown, so I got excited. Faqekuq is a tiny village with a very small population and just a bunch of houses, so I proceeded mapping also the closest villages, Kapinovë and Turbohovë.

Kapinovë is a beautiful village and I have visited it many years ago when I was a teenager. I am so happy I got to add it to the map. To me, it is very important having this small, almost fully abandoned villages on the map because they should not be forgotten.

Movie suggestion: Bacurau

Sorry for the spoiler!!

One thing that hit me the most from this movie is that the government deleted the place for the map to make it disappear.

“#100VillagesIn100Days #Day7”

Introduction

My name is Lelio de Jesus Alves, and I am from Timor-Leste. I have been using OSM since 2022 and am currently participating in the OMGuru Fellowship 2024. I am excited to share my journey into open-mapping, what I find fascinating about the fellowship, my experiences, the lessons I have learned, and the impact it has had on me.

How I got involved with Open-Mapping

My journey into open-mapping began during my fourth year of university when I stumbled upon OpenStreetMap (OSM). Fascinated by the intersection of technology and geography, I joined an OSM workshop. The idea of contributing to a global, freely accessible map captivated me. I started by mapping my hometown, identifying missing roads, buildings, and other key features. This initial involvement opened doors to various mapping projects and eventually led me to apply for the Guru Fellowship.

Interesting/Fascinating about being the Guru Fellowship

What fascinates me most about the OMGuru Fellowship is the opportunity to connect with like-minded individuals who are equally passionate about mapping and geospatial technology. The fellowship is a unique platform that not only enhances my mapping skills but also connects me with a network of dedicated mappers and developers from around the world. One of the most fascinating aspects is the collaborative nature of the community. Despite geographical distances, we work together to improve the quality and coverage of OSM data. Ensuring data quality in OSM is particularly gratifying, as it enhances the map’s usability and builds user trust. This global collaboration embodies the spirit of open-source and community-driven projects, making it a truly enriching experience. By validating and improving data accuracy, I feel I am making a significant contribution to the global mapping community and supporting projects that rely on precise and dependable geographic information.

Define My experience as a Guru

Being a Guru has been an enriching experience where I’ve had the chance to participate in meaningful projects that have real-world impacts. One significant aspect has been the focus on enhancing technical skills, particularly in utilizing various mapping platforms like Tasking Manager, JOSM, Osmose, MapRoulette, and OSMCha. These tools have allowed me to ensure the accuracy and reliability of data within OpenStreetMap, which is crucial for its usability in various applications. Additionally, being involved in projects such as disaster relief mapping and improving urban infrastructure has provided a sense of fulfillment, knowing that my contributions directly support humanitarian efforts and community development. The supportive community and guidance from the fellowship have been invaluable, facilitating my growth and learning throughout this journey of exploration and mastery.

Biggest lesson or Achievement

One of the biggest lessons I’ve learned from the fellowship is the importance of persistence and adaptability. Navigating and mastering new platforms like OSMCha and Osmose initially presented challenges, but these experiences have taught me to be resilient and resourceful. Ensuring the quality of data from mappers proved to be quite challenging, yet my biggest achievement lies in successfully overcoming these obstacles and contributing to the overall quality and accuracy of OSM data. Moreover, this journey has provided invaluable hands-on experience, broadening my professional skill set and reinforcing the significance of continuous learning and growth within the mapping community. It’s been a rewarding journey of both personal and professional development, highlighting the transformative power of perseverance and adaptability in achieving our goals.

Conclusion

The Guru Fellowship has been a transformative journey, enriching my understanding of open-mapping and its potential to drive positive change. The skills, connections, and experiences gained will continue to inspire and guide my contributions to the OSM community and beyond.

Location: Kampungbaru, Dom Aleixo, Dili, East Timor

OM Guru Journey

One of the best choices I’ve made in recent years was joining the Open Mapping Guru program initiated by the HOT Open Mapping Hub Asia Pacific. In 2024, I joined the validation track team. The challenges and tasks given each month are very interesting and help us, as OM Gurus, to make an impact on the community. So far, more than 300 tasks have been validated. However, that’s not all.

My Favorite Challenge

The OM Guru Climate Change Challenge is the peak of this year’s challenges, I must say. At first, I didn’t really pay much attention to the challenge since I saw many great teams out there ready for all the challenges. Until I saw a sub-challenge called the POI’s Mapping challenge. The best part is that for this challenge, I was only asked to map Points of Interest (POIs) in my area using local knowledge. Coincidentally, the area where I live, Bogor City and its surroundings, needed a significant data update. With my relatively high mobility in this area, I really used my local knowledge because I have almost passed through every corner of the city and some main roads I pass almost every week.

Surveying, Skating, Hanging Out

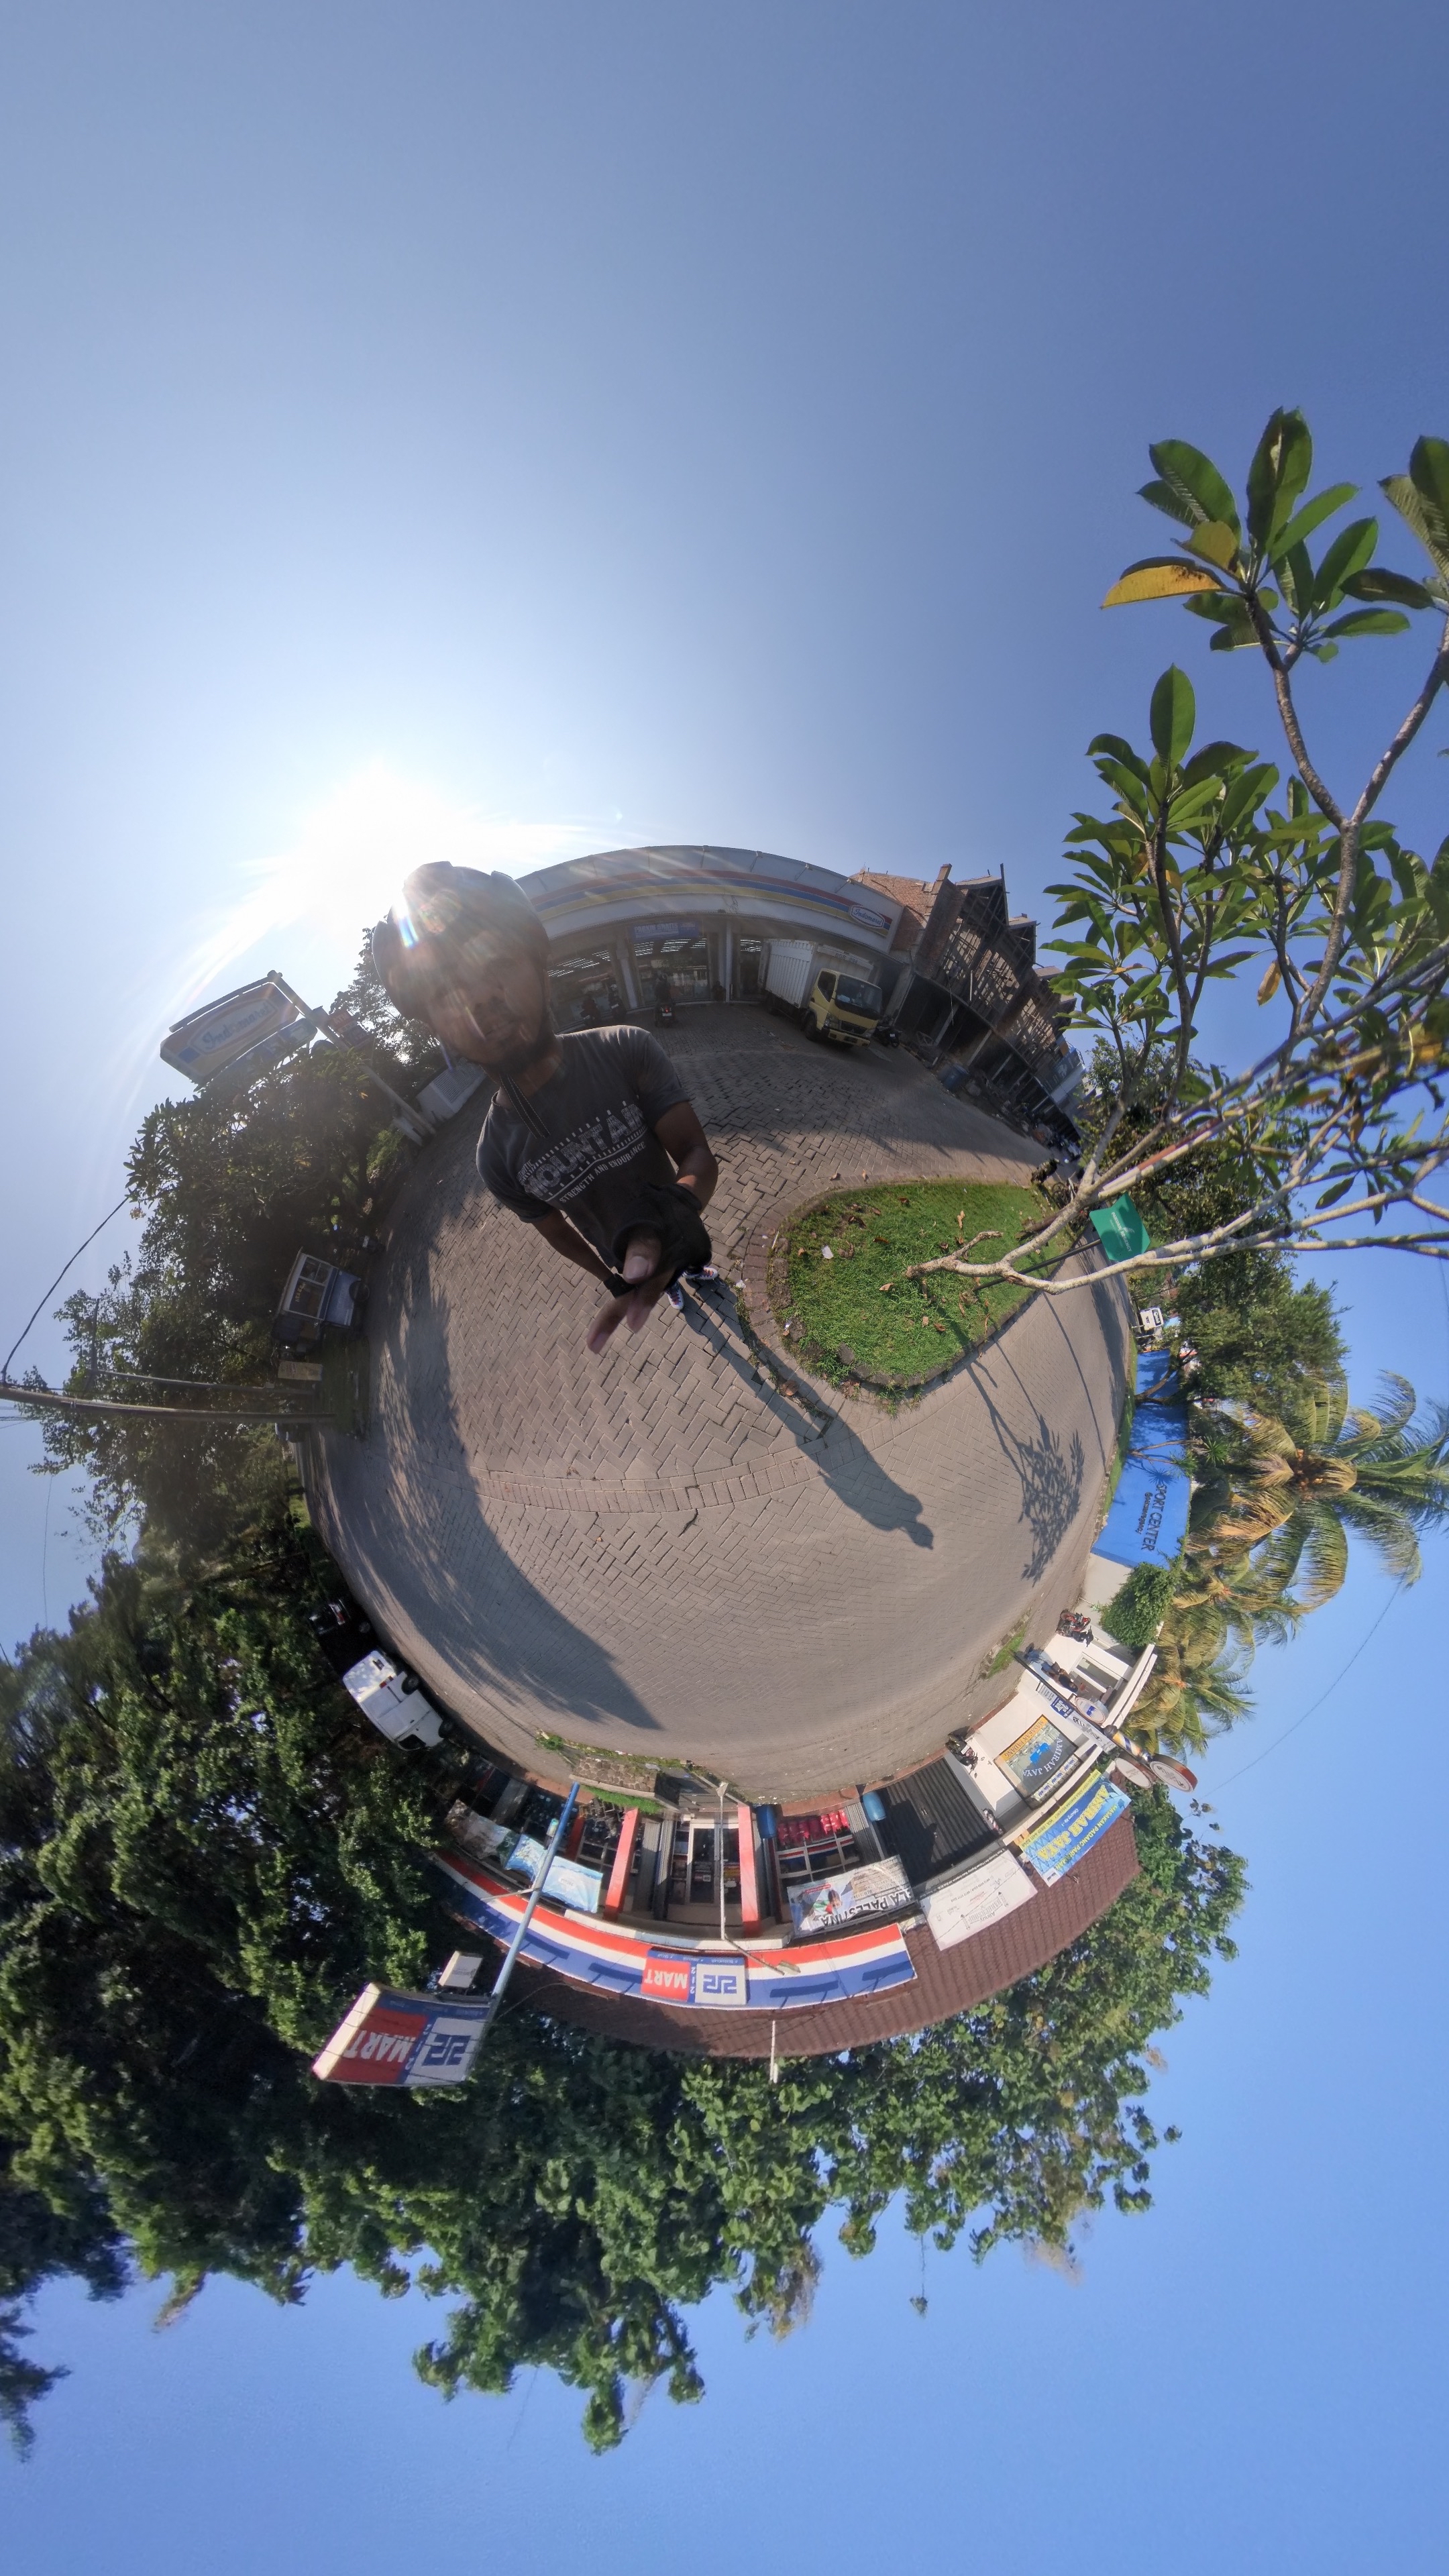
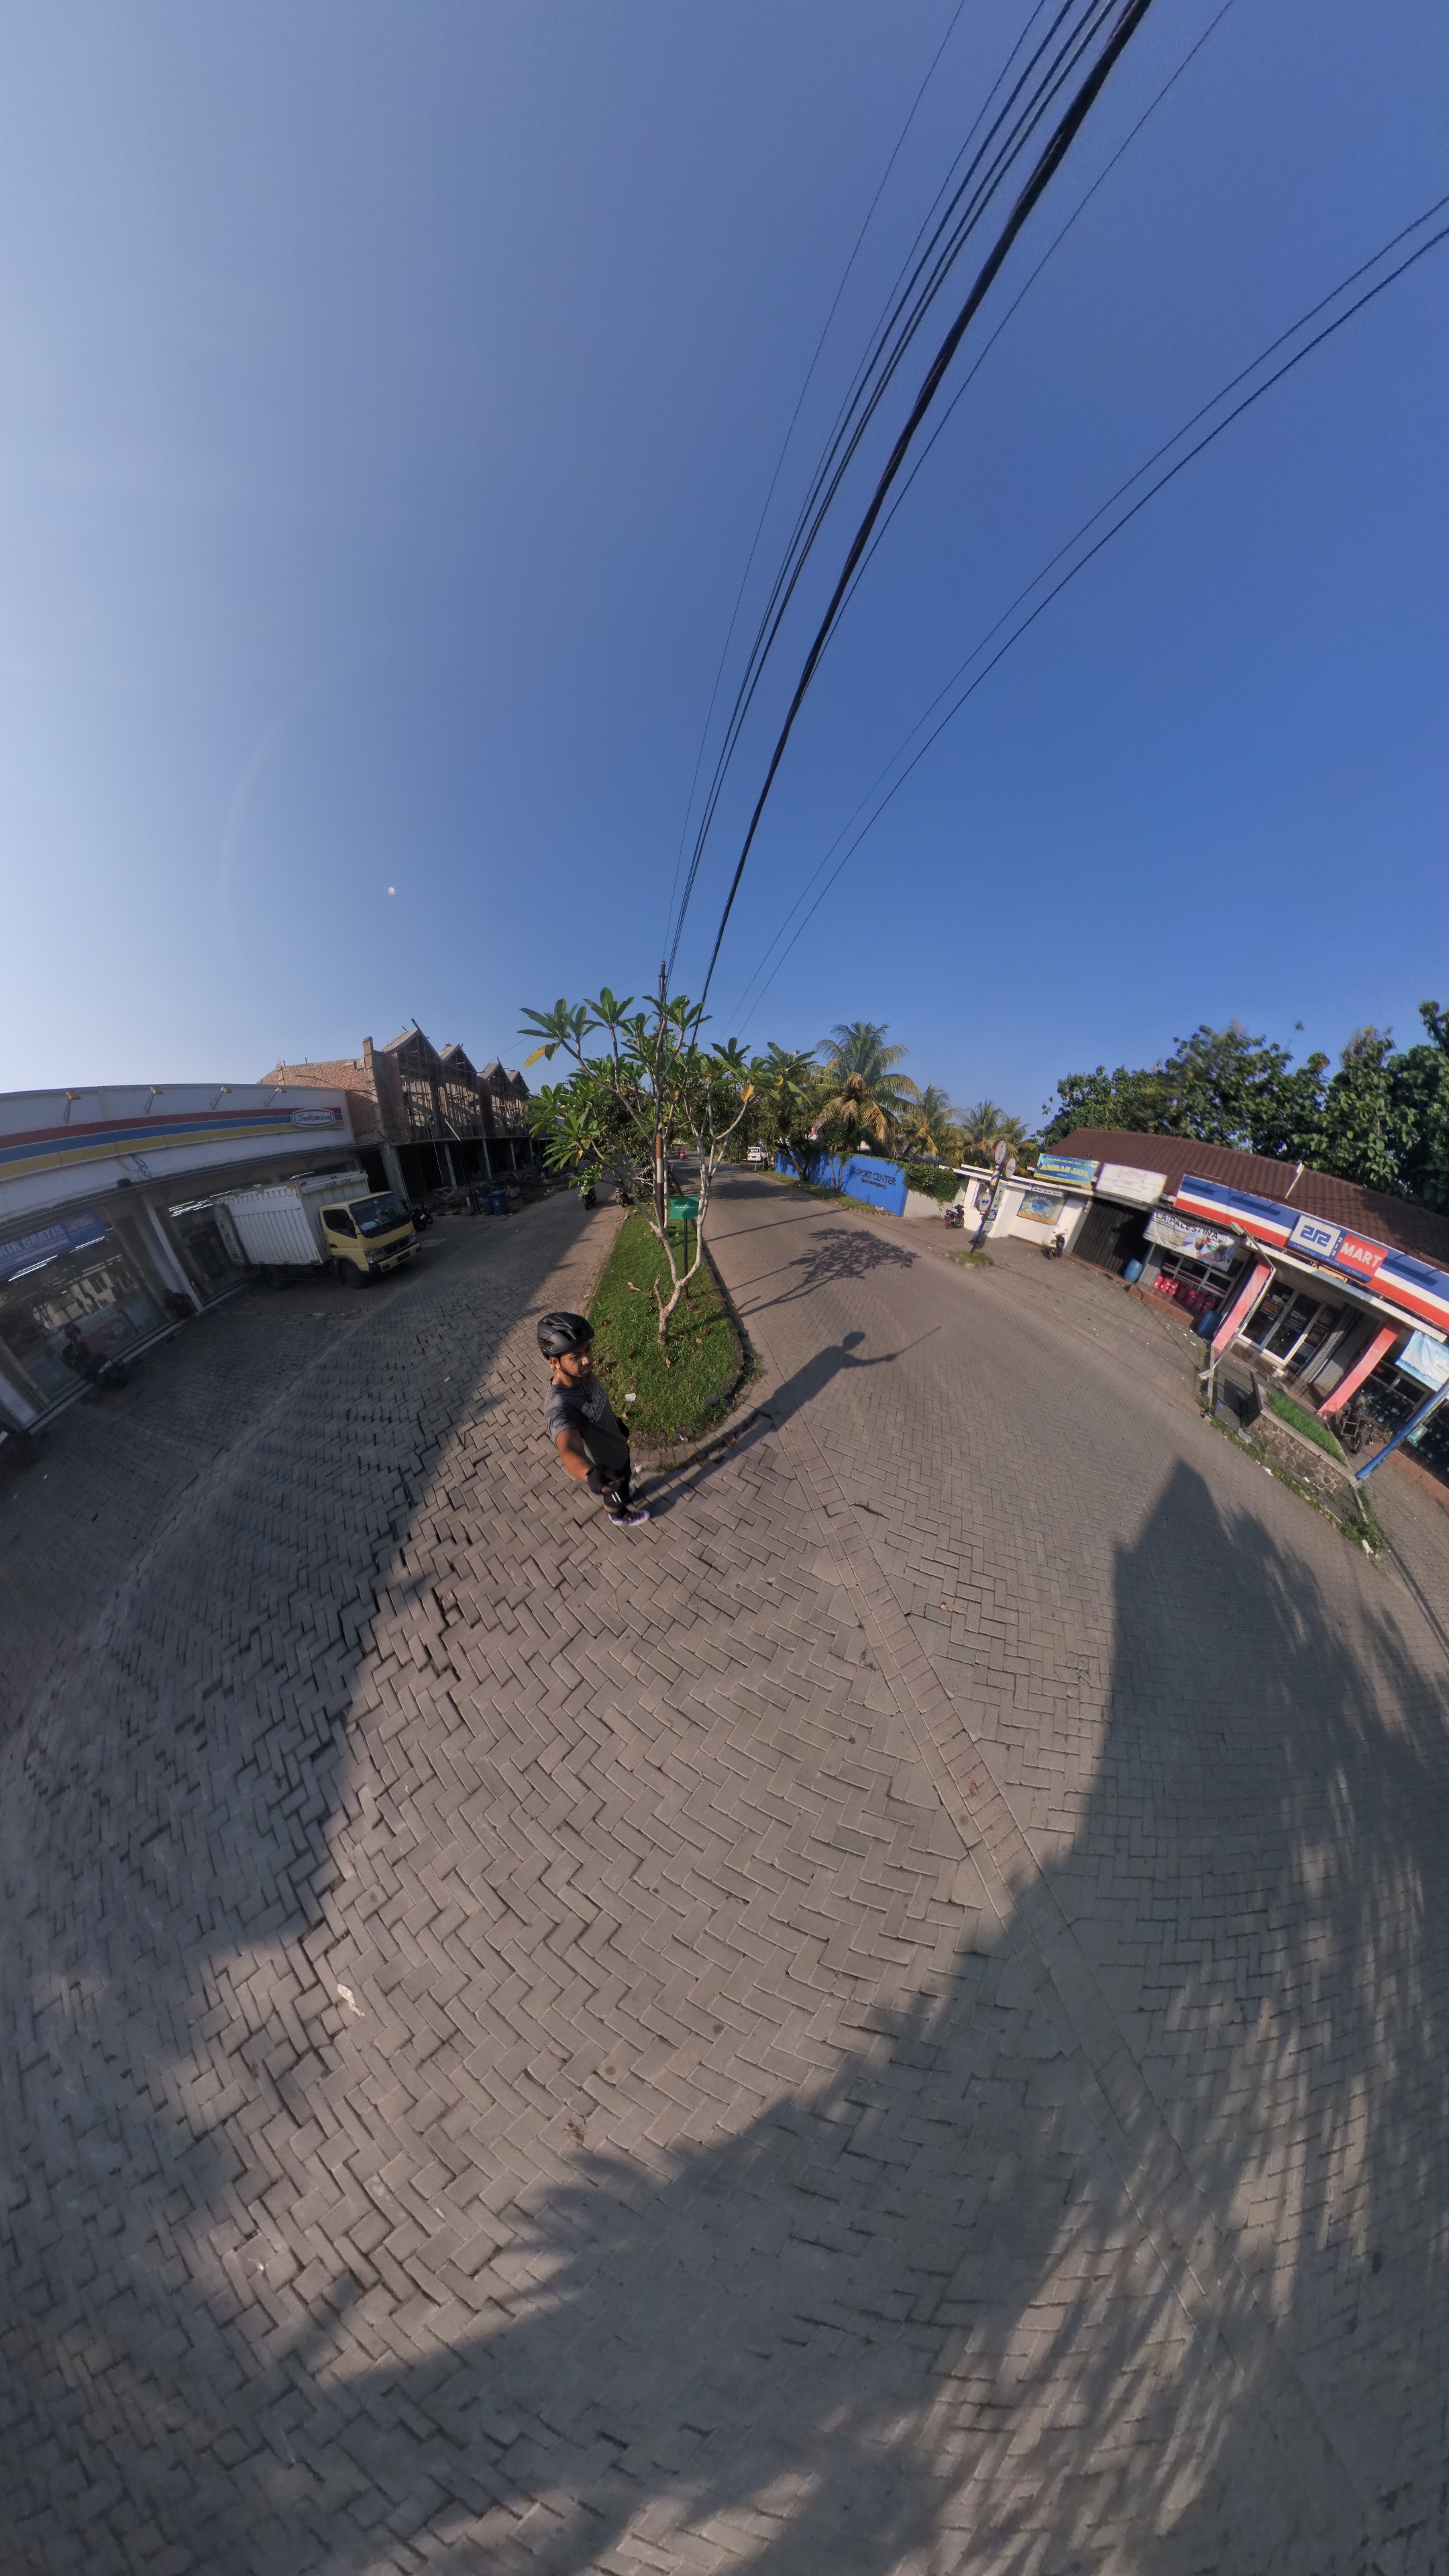
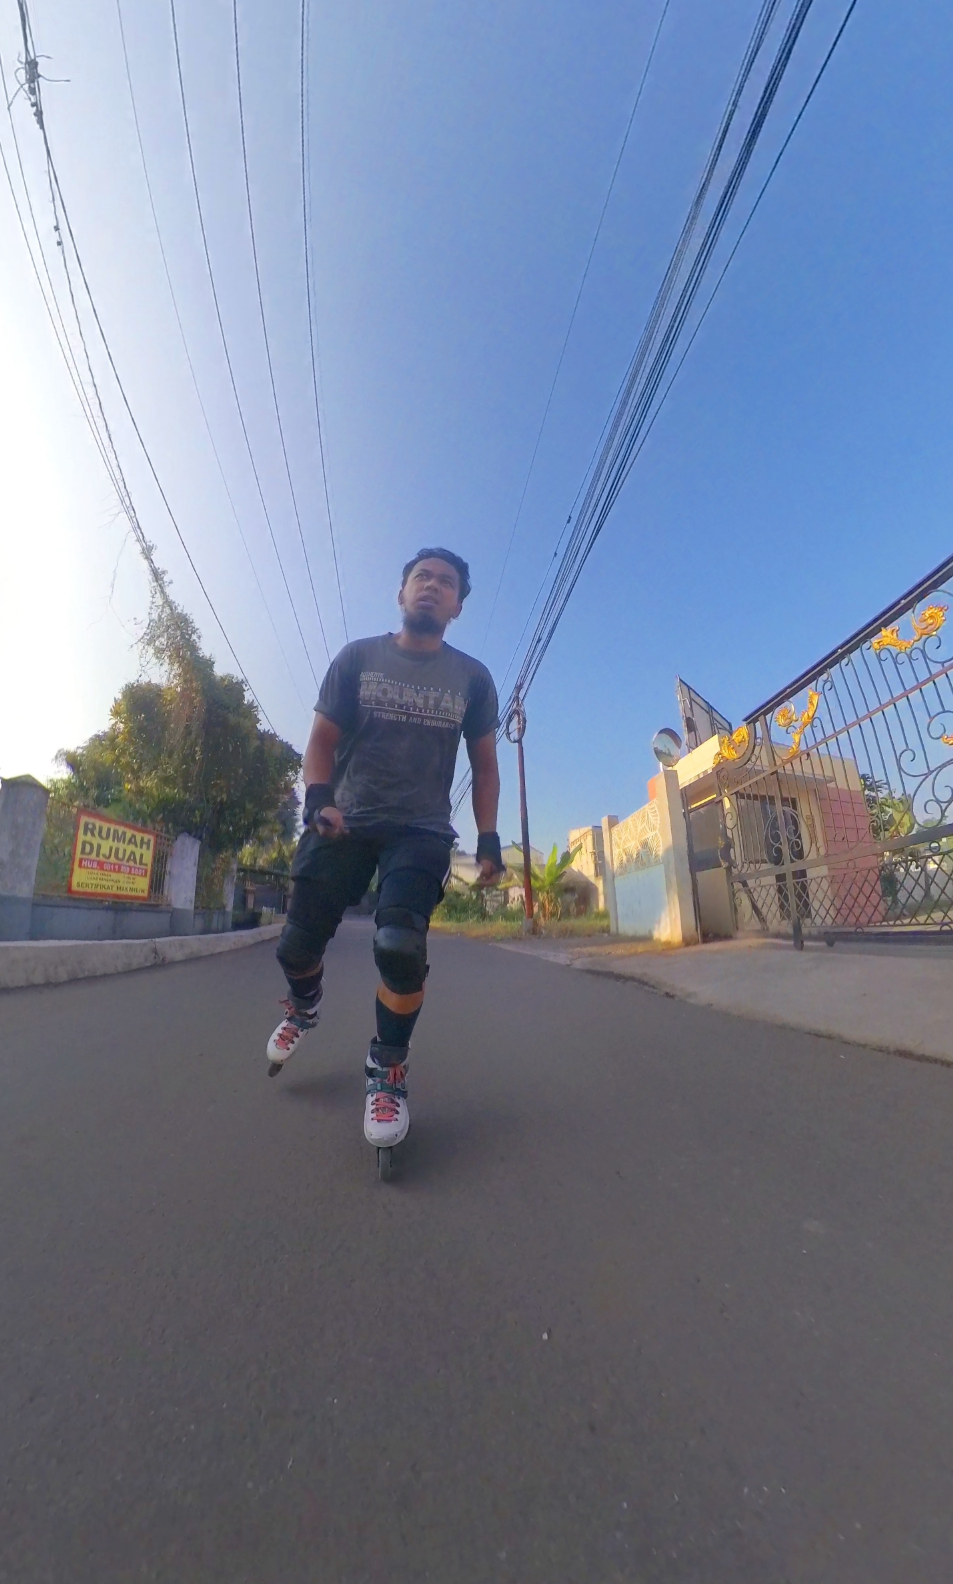
The way I update and gather each POI is basically by maximizing my daily mobility. From taking my wife shopping while observing the surroundings, walking around the mall and making observations and updates on POIs, and my favorite, observing POIs while roller skating at several spots in Bogor City. I don’t specifically set aside time for surveys; instead, every activity I do is essentially a survey, whether passing through main roads, minor roads, narrow alleys, or residential streets. Mostly, I added and updated amenities like place of worship (amenity=place_of_worship), bank (amenity=bank), atm (amenity=atm), cafe and restaurant (amenity=cafe/restaurant), school (amenity=school) and many more. 360camera

My Tools?

On my phone, I have the GoMap application for iOS installed, which I often use when going to the mall or a café with my wife while updating POIs in the surrounding area. However, the most powerful tool is the 360 camera that I always carry, especially when inline skating. With the ability to take 360 photos, I can see if there have been changes at certain points on the road because I worry that by the time I get home, I will forget the names of the POIs. With the 360 camera results, I just need to take one photo and then at home, I can simply recheck that one photo, which I can adjust the angle to look around. Sometimes from one 360 photo I can update more than 5 amenities. 360camera

Impact

Up to the time of writing this OSM Diary, I have successfully added and updated more than 1000 POIs in the Bogor City area with the help of GoMap, the 360 camera, and some help from StreetView Mapillary. This number will continue to grow. I also received a report from one of the residents in Bogor City through my friend that he was very happy because his child’s school location had been updated and corrected, as online transportation often picked up his child from the wrong location. At least one of the impacts I have made is reducing waiting time for someone waiting for online transportation.

Impression

The challenges given by OM Guru have given me the idea to continue updating in the city where I live using the resources I have. I will keep trying to update POIs while inline skating, especially! 360camera

Location: Pabaton, Bogor, West Java, Java, 16121, Indonesia

Today I mapped the village of Gjerë. According to OSM data, the village has a population of around 400. The houses are scattered around the huge territory and around farmlands. I also expanded a little and mapped the surrounding areas.

“#100VillagesIn100Days #Day6”

Location: Gjerë, Poroçan, Bashkia Gramsh, Elbasan County, Central Albania, 3308, Albania