OpenStreetMap

maning's Diary

Recent diary entries

OpenStreetMap Philippines 2020

Posted by maning on 25 January 2021 in English.

osmph-2020-montage

The pandemic changed the OSM-PH community plans for the year in 2020. In person meetups became online and we had to adjust our big plans for this new approach. I collected the publication materials we posted in our social media account to get a broad sense of what we did last year.

The montage above is a small collection of them. Some highlights.

  • Online events - we had more events than any other previous year. Online platforms allowed us to organize and reach more people. Most of these events were organized not entirely by the community but invitations from various groups (local and international). Pista ng Mapa, our major community event also adopted an online format and a surprising success!
  • Mapping - we had the highest number of unique contributors (10k) than previous years. The mapping activities completed baseline information in many areas notably HOT Philippines’ initiatives in Pampanga and Quezon City. Mikko and several mappers lead the effort to improve coverage to the top unmapped towns and completed several towns in Mindanao.
  • Recognitions - groups and individuals within our community were recognized for their mapping and community building efforts. UPRI Youthmappers were recognized for inspiring women in mapping and building mapping metrics. 3 Filipino mappers (feye, Mikko and Arnalie) become part of the growing HOT voting memberships. 2 long time community members (Maning for HOT and Eugene for OSMF) were elected as board members in two organizations crucial to the project growth.
  • Reclaiming our stories - Despite all our efforts within our local community, stories about how we got here are not amplified to the wider open mapping community. Biases and traditional perspectives on map making continues to undermine what we are trying to build: a more open and inclusive community. As a local community, we continue to question our own motivations and assumptions. David Garcia puts this nicely in 2 questions: “who are you making maps for?” and “who are you making maps with?”.

Thank you to all who made this possible. We’ve done so much last year and we are excited for this year.

The last point will continue to be our focus for the days and months ahead.

Location: Amihanan, Navotas, Cardona, Rizal, Calabarzon, 1950, Philippines

Taking community diversity and inclusion to the center stage

Posted by maning on 18 September 2020 in English. Last updated on 21 September 2020.

At OpenStreetMap related conferences, I always look forward to the technical talks so that I can learn and improve my mapping skills. Equally important are the community building talks, this gives me great perspective on how mapping communities are nurtured around the world especially for countries whom I share the local context and culture.

For a crowdsourcing online community like us, however, community stories are often relegated as side tracks or lightning talks in a smaller room. If we truly believe that the strength of OSM is the community, these stories should be front and center in our interactions especially during conferences.

This is what we tried to do within our own community events. Here are two events I helped co-organized that is aimed at increasing the audience listening to our community stories.

State of the [country] talks are plenary sessions in the State of the Map Asia in 2016.

We decided that all country status reports at SoTM-Asia in 2016 will be reported to the plenary. This ensures that everyone hear and learn how each country are building their own community.


Srividya sharing the State of Map in India during the SotM-Asia 2016 plenary (Quezon City, Philippines).

Pista ng Mapa 2019’s closing plenary session was led by Geoladies PH volunteers.

We made sure that our first Pista ng Mapa conference recognizes the efforts and stories of our women mappers and advocates. The final session at the end of the conference were spearheaded by women showcasing different women perspective in mapping. No other session was running at the same time.

photo_2020-09-18_12-13-43
Jen leading the Geoladies-PH plenary at Pista ng Mapa 2019 (Dumaguete City, Philippines, 2016).

We love to listen to your stories. Our second Pista ng Mapa this November will be online and free to everyone for a consecutive series of Friday sessions on November 13, 20, and 27, 2020.

If you have stories or maps/posters to share, grab the “speaker view” this November.

PnM2020_Virtual_general announcement

Photos/Artwork by: Mapbox, Leigh Lunas and PistaNgMapa 2020 Marketing team

way/445712235/extended_history

Posted by maning on 3 September 2020 in English.

This is OSM way/445712235. It was edited twice and has 9 nodes and 2 tags.

Screen Shot 2020-08-25 at 11 32 33

way/445712235 was created together with fisherfolks, its local government unit, a social action arm of a university, researchers and diving enthusiasts in Lian, Batangas. It was a culmination of years of grassroots organizing, research and community-based participatory mapping I was part of as a volunteer.

COSCA as the social action arm of the De La Salle University is working with the local fishing community in Kay Reyna (Lian, Batangas) through its community-based resource management program. Part of the community’s aspiration is to establish a community managed marine protected area (MPA) to protect and rehabilitate their marine ecosystem. During the summer of 2012, I was asked by friends to help in mapping Kay Reyna’s community-managed MPA.

My task is “simple”, grab a GPS and mark the location on the boundaries of the proposed MPA.

Community process for establishing the MPA

Prior to the actual day of MPA installation, the community has already conducted numerous community meetings and consultation about the benefits of establishing the MPA and which part of the sea will be delegated as limited access zones, protected zones, etc.

Screen Shot 2020-08-20 at 18 21 53

All the community concerns were collectively discussed and addressed. The final consensus was in favor of establishing the MPA and the long term benefits is positive both for their livelihood and the marine ecosystem surrounding the community.

Installing the MPA markers

During the actual MPA marker establishment we split our group to 3 boats.

The lead team is the first crew to proceed to the predetermined MPA boundary point. A couple of divers will then check if the designated spot does not have any coral that may be damaged when we drop the concrete anchor. Adjustments are decided depending on the condition of marine life underwater.

Screen Shot 2020-08-20 at 18 22 01
We need to avoid damaging coral like this.

On a bigger boat are the rest of the crew including all the materials needed to install the marker. These include a concrete anchor, ropes, floaters and flags made from recycled and locally available materials.

Screen Shot 2020-08-20 at 18 22 01

Once the location was determined safe to deploy, the bigger boat will proceed to the location to drop the anchor and tie the floating flag marker.

Screen Shot 2020-08-20 at 18 22 10

This work requires careful coordination. Each member of the team knows their role because we know that a simple mistake can lead to accident and injury to the divers or damage to the coral ecosystem.

I am really amazed at the skill of these fishermen. They “dance” under water.

Screen Shot 2020-08-20 at 18 22 01

Finally, my boat will proceed to the location to mark the position using a GPS.

Screen Shot 2020-08-20 at 18 22 10
Me at the rear end of the small boat, probably too dizzy to stand after a full day on the small boat

We repeat the same process for all the corners of the MPA.

Screen Shot 2020-08-25 at 11 27 08
Completed MPA border overlayed with the loopy GPS tracks.

Establishing the local ordinance for the MPA

In addition to physically marking the MPA boundaries, it is necessary to establish a local municipal ordinance for the MPA. The ordinance is a legal instrument that affirms the establishment and management of an MPA within the municipal waters under Fisheries Code of 1998 (Republic Act 8550).

The community has been working with the local government for years to secure this ordinance. During one of our MPA boundary installations the representative from the municipal government requested a map of the MPA as part of the document that will be used for crafting the ordinance. At the end of the day, we finalized the map (in QGIS) along with the detailed technical descriptions. We immediately sent it over for printing to the municipal office in time for the Fisheries and Aquatic Resources Management Council (FARMC) meeting. The council approved the ordinance.

The ordinance allowed the fisherfolk community to legally enforce guidelines and restrictions within the zones of the MPA.

I am personally proud to be part of this mapping activity. The collaboration process we went through captures what I believe to be what OpenStreetMap should aspire to be: community-driven and intentional with working within the local context. Mapping is only a small part of this initiative but it can amplify the great work that marginalized communities have been pursuing for decades in the Philippines.

Sidenote

This post is dedicated to Rey “Apyong” Pomarca. Apyong has been a community organizer for more than 3 decades. He is a great friend and cares deeply about the marginalized sectors he served. As a community organizer in Kay Reyna, he has facilitated all the work I shared on the sidelines. He died last month.

Screen Shot 2020-08-25 at 11 23 43
Salamat Apyong! (third person from left)! 🤟🏾

See also

Photo credits: Maning Sambale, Joey Rosal, Lian Fisherfolk Association

Location: Lumaniag, Lian, Batangas, Calabarzon, 4216, Philippines

HOT Board Candidate Statement 2020

Posted by maning on 19 July 2020 in English. Last updated on 24 September 2020.

Update: I was not elected in the previous election. HOT is doing another round this year, to fill-in for the remainder of the term of one borad member who resigned. I’m putting myself forward again. This diary will again serve as my statement.

👋🏾 This is Maning from the Philippines and I’m running for the HOT board election this year. I am a long time OpenStreetMap contributor focusing mostly in building the open mapping community in my country and in Asia.

Over the years, I have been working and living with marginalized sectors such as indigenous peoples, fishefolks, upland farmers and, urban poor communities. In most of these communities, the common struggle is always tied to a place or resource. The understanding of place is a powerful platform that enables conversation between those in the margins and those in power to negotiate and work together. This is the reason I focused my work to using geospatial technology for social justice and conservation. I believe OpenStreetMap and to an extent, HOT as an intermediary is powerful and can effect social change.

I believe my experience with working with marginalized sectors, open data/technology and building online communities in the Philippines can provide a unique perspective to the new challenges of HOT as an organization. However, I recognize that I lack the depth and experience, because I’ve never been a board member of an international organization.

To understand how HOT board operates, I talked to a number of people directly involved in HOT in the last few days. The conversations were insightful and gave me a good perspective on what I should care as a board member. Below is a distillation of these conversations and my personal opinion of what the organization should care about.

  • I care about how we build and empower communities. I define communities as the marginalized sectors we work with. Before collaborating with any sector, we need to ask if we are addressing the root cause of their struggle.
    • Will mapping buildings and roads help fishefolks secure their access to fishing grounds against big-time fishing operators?
    • Do indigenous communities even want to be in the map?
    • Will mapping routes used by internally displaced communities expose them to risk by oppressive authorities?
    • Do we listen to all community perspectives when we design projects?

These are hard questions we need to ask ourselves before any engagement. I don’t have the answer myself but the exercise of asking together with community is critical before taking any action.

  • I care about the mapping process and quality of the data we create. The OpenStreetMap community cares about the data they contribute to the project. There were frictions in the past of the quality of contributions through HOT projects. We need to address this. The data we create should not only address a purpose but also follow the collective quality standards set forth by the OSM community. Building the map is integral to the empowerment of the communities we work with. Do we involve the communities in the full process of map making rather than just source of information or data collectors?
  • I care about the sustainability of the tools and technologies we develop. HOT build incredible tools thoughout the years to support mapping. It’s been used even outside the context of humanitarian. We publish our code as open source. However, simply making it open source does not guarantee a developer community will thrive. Sometimes after an initial funding, development halts and the code rots. We need to find ways nurture our users and developers.
  • I care about our staff and members. Our HOT staff are taking enormous risks as they go about their roles especially in developing countries where security is uncertain. Sometimes, some members of the OSM community criticize the quality of their work because it JUST a job. I strongly disagree because it is precisely because it IS their job. Their way of life depends on it and loosing a job because of mediocre work means less food on the table. We need to ensure our staff are taken care of and they have the resources needed to do their job well.

These are my thoughts for now. I don’t have the full understanding on how we execute within the bounds of what I listed above but I do believe this introspection is important as the organization moves to take on the new challenges collectively.

Happy mapping!

Extracting building height from drone imagery

Posted by maning on 26 August 2019 in English. Last updated on 27 August 2019.

I experimented with extracting the heights values from the drone imagery and add them to the building polygons traced in OpenStreetMap. Read along if you want to understand the process or just go here to see it in action here!

3d 
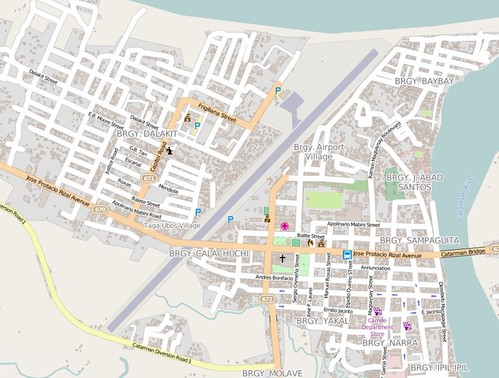
3D buildings around Foundation University, Dumaguete

Day 3 of Pista ng Mapa last Aug 3, 2019 was a series of field mapping activities. A couple of people did on the ground survey with field papers and mapillary. Our resident drone Mapher Leigh deployed her DJI Phantom 4 to survey the event venue and its surrounding community. Leigh uploaded all the drone derived data into OpenAerialMap including the elevation models! Using QGIS 3.6, I decided to explore ways to extract the heights from the derived DSM/DTM and use it for visualizing building polygons from OpenSteetMap.

For this exploration I used QGIS 3.6 with the GRASS GIS, Profile tool and QGIS2threejs plugin.

Downloading the drone derived layers from OpenAerialMap

  • The drone derived raster layers are available for download at OpenAerialMap. You will need the 3 rasters listed below:
Orthomosaic Digital Surface Model (DSM) Digital Terrain Model (DTM)
ortho dsm dtm

We will use the orthomosaic as a background base image for our visualization. The DSM and DTM layers will be used for extracting the height of buildings. I will not talk about the difference between DSM and DTM here, but here’s a nice explanation from gis.stackexchange.

Resampling the DTM and DSM to 1 meter pixel resolution

The DSM and DTM we downloaded have different pixel resolution, to simplify the process, we will interpolate both raster pixel values to a coarser resolution of 1 meter.

  • To resample to a coarser grid, we will use the GRASS GIS modules in QGIS. In the Processing toolbox, search for the r.resamp.stats.

  • Select the DTM raster layer to resample, choose average for the Aggregation method and 1.0 for GRASS GIS region cell size.

  • Save the file in your machine. The parameters I used are shown below:

Once you finished resampling the DTM, do the same process for the DSM.

Extracting height difference from DTM and DSM

Nest step is to subtract the values from DSM to the DTM to get a raster layer that only has the difference between the two. This will be the height value we will use for the buildings.

  • In the Processing dialog, search for r.mapcalc.simple
  • In the r.mapcalc.simple dialog, choose your dsm layer for Raster Layer A and your dtm layer for Raster Layer B. Select any raster layer for C-F (we will not use any of these layers but r.mapcalc.simple dialog requires all dropdown values to have a valid layer).
  • In the Formula field, type A-B. This formula is simple difference between the two rasters.
  • In the GRASS GIS region cell size, use 1.0
  • Finally, choose to either use a temporary file or to save to file in the Calculated field.

mapcalc

  • Once the process completes, a new raster layer will be displayed in your map canvass.

To visualize the data, you can use the Profile Tool plugin like shown below:

height-diff
Height in meters for each layer along the transect (red line in the map canvas). Red - calculated difference, blue - DSM, purple - DTM.

Download OSM buildings

Now that we have the raster layer for the height, we will add these values to OSM buildings.

  • Extract the buildings around the area using overpass-tubo
  • I used the following overpass code to get the buildings around Foundation University.

[out:xml]/*fixed by auto repair*/[timeout:25]; ( node["building"]({{bbox}}); way["building"]({{bbox}}); relation["building"]({{bbox}}); ); out meta;/*fixed by auto repair*/ >; out meta qt;/*fixed by auto repair*/

  • Once the extraction is complete, click Export and choose download/copy as GeoJSON
  • Add the data in QGIS.

Re-project the buildings to the same CRS of the raster layers

In order to get the height values from the calculated height difference raster, we need both layers in the same coordinate reference system (CRS).

  • To get the CRS of your rasters, select any of the raster within the Layers panel. Right-click and choose Properties. In the Layer Properties dialog, click on the Information tab. Our rasters are in EPSG:32651 - WGS 84 / UTM zone 51N - Projected CRS. We will use the same CRS for our building vector layer.
  • To export the building layer to the same CRS, select the building within the Layers panel. Right-click and choose Export > Save Feature As …
  • Choose any file format and filename but make sure to choose *EPSG:32651 - WGS 84 / UTM zone 51N as the CRS. Then click OK.

Get height of buildings from the calculated difference raster

Now that we have all data in the same CRS, we can start adding the height data from the raster layer to the building polygon.

  • In the Processing dialog, search for v.rast.stats.
  • In the v.rast-stats dialog, choose your building polygon in the Name of vector polygon map and the calculated heigh difference in the Name of raster map to calculate statistics from.
  • In the Column prefix for new attribute columns type height_.
  • Choose a filename to save your output and click Run.

  • Once the process completes, a new building vector layer will be added to your map canvas that includes the univariate statistics of each polygon in the attribute table.

  • Symbolize your map to show different colors of building according to height. In the image below, I used the median values (height__median) to show height for each building. I chose median value based on previous evaluation I did when we imported building heights in San Francisco from LiDAR derived data.

Visualize with QGIS2threejs plugin

Our processing is finally complete! We can start visualizing the heights in QGIS using the QGIS2ThreeJS plugin.

  • In the QGIS menu, click Web > QGIS2threejs > QGIS2threejs Exporter. A new window will be shown to configure the rendering of your 3D map.
  • Play around with the various parameters of the plugin to show the best results for your purpose. The following settings are what I used:
    • DEM - I used the dtm raster layer;
    • Polygon - I used the building vector with the extracted height values (Rast stats).
  • In the Rast stats Properties, I chose the following:
    • Object type - Extruded;
    • Z coordinate - Relative to the DTM layer;
    • Height - Using the expression dialog I added "height__median" * 1.2, this formula exaggerates the height of building by a factor of 1.2,

  • Once you are happy with the results, you can either export the visualization as an image or a webpage in the File menu of the QGIS2threejs Exporter

And its done! Run a local webserver then open the save index.html. See it in action here!

Some notes

  • Buildings partially covered by trees can have wrong height. This is because the DSM layer includes not only height of buildings but also of trees and other features for example, in this small building (median_height = 11.6 meters).

In such cases where there is a lot vegetation obscuring the building, median_height may not be be best metric to use.

  • This is not a full 3D, instead, it’s a “simple block model representation” (LOD1). My process cannot model roof structures or detailed architectural building models.

  • Can we use this process for mapping building:height in OpenStreetMap? Definitely, but this requires further calibration and ground validation. For example, I noticed height anomalies along the edge of the raster data. This is likely due to the height extraction used in processing the raw image files along the edges where there is not enough data.

  • Please share DSM/DTM data in OpenAerialMap. Extracting DSM/DTM from drone survey are fairly straightforward with the common processing tools like pix4d or OpenDroneMap. Although it will take more processing time, the benefits of using the DSM/DTM products along with the orthomosaic are huge. My appeal to all drone mappers uploading data in OpenAerialMap, please include the DSM/DTM. ;)

Give it a try with your own data and comment in this diary if I miss something. Happy mapping!

Location: Taclobo, Dumaguete, Negros Oriental, Central Visayas, Philippines

Lupang Arenda drone mapping - part 1

Posted by maning on 8 July 2019 in English. Last updated on 9 July 2019.

Last weekend, a couple of OSM volunteers and drone enthusiasts visited Lupang Arenda in Taytay, Rizal. The visit was part of the ongoing collaboration with Barangay Santa Ana in Taytay to use OpenStreetMap as one of their tools for managing community initiatives. The origins of this collaboration has an interesting back story but I won’t talk about it on this post. ;)

The main goal of the visit is to capture images using drones to create an updated aerial imagery of the community to identify individual building/houses. For a densely populated community like Lupang Arenda, it is difficult to get this level of detail using satellite imagery.


The crew. Photo by Erwin Olario.

After a few minutes of mission planning, we split the group into 3 teams. 2 teams deployed drones to capture overhead photos and 1 team installed action cams to the barangay vehicles to collect street-level photos. The drone team flew 5 times covering ~82 hectares or half of the whole community. After the collection, we then processed the drone imagery using OpenDroneMap to create high-resolution orthophoto.


Coverage of captured imagery

building_outline
Processed orthophoto and building outline from OpenStreetMap based on outdated satellite imagery.

The level of detail we captured are amazing! Aside from the original intent of using this imagery to update the building outline of individual houses, the imagery also reveals key community issues. Here’s a couple I was able to identify with just a quick pan and scan.

reclamation
Expansion of settlement continues towards the remaining wetlands of Laguna Lake.

new_construction
New structures under construction.

abandoned
Abandoned buildings which may require update of the barangay household survey database.

debris_blockage
Debris and garbage blocking access to some roads.

localized_flodding2 localized_flodding3
Localized flooding due to blocked drainage canals.

These are just a few spots I saw with a quick browse. We are very excited share back the output to the partner community and understand better how they will use the data. Imagery is now available at OpenAerialMap for anyone to use.

We are still not done, we will cover the other half of the community in future visits. Huge thanks to Bunny, Ian, Buboy, Leigh and Rally for volunteering a weekend of their busy schedule to doing this. Also thanks to Erwin, Kath and Marriane for organizing the activity.

Interested in using drone for your community mapping? Join Ian, Bunny and Leigh at the inaugural Pista ng Mapa this August in Dumaguete where they will share about their experience in flying and processing drone imagery.

Location: 1920, Rizal, Calabarzon, 1920, Philippines

A couple of weeks back, I was aimlessly panning around the Philippines in the OSM.org website and saw Banton island right at the center of the archipelago north of the Sibuyan Sea. I loaded the data in JOSM to check what was actually mapped in the island. It looks like it has decent coverage for roads and very few buildings. So I started adding a few buildings here and there and then it struck me, what would it take to systematically map the whole island remotely?


Banton Island in Romblon as viewed from a pump boat arriving from Marinduque. Photo credit: Lawrence Ruiz, Wikimedia Commons

This quest has begun …

Choosing the imagery

First, I checked if there are good imagery available other than Bing, I found that DigitalGlobe (DG) Premium and Standard looks more recent compared to Bing. Some areas are cloudy in Premium while clear in Standard and vice versa. I figured I can interchange these two depending on where I am mapping.

I then checked if there are GPS traces in OSM I can use to align DG imagery in case it has an offset. I found no traces in OSM, not even a sigle dot. Strava has no coverage too. I guess I will have to use the default referencing from DG. I confirmed if there are any large offset by comparing to Bing. Other than a few meters, I did not find large offsets.

Using Facebook’s ML derived settlement data in Maproulette

The island is mostly covered by thick vegetation of forest, scrub and coconut orchards. Just panning around the island trying to find a small hut underneath the foilage is too laborious. So I thought of using Facebook’s High Resolution Settlement Layer (HRSL) as a guide to identify the location of settlements. According to HRSL’s metadata, the settlement raster is a “30m pixel where buildings where detected with imagery”.

I converted the HRSL raster to vector polygons. This layer gave me rough indication where to map or at least pan around the surrounding area of the grid. I then created a Maproulette challenge using the extracted HRSL polygon. With Maproulette, I can easily track which parts of the island I have not visited/traced buildings.

HRSL grid
HRSL grids showing porbably location of settlements.

It took me about a week of casual mapping to finish the whole challenge. In additon to buildings, I also added and aligned roads, updated the coastline and moved the village nodes closer to the center of the settlements. In areas where HRSL was absent but settlements exist in the imagery I buildings as well.

Outcomes

Improved data coverage

Here’s the before and after data for buildings (cyan).

Before After
highway (km) - 41.7
building (n) - 82
highway (km) - 53.9
building (n) - 1,862

With a few hours of mapping for a week, I was able to improve road coverage by 1.2x and buildings by 22x.

Tasking efficiency

Using FB’s HRSL data as a rough guide for tasking prioritization definitely helped me organize the work. The whole island covers ~31,000 30x30m grids. Using HRSL narrowed it down to only 535 grids (1.7% of the whole island).


Comparison of 30x30m grid where HRSL data detected settlements and buildings mapped in OSM.

Category N (%) Color
HRSL grid with OSM building traced 361 (~24.4%) blue
Non-HRSL grid with OSM building traced 944 (~63.8%) orange
HRSL grid without OSM building traced 174 (~11.8%) red
Total 1,479  

For large scale mapping effort especially during crisis response, HRSL can be a good proxy to direct mappers areas to focus to get maximum mapping coverage. However, there are areas in the island where I traced buildings but were not detected by FB’s algorithm (~63.8%). Possible reasons are:

  • imagery used for detection is outdated (2012-05-08) compared to DG’s imagery I used for tracing, unfortunately, I cannot confirm the actual date of DG’s imagery in JOSM;
  • depending on the date of capture, many isolated houses are obscured by the thick vegetation and thus not detected by their algorithm, I experienced the same problem when swtiching from DG premium and standard.

Here’s a few zoom-in images for detailed comparison.


Barangay Poblacion. The largest concentration of settlements in the island, the blue grids confirms presence of settlements in HRSL and presence of buildings in OSM.


Barangay Tongonan. Only a few grids of settlement were detected by HRSL within the surrounding areas of Tongonan Elementary School. Most of the isolated buildings were mapped from DG imagery (yellow grids).


Barangay Yabawon. The false positive (red grids) along the coast from HRSL were mostly high reflectance surfaces such as bare rock, beaches and sea waves which are similar to roofs of houses

In summary, FB’s HRSL data is a great resource for scoping initial areas to conduct mapping in the absence of ground truth information. In most cases, it correctly identified contiguous areas of settlement. During HOT crisis activation, for example, information from the ground is scarse during the onset of the event, we can use HRSL to define initial areas of interest (AOI) for coordinating mapping. However, it does not guarantee completeness (at least in the island I used for this test) because depending on the imagery (recency and quality), isolated settlements maybe missed by the detection.

Is it complete? Definitely not, but that is as far as what I can do given the the current sources available. Of course this was done remotely, I hope this is a good starting point for future mappers who will visit this island.

Finally, there are 11 mappers who mapped this island before this quest. Thank you to droki, JAT86, burts, PelleB, Shaun Austin, Evelyn Desouzaa, yawor_89, LordOfMaps, 5EE, behappy24, ed_waypointsdotph!

Do you have a mapping quest you want to share? We love to hear them at the inaugural Pista ng Mapa conference in Dumaguete this Aug 1-3, 2019, come join us! To register, visit https://ti.to/pistangmapa/2019.

See also

Happy mapping!

Location: Tan-ag, Banton, Romblon, Mimaropa, Philippines

My Mapillary Trips

Posted by maning on 17 June 2019 in English.

I’ve been collecting geo-referenced photos since I started contributing to OpenStreetMap. When I discovered Mapillary a few years ago, I decided to upload these photos so that other people can use them in their own mapping.

grafitti
Street art in Marikina’s freedom wall

Here’s a few sequence I found interesting to revisit whenever I go to the Mapillary website (links to each sequence are included for viewing the high-res photos). They are categorized according to the mode of travel.

☑️ 🚶

walk_mapillary
University steps, Philippines - I used to work within a university campus, part of my daily commute is to carry my bike on a footway with ~90-steps. It’s always a challenge to do this every morning!

walk2_mapillary
Bahubali monolith, Vindhyagiri Hill, India - When I moved to India, my colleagues would take me to temples outside of Bangalore. Here’s the interior of the Jain temple of Bahubali above a hill in Shravanabelagola in Hassan. Temples in India only allows walking on foot starting from the climb up the hill and into the complex.

pamilacan
Bohol, Philippines - A casual walk around an island with white sand beach.

☑️ 🚲

cycle_mapillary
Marikina River Park, Philippines - Cycling is my preferred mode of travel. On weekends, I usually take my kids to the nearby riverside park for casual cycling. Mounting the camera allows me to do surveying too!

☑️ 🚣 🛳

boat_mapillary
Venice Grand Canal, Italy - Travelling Venice is only possible by boat, what a great way to experience photo mapping through the Grand Canal!

kayak_mapillary
Mangrove forest, Philippines - While doing a university research for monitoring recovery of mangrove forest, the only way to survey is by air or through the muddy substrate. This time I opted to use a kayak.

☑️ 🚗

car_mapillary
Mindanao refugee camp, Philippines - When the Mamasapano clash happened. A lot of civilian were displaced in the surrounding towns due to the military operations. I worked with the regional response agency in mapping and documenting the IDP camps around the region. In most cases, it is the first time these informal camps were documented in a digital map.

car2_mapillary
TY Haiyan affected communities, Philippines - In the aftermath of the Typhoon Haiyan/Yolanda, there is an urgency to map and document the damage for the post-recovery efforts. I visited a lot of these areas as part of my work. My camera took continuous shots for most of the trip.

Next? 🐴 ✈️ 🚅 🚀 🎈 🚡

Who knows? I plan to continue collecting and sharing photos in Mapillary, maybe with other mode of transport. 😛

Do you want to know more about collecting street-level photos? We have an exciting session about that in the inaugural Pista ng Mapa in Dumaguete on Aug 1-3. Come join us and you might get nice schwags from Mapillary!

Marikina Mapping Party Jan 26, 2019

Posted by maning on 26 January 2019 in English.

It’s been a while since I joined a mapping party. Today, it was right around my turf.

Happy to see old and new mappers! 😊

     
2019-01-26 16 31 12 2019-01-26 16 31 01 2019-01-26 16 31 50

Now I need to go through 13 GB street photos. 😱 screen shot 2019-01-26 at 15 49 22

But how do I tag this one? highway=polka_dots? 🤔 screen shot 2019-01-26 at 16 18 41

Photos by Erwin and Maning.

Location: Concepcion Dos, District II, Marikina, Eastern Manila District, Metro Manila, 1811, Philippines

blend
Building detection at Villa Imelda, MacArthur.

For the last couple of weekends I’ve been tinkering with Robosat to detect features from aerial imagery. At its core RoboSat is using state of the art fully convolutional neural network architectures for semantic segmentation.

Daniel posted an excellent walk-through to run the RoboSat pipeline on openly available drone imagery in Tanzania.

This post follows Daniel’s guide for detecting buildings in drone imagery in the Philippines. The goal of this exercise is for me to understand the basics of the pipeline and find ways to use the tool in identifying remote settlements from high resolution imagery (i.e drones). I’m not aiming for pixel-perfect detection (i.e precise geometry of the building). My main question is whether it can help direct a human mapper focus on specific areas in the imagery to map in OpenStreetMap.

Daniel already outlined the step-by-step process. This post will focus primarily on the data preparation. To be able to build a robust model for feature extraction it is important to create a clean dataset as input to training your model.

The data

Dan Joseph from the American Red Cross collected a lot of drone imagery in Visayas, PH summer of last year. Thanks Dan and ARC! 🙇‍. I chose these images to start with my experiment because of the amazing resolution (up to 2 — 3 cm) and Dan and his team used this imagery to trace buildings which I can use for training the model.

The imagery is available in OpenAerialMap as individual TMS or GeoTIFFs — no composite seems to be available. In order for me to collect enough samples I needed to get images and masks from several of these GeoTIFFs or their corresponding TMS endpoint.

Data preparation

I downloaded several of the GeoTIFFs and clipped the OSM buildings from the bounding boxes of each imagery. These buildings will be used as training labels. But this is not enough, “presence” (positive samples) data will only give so much reliability, we also need to provide our model with “absence” (negative samples) data. Here’s an example of the data I traced using QGIS in addition to the buildings from OSM to bootstrap my negative samples.

imagery bounds > imagery > building > other cover types.

Cleaning the “presence” data

As illustrated above, drone imagery usually don’t have a squarish boundary so using the bounding boxes to clip data from OSM is not optimal. You will get black tiles with buildings which can affect your model. In my initial data prep I got images like this in my training samples.

No imagery, but with buildings in OSM.

The are two options to clean the data, you can:

  • run rs cover, rs download and rs rasterize for all the images then delete these tiles or,
  • delete the buildings outside of the actual boundary of the imagery in QGS (you can do this too in JOSM, but make sure you don’t upload 😉 )

I chose the former approach because its faster. There may also be cases when the building polygon is not aligned to the imagery particularly when it was traced from another imagery source. Fortunately ,this is very minimal in my sampling areas and these smaller problems won’t be a problem during training as long as there is not a large constant bias in the dataset.

Adding “absence” data

For adding negative samples, I traced several polygons representing common landcover types such as roads, water/riverbeds, orchards, farmland (wet and dry) and bare areas. I added various landcover types so that the model can learn that these are not the features it should detect. In order to avoid overlapping with the building tiles I overlayed a z21 tile boundary in QGIS and only traced landcover type the does not overlap with a building poly.

Now that I have both positive and negative polygons, I need to run rs cover, rs download and rs rasterize to create a slippymap directory with images and rasterized buildings. Since I have to do this in all individual imagery, I created a script that loop through each imagery list from OpenAerialMap. Run the script for your positive and and negative samples snd combine samples in a single directory using rsync.

# Combine negative and postive samples to one slippymap directory

mkdir combine-images
rsync -vrh positive-images/21 combine-images/
rsync -vrh negative-images/21 combine-images/

# do the same for the rasterize output

In total I have 15,237 samples at zoom level 21. 7104 (46%) for presence of buildings and, 8,133 (54%) absence (negatives).

Training the model

Once data is ready, I can start training the model. I need to split the imagery and mask tiles into training, validation and a final evaluation dataset using rs subset. For my sample I split them into training 80%, validation 10%, and evaluation 10%.

Then run rs weight to calculate the class distribution of the masks in your dataset. Save the result of rs weights in your RoboSat dataset configuration file (dataset-building.toml).

Finally, start training the model. I used a GPU capable (aws p2x.large) machine to run the training.

./rs train --model config/model-unet.toml --dataset config/dataset-building.toml

In my training, I chose 4 as my batch size and 50 epochs. The checkpoints are saved after each epoch for evaluation. Once the training is done, the results are visualized on the saved plot files like below.

The main indicator to choosing which checkpoint to use for prediction is the validation mean IoU. In my trained model the highest mean validation IoU (~0.82) was at epoch 40.

Visualizing the result

Before running the trained model to another imagery, I visually inspected the results using my evaluation dataset. This is a good dataset to use since it was never “seen” by the model during the training process.

# Run prediction to the evaluation data
./rs predict --tile_size 256 --model config/model-unet-maning.toml --dataset config/dataset-building.toml --checkpoint tmp/pth/checkpoint-00040-of-00050.pth dataset/evaluation/images/ evaluation-segmentation/

# Get masks from segmentation probabilities
./rs masks evaluation-masks/ evaluation-segmenttation

# Compare images, segmentation and masks
./rs compare evaluation-compare/ dataset/evaluation/images/ evaluation-segmentation/ evaluation-masks/

Here are some results of the prediction (imagery-left, segmentation probability-middle, mask-right).

Good detection

Not so good

In most cases, the prediction looks pretty good except for landcover types that are very similar to building rooftops like paved highways, vehicle or when the structure is covered by trees. But overall I’m satisfied with the initial result.

Putting it all together

Now that I have trained model, I used it to predict detection in another imagery. Instead of downloading the tiles from OAM, I used Daniel’s tiler script to create tiles from a GeoTIFF.

python3 tiler.py --zoom 20 660c5321-0334-471f-bca5-829d85fb1d40.tif 660c5321-images/

Delete completely blank tiles to prevent running the prediction on them (these are mostly found on the edges of the imagery boundary). This speeds up your prediction time.

find . -name "*.webp" -size -190c -delete #the filesize will depend on your imagery, make sure to delete only the blank tiles.

Run the prediction.

./rs predict --tile_size 256 --model config/model-unet-maning.toml --dataset config/dataset-building.toml --checkpoint tmp/pth/checkpoint-00040-of-00050.pth 660c5321-images 660c5321-segmentation

To visualize in a map, I created a leaflet side-by-side webmap to compare the predicted segmentation probabilities and the imagery. See the result here.

Of course, I had to load the data into an OSM editor! So I blended the imagery and segmentation together using imagemagick.

Give it a try! Go to OSM and copy the TMS endpoint below in ID’s custom background imagery.

https://s3.amazonaws.com/maning-robosat/660c5321-blend/{z}/{x}/{y}.png

Takeaways

  • The process is straightforward, thanks to Daniel’s and Bhargav’s excellent README and diary posts. Part of this experiment is to confirm that anyone can do it without any knowledge of machine learning and I confirm it is possible. I have started reading some ML basics though to know more. This fastai lesson 0 video is a great introduction to the concept.
  • We can leverage open data and open source to build ML based detection models. All data (buildings from OSM, imagery from OpenAerilaMap) and tools (Robosat, QGIS) all free and openly accessible. This experiment won’t be possible without access to these data and tools.
  • It is critical that you have a clean data that you feed to the model prediction (GIGO). In my initial iterations the results were really bad because I did not include enough negative training samples. The outcome of your model highly depends on the training data you provide it.
  • A lot of data preparation can be done on a modest laptop. I only used a GPU capable machine for model training. What will take weeks to do the training on a CPU will take only hours with a GPU. In my case I deployed a p2.xlarge instance from AWS. This cost money, an ondemand p2.xlarge in in aws costs USD 0.9/hour. My current bill is around USD 50 after 4 iterations of model training.
  • I had fun! At first running a full machine learning stack seems daunting but RoboSat makes it so simple.

What’s next

The past few weekends was really fun, I plan to continue iterating on the training models and share back results (more visualizations in this repo). I had discussions with several friends doing drone capture and they think automated detection like this can help in the initial assessment of an area say after a crisis. Next time, I want to explore:

  • add more training samples into my current model using various drone imagery;
  • creating models for other feature types;
  • convert the result into vector (rs features) and feed it directly to the editor or a tasking tool.
  • publish my model for anyone to use, let me know in comments 👋 here if you want to test my models.

Give robosat a try! The devs are more than happy to help you along the way!

Location: Danao, Javier, 5th District, Leyte, Eastern Visayas, 6511, Philippines

Nodes in Asian cities in the last 10 years

Posted by maning on 29 September 2016 in English.

Intrigued by Alan McConchie’s presentation on OpenStreetMap past(s), OpenStreetMap future(s), I took a stab at looking at several cities in Asia using a similar approach at charting nodes creation and modification. In his talk, Alan gave a portrayed an ideal scenario where the data is constantly-maintained reaching a state of singularity. Are we seeing any of this trend in Asia?

The only non-Asian city I included is Berlin, Germany (in thick grey). This will be my benchmark as it is widely known that the German community is one of the most active in our community. I intentionally won’t draw specific conclusion to any of the city listed here. Each community is unique and deserves an in-depth look on its own but, I am posting questions that interest me by looking at the charts. Of course, everyone is welcome to share their own insight in the comments!

Cumulative nodes created and edited in the last 10 years

all_nodes_year

all_nodes_year_anim

Cumulative nodes created (x) versus edited (y)

new_edit_5m At 5 million node limit

new_edit_3m At 3.5 million node limit

new_edit_1m At 1 million node limit

Some questions

  • Most cities had its first edit since the beginning of 2007, but mapping really took-off around 2011. Why is that?
  • Compared to Berlin, the cities that has a constant steep upward slope through time are Tokyo, Manila and Bangalore, is this an indication of an active community?
  • What’s up with Bangalore? There’s striking increase of creation/modifaction middle of 2015.
  • The singularity model doesn’t appear in any of the city. Even for Berlin, the ratio is ~2 creations to 1 modification. No Asian city got this proportion at all. Are we seeing a Borgesian trend in Asian cities or this is just an indication of a young but slowly growing community?

I look forward to any of your insight, please post them here. I am also excited to meet some of our Asian mappers this weekend at the State of the Map Asia. I’m hoping the State of the Country talks can shed more light to what’s happening in these cities. :)

Caveats

Data came from Geofabrik’s country pbf extracts as of Aug 2016. This is not the full history, so deleted nodes were not counted.

10 years

Posted by maning on 16 January 2016 in English.

This week, I just realized it’s been 10 years since I signed up for an OSM account! I never realized I continue to contribute and learn from this community. Some personal anecdotes of the past 10 years below.

My earliest fieldmapping in OSM. CC-BY-SA

The signup

Around 2004-05, I was doing my MS research on forest fragmentation. Back then, we had to do all our remote sensing analysis in the university lab because we only use proprietary software which we can’t use at home. For my research, I decide to use FOSS tools so that I can do it outside the lab. I stumbled into GRASS GIS and QGIS and started compiling from source. Through trial and error, I learned enough of the tools that I can do any mapping related using FOSS. Armed with new found knowledge, I started looking for free geographic data. Surely, if there are free tools you can also get free data. The only free data I found was LANDSAT imagery and low resolution Digital Chart of the World. I continued my quest and later found out about OpenStreetMap. I signed-up hoping I can get data for the Philippines. Only to find out that nothing not even a country name node exist! :(

But OSM gave me one hope, you can create your own data! So I decided, if I can’t get free data, let’s build it from scratch and share to anyone!

I tried using the online JAVA applet editor, but it was too painful. It was very slow and I can’t find any features to trace from the coarse LANDSAT imagery.

Metro Manila early coverage. CC-BY-SA

GPS rigging

Nearly 10 months later, I discovered JOSM which you can use offline and upload later. This encouraged me to start doodling nodes/segments/ways but there’s nothing much you can do with a smudgy LANDSAT imagery. The only way I can contribute more is to get a GPS device. So I borrowed one, those good old yellow Etrex. I had to rig a data cable from old credit card and PS/2 mouse to get the data from the device.

DIY GPS data cable

Know, I can contribute more, I started walking around my neighborhood and tried to map as much as I can. My mapping patch started to take shape. First roads, then POIs and so on.

GPS tracks around Marikina, mostly mine. CC-BY-SA

As I map my own little patch, I hang around the talk@osm list asking n00bs questions. I found out that in the UK, there is am a small but active community around the project. They organize mapping parties, meetups in pubs, etc. I realized we should also build a local community here. I tried shouting to the list if there are other Filipino or anyone mapping the Philippines. One guy replied, it was Mike Collinson. It turned put he travels a lot in the Philippines and was also looking for fellow mappers. He started the PH wiki page and we setup the mailinglist.

When Yahoo! gave permission to use their imagery for tracing, more contributors started mapping in Metro Manila and more people joined our mailinglist.

I was able to save some money and finally bought a Garmin device where you can load custom maps. I experimented with mkgmap and started building our own OSM derived Garmin maps for anyone can download for free.

OSM in Garmin. CC-BY-SA

During one of Mike’s trip to Manila, we met and talked about how to sustain build the local community. GPS was really expensive at that time so we decided if we can get some and share to anyone interested so they can map their own neighborhood. I applied for the GPStogo program by OSMF and was able to get 4 GT-31 loggers.

gpstogo

GPStogo units.

Building the community

We slowly grew and started doing outreach to other interest groups, first with GPS enthusiasts to demo how they can use the map in their own devices. Later with universities and mapping groups.

Rally, teaching university students how to use a GPS. CC-BY-SA

We ran mapping parties and piggyback on other events to promote the project.

tagaytay

First Mapping Party, Tagaytay City. CC-BY-SA

The map continues to grow as well as the community. Despite all this, we get criticisms from so called professionals:

“I suggest that you should invite a mapping professional into your group. Mapping is not a kiddy thing. It requires knowledge on Geometric Geodesy and GPS Systematic Errors. Without the required knowledge, doing mapping is just like wearing a blindfold blindly.”

Humanitarian mapping

Most of the volunteers see this OSMing as something fun. We use it mostly for our personal travels. It wasn’t until Typhoon Ondoy when we realized we can use the data for disaster response.

Mapaction’s first use of OSM data in the Philippines during Typhoon Ondoy/Ketsana, CC-BY-SA

This started my passion for contributing to the Humanitarian OpenStreetMap Team. First for every disaster in my country,

OSM poster maps during Typhoon Yolanda/Haiyan. Photo by Joe Lowry-IOM.

and later, to other parts of the world.

Lower Shire Mapping Team, Malawi. Emir Hartato, CC BY-SA

I learned a lot from this project and continues to share to those who want to listen. Whenever there is chance, I talk to events and conferences about the project. I’ve met and collaborated with many people within my community and around the world.

SOTM-PH Lightning talk at SOTM 2011 in Denver.

Next

More than 3 months ago, I started working with the data team at Mapbox. I moved to Bangalore to join a young group OSMers improving the map daily. Although we sometimes receive criticisms from a few community members being paid mappers, I know my team cares about the project as much as any other OSM contributor.

Being away from home, I cannot contribute to the Philippines as much as I would like to other than fixing and cleaning my previous cruft, I maintain my connections with the local community through the list and chat.

PS. FYI, I have 3 OSM accounts, 1, 2, 3.

Talk to the community! We have several channels: the mailinglist, FB - page and group, G+, Chat.

Passive data for OSMing

Posted by maning on 1 September 2015 in English.

The idea of using passive data into OpenStreetMap is not new. Even during the early days of OSM, this concept was already discussed. What I mean by passive here are data sources that is not originally intended for use in OSM. This usually comes from third party services which gave permission to use their data into OSM. We are getting more of this recently and has helped me in improving my own mapping patch.

Animation below shows data from OSM public traces[0], Strava and Mapillary[1]. Marikina

However, I don’t think the idea of purely using passive data (where automatic data correction and update is done) will be possible in OSM. User input will always be needed.

[0] OSM public traces does not really qualify as passive data since many of them were uploaded for the purpose of mapping. However, I’ve seen many tracks in the Philippines that were uploaded and was not edited by the original user who uploaded the it.

[1] Again, Mapillary coverage here is mostly my own and use it primarily for updating the map. So tehcnically not passive data, but, it does comes from a third party website.

Disclaimer: This is specific to the Philippines, not a general OSM issue.

One of the most difficult data to collect in OSM are administrative boundaries (admin_level=*). It defies the on-the-ground rule. One cannot just go out and start surveying admin boundaries with a GPS. On the other hand, we see the importance of having admin boundaries in our database. We can define town/city limits. It improves geocoding. The maps looks nice. Humanitarians need them because they can plan and allocate resources according to administrative jurisdictions during a crisis. The only logical way to have this in OSM is to get them from various sources and do an import.

The most comprehensive source we found for the Philippines is from the freely available GADM. This website has a comprehensive collection administrative boundary data for free down to the smallest administrative units for many countries including the Philippines. Over the years, I tried to track down the provenance of GADM’s PH data. My geo-forensic skills lead me to people saying that the PH dataset originated from our national mapping agency. So, it seems very authoritative, why don’t we just import them? I say NO and here’s why (again, I am pertaining here to the Ph situation, GADM data maybe good in other countries and I have the utmost respect to the maintainers of the site sharing this to the public).

The license is incompatible. Period. End of discussion. Eugene discussed this years ago in our mailinglist.

Even if the license is compatible, the data quality is REALLY bad. Again, from Eugene’s mail to the list, here’s screenshot comparing OSM and GADM boundaries in Quezon City.

qc_gadm

If the above arguments does not dissuade you, consider this story.

Administrative boundaries imply a level of authoritativeness in the data. Ordinary users of the data may take it as exact and definitive. For example, during the immediate relief operations after Typhoon Haiyan in the Philippines, OSM volunteers across the world participated in the remote mapping response. We generated a tremendous amount of building, roads, and landuse data which were used by many international response agencies. Since we lack and can’t remotely map admin boundaries in the affected areas, response agencies resorted to using 3rd party admin boundaries (GADM is one of them) as an overlay to OSM derived basemaps. These maps were used by humanitarian agencies to organize relief operations. When I went to the affected areas months after the Typhoon, local authorities are complaining that in some instances, international agencies are insisting in their own maps particularly the village boundaries as a basis of relief supplies allocation. Local authorities would insist that these boundaries are wrong and does not exist in reality. Of course, response and relief planning should be dependent on other factors and not just based on a map, but, a wrong map exacerbates an already confusing situation.

So am I saying that we shouldn’t be adding admin boundaries in the Philippines? No, what I’m saying is that any 3rd party admin boundaries that covers the whole country you stumble upon either from the internet or directly from various agencies are wrong. No comprehensive data exist in the Ph.

What can we do now?

Talk to your local government authorities. You may find good data from specific local government units, if ever you get a hold of such data, let us know and if it is good enough, we can start the process of adding them in OSM.

Go out and survey! Map places as nodes. Oftentimes, a place node (place=town,city,village) is enough. For finding places in OSM, would you want a geocoder to give you a wrong boundary/polygon or a node/point that tells you exactly that this place exist in reality? In many cases, this is what I’m trying to do. Here’s a screenshot of village nodes we mapped in a remote town in Leyte. Compare that to the inaccurate (by 3 kms south) imported boundary of the town. Unless we get a better source to replace this boundary, I would rely more on the place node we surveyed with the local community.

burauen

I know, sometimes, it is very frustrating, OSM is heralded as one of the best freely available geographic data, yet, we lack the most basic admin boundaries over many areas. Imports might be the immediate solution, but, I ask PH mappers no to do this. I’m fine with missing boundary data for now, in time we can improve this the OSM-community-way, by importing, we maybe propagating more errors rather than helping improve our map.

Location: San Diego, Poblacion District 9, Burauen, 2nd District, Leyte, Eastern Visayas, 6516, Philippines

Mapping Party in Butuan, Agusan del Norte

Posted by maning on 10 August 2015 in English. Last updated on 11 August 2015.

Last July 24-25, we had the third leg of the series of crowdmapping events co-organized by The Asia Foundation (TAF) and its local partners in Butuan City. The first was in lloilo and the second in Tagbilaran. Similar to the previous events, the objective of this mapping party is to increase awareness of the potential of using OpenStreetMap to complement the various mapping initiatives of the TAF’s local partners in the region by inviting mapper volunteers to participate.

butuan mappers

Butuan is a special place for me. I have never been to this part of Mindanao, but, this is where the journey of my relatives may have started when my grandfather and his family migrated from Luzon and started a new life to what was then called the “new frontier” of the Philippines 4 decades ago.

Butuan is also a significant trading port during the pre-colonial times. Within the alluvial plains of Agusan river, archeologists discovered remains of pre-colonial settlements serving as a major trading and inter-cultural exchange between the upland tribes of Mindanao to Indonesia and mainland Asia.

In the late 1970s, remains of balangay boats within a dried-up river channel near the city centre were discovered.

balangay remains

“The balangay was the first wooden watercraft excavated in Southeast Asia and is evidence of early Filipino craftsmanship and their seamanship skills during pre-colonial times.” Wikipedia.

balangay replica

A proof that early Filipinos are excellent sea navigators and have sustained trading relations with the rest of Asia even during pre-colonial period. The word balangay is where the word barangay originated. It is the smallest administrative division of the Philippines (place=village, admin_level=10).

Moving on with the mapping, I arrive Butuan early morning of Friday. The orientation to participants will start later in the afternoon. With nothing else to do, I explored the city on foot with my GPS and camera taking several geotagged photos for my own mapping including a mapillary sequence of the mighty Agusan River.

agusan river

Later in the afternoon, we started the orientation to the local cycling group and instructed them to download OsmAnd which they will use for the field mapping exercise the next day.

osmand download

We started early morning of Saturday to the usual meeting place for bikers, after a few minutes of basic OsmAnd use, the teams proceeded to their assigned patch to map POIs focusing mainly on 24/7 and cycling related facilities.

osmand in the field

We met again for lunch and uploaded all our collected data. We mapped around pois: 435, lines: 40, polygons: 27 during the day and I’ve seen a few mappers continue adding more POIs a week after the event.

The cyclists really love OsmAnd because it is not only a data collecting app but more importantly, a complete offline navigation app they can use for their regular rides. One thing I noticed is that with the ever increasing size of data download for the PH maps in OsmAnd, it is starting to be very difficult to download for areas with very slow connection especially in remote areas and even in major cities in Mindanao and Visayas. Expensive data plans were maxed out just to download the worldwide overview map. I’ve already posted an GH issue hoping the OsmAnd devs would consider splitting the PH map into subregions just like other countries.

As usual, notes, photos and map updates in this page: http://maning.github.io/taf_crowdmapping/butuan.html

Location: Salas Village, Butuan, Caraga, 8600, Philippines

Mapping Party in Tagbilaran, Bohol

Posted by maning on 21 July 2015 in English.

Once again, we had another mapping event. This time, in Tagbilaran City, Bohol. This is part of the series of crowdmapping events co-organized by The Asia Foundation and its local partners. The first was in Iloilo City last May 2015.

Tagbilaran mappers

During the event, Bohol Governor Edgardo Chatto welcomed all the mappers and expressed his support to implement this initiative for the whole province of Bohol.

Bohol’s major income is tourism. However, when the 7.2 earthquake hit the island in 2013, the tourism industry was heavily affected. On the other hand, judging by the number of tourists (local and foreign) who was with me during the flight, I think tourism is now recovering. What a better way to help by providing a good map not only for the tourists but also for the local community!

The local partner of The Asia Foundation is the local chamber of commerce. Naturally, we focused on collecting business and tourism related map data during the field exercise.

mappers

Using phones powered by OSMAnd, we collected and updated pois: 451, lines: 94, polygons: 168.

edits

I joined one of the field teams and also took the opportunity to kickstart crowdsourcing streetviews using Mapillary.

edits

Other than several hiccups with the internet, the organizers did a very good job in managing the event. I hope the map data we collected will help in expanding the mapping community and help the province in revitalizing its tourism industry.

More notes/photos and map updates in this page: http://maning.github.io/taf_crowdmapping/tagbilaran.html

Location: Poblacion 3, Tagbilaran, Bohol, Central Visayas, 6390, Philippines

Mapping Party in Iloilo City

Posted by maning on 11 June 2015 in English. Last updated on 21 July 2015.

group photo

Last May 2015, I joined a mapping party in Iloilo co-organized by The Asia Foundation and several bike groups (IPAD Xtr, ICYC, iFOLD, Augustinian Cyclists) in the city. Originally, we designed to have an editing session using iD. But since most of them did not bring laptops, (they went to the meetup venue mostly on bikes of course!), we focused mapping using SmartPhones installed with OSMAnd.

kids mapping

Thanks to Erwin for updating the adding a new section on OSMAnd2 in learnOSM which I had to review early morning before the event. ;) The good thing with OSMAnd is that you have a lot of options for mapping, the bad thing with OSmAnd is that you have a lot of options for mapping. ;).

osmand

Anyway, we focused on using OSM plugin to map bike related POIs. There were some crashes on one device and we were not successful getting the plugin to work on iPhones/iOS. All in all, I think OSMAnd is perfect for groups like this. Even if they don’t use any of the editor, they can continue contributing by just uploading POIs. There were some issues along the way such as some POIs in the middle of the sea and other with only name tags. We are fixing it now.

overpass

Here’s my presentation notes/videos, mapper contributions and photos.

This post was originally shared in the OSM-PH mailinglist.

Location: Bakhaw, Mandurriao, Calubihan, Iloilo City, Western Visayas, 5000, Philippines

One of the on-going initiatives by the local OSM Philippine volunteers is to go to local communities to assist in training the local population to update and use OSM for disaster risk reduction.

One partnership we are nurturing with is the DRR mapping work by the Philippine and Swiss Red Cross in small island communities in Busuanga, Palawan. Last April 2015, mappers GOwin, feyeandal and dichapabe, went to Busuanga to start the mapping community with the local government and Red Cross volunteers. After the training the online mapping community lead by GOwin continues to assist the Busuanga mappers in updating the maps.

This work was featured in an article in Channel News Asia.

CNA video

By combining local knowledge and OSM tools, we hope to continue building the local mapping capacity and data that will empower communities to respond to any crisis.

Location: Purok 1, Maglalambay, Busuanga, Palawan, Mimaropa, Philippines

Cataman Airport

The first time I saw this in the map, I’ve always thought it was an editing mistake. This is Catarman Airport in Northern Samar, Philippines. What looks to me as a bug is the secondary road intersecting with the airport’s runway! Surely an editing mistake. But since I haven’t been there and the satellite image is too coarse, I cannot verify if this is indeed the case.

Yesterday, I had a chance to talk to locals familiar in the area and they indeed verified that this is correct. The airport services one or two flights a day. Vehicles are allowed to cross the runway in between flights similar to a railway level crossing. Aerial shots from wikipedia and from another website confirms this as well.

aerial view

trike

My question is, how do I tag this? Surely, there are similar situations in other areas.

Location: Taga-Igbaw Village, Calachuchi, Catarman, Northern Samar, Eastern Visayas, 6400, Philippines