OpenStreetMap

maning's Diary

Recent diary entries

What I want from HOT

Posted by maning on 10 March 2015 in English.

(I posted this in the HOT list. Board election is upcoming and voting members were asked to communicate what HOT’s board should focus on in the future. Here’s my appeal)

Dear everyone,

Let me kickstart this. First, no, I’m not running for the board, but here’s what I want HOT to aspire for in the future.

As many have said, we’ve come a long way since we started with the Haiti earthquake response. We have better tools, more capable people, better systems/organization and worldwide recognition. For many areas in the developing world, we are the default map. This is especially true for us in the Philippines where more and more users are utilizing our map across a diverse type of organization (international, national agencies, local government). Having said that, I also see a lot of improvements we can look into within HOT and the larger OSM community. Below are “wishlist” for the HOT community to consider. Note that this is my own perspective having been involved in several humanitarian mapping work(both as a remote mapper and deployments on the ground) in my own country. This is not in the order of priority.

From data consumers to data contributors. Many international organizations are using our data, but, I often wonder, do they contribute back? I know a couple of organizations are doing this (IFRC/ICRC/ARC/BRC, MSF, MapAction to name a few). I think we should consciously encourage these consumers to give back. We are not just a source of free geospatial data, we are a community and they are part of it.

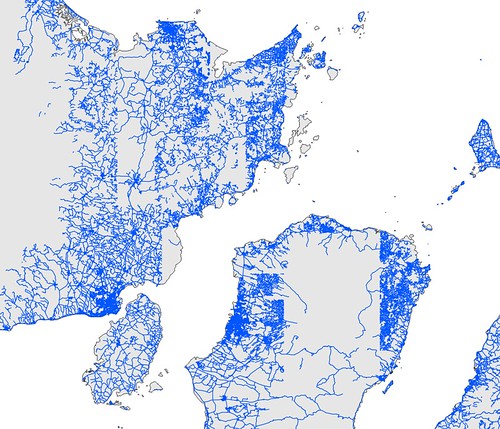
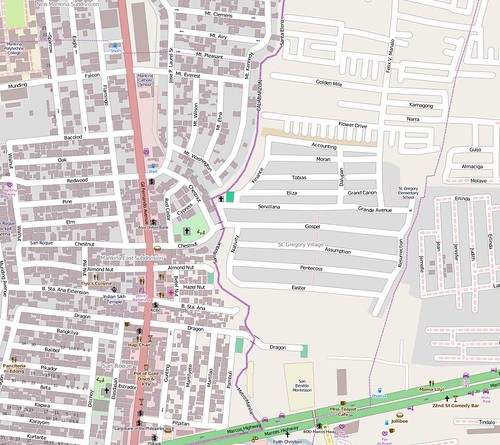
Building local community capacity. We are very good at responding to crisis. For a very short period, we can provide highly accurate data (street and building level detail) to any area in the world, but at the end of every response, have we considered how will the local community (if there is one) curate and continue maintaining the data? I think for every activation we respond to, we should always consider building local capacity. Some countries might not have any local community, but in areas where there is, we should strive to engage with them no matter how small this community maybe. Because ultimately, it will be local community who will maintain what we kickstarted.

Focus more on preparedness over response. MissingMaps, MapLesotho, HOT-Id (and other HOT technical assistance) are doing this already. And I think this is what we should be do more. For areas in the Philippines where we integrate participatory/community-driven mapping for disaster risk reduction, the simple exercise of mapping is a powerful tool to increase awareness on the local hazards and to engage local stakeholders (affected communities, DRR managers, local governments) in a discussion for better preparedness and response. We’ve witnessed instances where pre-mapping as part of the DRR activities allowed better response during a typhoon last year.

Better tools under challenging environment. As I said above, we have better tools now. But offline/very limited connectivity remains a big concern for most of the areas we are responding to. Better and simple tools under this condition should be what we should aim for.

Regional exchange and “mentoring”. I’ve learned a lot when collaborating with other mapping groups under a similar context. Fo example, we had several exchanges with OSM-Indonesia (through HOT’s project), being in a similar hazard context and, in a way, a closely-related culture, I find it that many of the techniques they have developed are applicable to our own condition. Would it be possible for HOT to facilitate this? For example, can MapKibera lead regional mentoring in Africa? Or OSM-Haiti within its region? Oftentimes, mentoring is from the “North” to the “South” or from “West” to “East”. This is also very valuable but lets also consider that there maybe local community experiences which can be shared within the region having the same socio-cultural context that can be more effective and adapted to the local condition.

Hoping the Board and the HOT community can work on some these wishes.

(Re-posted from the talk-ph list.)

I discovered OSM around Jan 2006 (user# 1417) while trying to look for PH vector data I need for a research. Free geographic data in the PH back then is very limited. The idea of building it from scratch got me interested. However, I wasn’t able to edit right away because I can’t get the then java-based web editor to run. ~10 months later I stumbled upon JOSM in the wiki and created my first node.

The oldest rendering I was able to save was this. As far as remember, it was Mike Collinson who made those edits. After several borrowed, hacked, broken, lost GPS since, Marikina is still not complete. So, I’m still here mapping.

Wikang Filipino para sa iD Editor

Posted by maning on 3 April 2014 in Tagalog.

Sinusubukan ko ngayong isalin sa wikang Filipino/Tagalog ang iD. Bagamat ito ang wikang aking nakagisnan, nakakahiyang sabihin na medyo nahirapan ako sa pagsasalin. Sanay kasi ako sa paggamit ng Ingles sa mga technical na bagay gaya ng computer.

Halos lahat ng nasa “core” ng iD ay naisalin na (maliban sa “Walkthrough”).

status

Unang pasada pa lang ito. Susubukan ko pang ayusin ang ilang mga translation strings. Sa mga ibig tumulong, madali lang naman magsalin gamit ang transifex. Puntahan mo lang yung section sa Filipino.

Para sa pauna kong tangka, hindi ko sinunod ang tuwiran o literal na pagsasalin. Kung tutuusin, parang “taglish” yung ginawa ko. Sa aking karanasan kasi, mas mahirap unawain ang tuwirang salin gaya ng pagsasalin sa tagalog ng OpenStreetMap website:

require_cookies: 
      cookies_needed: Tila mayroon kang hindi pinagaganang mga otap - mangyaring paganahin ang mga otap sa loob ng pantingin-tingin mo bago magpatuloy.

Sa aking palagay, may mga ilang technical na salitang mas mainam gamitin sa wikang Ingles kaysa isalin ng tuwiran.

Bakit pa?

Kung tutuusin karamihan sa mga Pinay/Pinoy na contributor sa OSM ay sanay na sa paggamit ng Ingles. At gaya ko, may mga pagkakataong mas komportable ang paggamit ng Ingles lalo na sa usapin sa computer.

May bahid ng pagiging makabayan ang dahilan. ;) Bagama’t pwede namang gamitin ang wikang Ingles, pinagmamalaki ko ang pagiging Filipino kaakibat nito ang aking wikang kinagisnan (mother tongue). Isa pa, hindi natin alam, baka may gustong gumamit ng wikang Filipino/Tagalog habang nag-eedit sa OSM gamit ang iD, mainam nang mayroon silang mapagpipilian.

For the past several months, OSM Philippine data is getting noticed by a good number of people and organizations. This is in part because of our crisis mapping in response to Typhoon Yolanda/Haiyan but, I also think the data is now in a usable state in many areas thanks to the dedication of local mappers.

As I look around the map, there is obviously a lot of inconsistency in data coverage. Some are mapped up to the individual buildings while others just a place=town node and nothing else.

Two things I consider to be a factor of this situation:

  • Most mapping are based on satellite imagery. In the case of my country, while imagery is available over large areas, many areas still don’t have hi-res imagery. This makes mapping “stop” at the edges of the imagery. The image below shows roads digitized during Yolanda mapping (map).

Visayas road gaps after Yolanda crisis mapping

  • Most local mappers are too focused on improving their own patch. This isn’t really bad since you should really map areas you are familiar with but, this leaves behind adjacent areas looking bare and the coverage uneven. Even I am a victim of this micro detail mapping. Just look at Marikina (my mapping patch) on the left and Cainta on the right (map).

Marikina Cainta border

I still think we should map in detail our own local area, but we should also keep in mind to look beyond our patch to produce a good level of consistency and evenness of coverage.

Eugene outlined this level of detail concept a few years back. In the document, he proposed 7 LODs based on the following parameters:

  • Scale / zoom
  • Spatial accuracy
  • Completion unit

Re-reading this document, I feel that the current Philippine data isn’t even on the first level. So this year, I plan to incrementally work on reaching LOD 1 (while continuously improving my own patch of course!) focusing on the following:

  • Check whether all cities and municipalities have at least a place=town or city node located within the town/city center;
  • Check whether all national roads are mapped and connected to the cities and municipalities (in OSM tagging, the highway=motorway, trunk, primary roads);
  • Move previously imported place=island nodes to each way/polygon (working on this now);
  • Map major rivers (waterway=river) and other large water bodies;
  • Fix relations of existing provincial boundaries.

Definitely a big task, but we can always work together.

P. S. As I am drafting this diary I was reminded by two other related post by: Harry and Severin which shares somewhat similar sentiments.

Location: 1634, Taguig, Southern Manila District, Metro Manila, Philippines

Polygonizing Philippine islands

Posted by maning on 13 February 2014 in English.

Recently, I’ve been trying to move tags on island nodes to its way (natural=coastline) following the best practice of One feature, one OSM element. The original place=island nodes were from an GNS import. Most of these islands now have a digitized coastline so it makes sense to add the place=island and all its tags to the ways.

To do this, I ran an overpass query to get all place=island nodes within a given boundingbox. Code is below:

<osm-script output="xml" timeout="25"><!-- fixed by auto repair -->
  <union>
    <!-- query part for: “place=island” -->
<query type="node">
  <has-kv k="place" v="island"/>
  <bbox-query s="4.061535597066106" w="111.57714843749999" n="21.166483858206583" e="127.11181640625"/>
</query>
</union>
<!-- print results -->
<print mode="meta"/><!-- fixed by auto repair -->
<recurse type="down"/>
<print mode="meta" order="quadtile"/><!-- fixed by auto repair -->
</osm-script>

The result will show on the map like this:

Overpass query island nodes

Then, I clicked the “Export” link to download the data into JOSM.

Slowly, working my way on each island node, I transferred the tags to the coastlines. If there is no natural=coastline, I trace them using Bing’s high-res imagery and then add the tags in the island nodes.

Right now, I’m focusing my efforts on smaller islands where the natural=coastline is on a closed way. I will start working on the islands relations once I finish the closed ways. Might take a while though (current count is ~2,500 nodes).

Location: Bolabog, Quinar-Upan, Iloilo, Western Visayas, Philippines

Of gender and mapping perspectives

Posted by maning on 9 September 2013 in English.

Catching up on the slides and tweets of the successful SOTM 2013 in Birmingham, I found this very interesting talk by Alyssa Wright (@alyssapwright). The slides discussed the general trend of a male-gender-biased-tagging of features in OSM (see slides #72 to #79).

This reminded me of a resource mapping and assessment we did for an Indigenous Peoples in the Philippines. The research covers a protected area where several IPs communities (Batak and Tagbanua) are living. Part of the research is to conduct participatory mapping workshops with several IPs villages. We used a physical 3D model (very similar to this approach) to allow community members to identify key resources and other geographic features.

During the series of mapping workshops, I insisted that as an initial mapping activity, we divide the group into men and women. Both groups will have its own 3D model and they were instructed to identify important geographic features within their community. The final map will be an integration of both workshop output.

The map showed very interesting results.

The men group covered a larger extent of the area, common features they identified are:

  • names of all major rivers and streams;
  • location of hunting grounds including accurate position of where they hunted the largest wild pig, snake, or eel;
  • important trees for gathering resins and wild honey;
  • approximate boundary of forest cover types.

The women group on the other hand covered a smaller area mostly within the established settlements of the tribe, common features they identified were:

  • location of community structures such as schools, place of worship, community halls for gatherings;
  • sources of clean water (wells and springs);
  • a stream that regularly overflows limiting access to children going to school;
  • patches in the forest to gather medicinal plants and other wild vegetables;
  • patches of swidden farmlots.

The community mapping exercise provided a rich source of information for the resource mapping and assessment. Moreover, conducting a separate mapping workshop to each gender group in the community encouraged greater participation of women.

Both maps shows very different priorities and perspectives but not one more important than the other.

Location: Marufinas, Puerto Princesa, Mimaropa, Philippines

New OSM-PH Logo

Posted by maning on 18 February 2013 in English.

osmph_logo

OSM-Philippines have a new logo. Eugene (seav) designed this logo using the original OSM logo as its inspiration. He added the basic outline of the country’s archipelago and the three stars and a sun elements of the Philippine flag.

The community love it! Thanks to Eugene for designing our new logo!

Available here as svg and png: http://wiki.openstreetmap.org/wiki/File:OSMPH_Logo.svg

Location: San Juan, Batangas, Calabarzon, 4226, Philippines

My GPS Art

Posted by maning on 14 February 2013 in English.

SteveC recently started a Kickstarter campaign for a GPS Art Poster. Since my country is not included, I decided to check the tracks around my OSM patch.

The image below shows all the publicly available traces in OSM (not all of them are mine but most are) and also some I didn’t uploaded over Marikina City. I probably have more lying around SDcards and in my GPS internal memory.

Marikina Traces

The image does gives you a personal story of your mapping expeditions.

  • The “low-res” tracks along the circular roads (northeast) were one of my earliest mapping for OSM. Back then, I was using an old eTrex without an SDcard slot. It would take around 2 hours of walking to fill the internal memory. To download the data, I hacked an old serial cable mouse and a plastic card (very similar to this rig) because buying the Garmin serial cable is almost half the price of the device.

  • The tracks made by my students (6 years ago) for an end of term mapping project is still very visible and were never replaced by a much better trace.

  • Someone (not me) must have forgotten to turn his/her GPS off and then uploaded the point cloud without any post clean-ups.

  • The lonely trace in Provident Village was when I visited a fellow mapper and delivered one of our GPStogo unit he is planning to use for a mapping expedition.

  • The large blank patches (center west) are private subdivisions where you are not allowed to enter unless you show an ID or you have an official car sticker. I never bothered cycling inside those posh subdivisions.

What’s your GPS track story?

Location: Marikina Heights, District II, Marikina, Eastern Manila District, Metro Manila, 1810, Philippines

Second attempt to address mapping

Posted by maning on 29 November 2012 in English.

I’ve been passing along doing housenumbers for years, partly because I find it too micro and partly because I am scared getting addicted :-).

I tried it before using my usual workflow, bike and a GPSr. It usually takes half an hour to collect some numbers, another hour to download the trace, edit in JOSM and, finally upload. Months of work got me this result.

housenumber1

After that month, my drive to do it died.

Recently, I stumbled upon KeypadMapper. The wiki promised a “rapid data collection” approach to address mapping. So, I tried it, and it delivered its promise!

Again, with a bike and this time a ‘droid phone, I was able to collect housenumbers in a fraction of time than with my old workflow. I like the simple interface (you can collect a housenumber in less than 3 phone taps). It creates a .osm file and with just a few adjustments, you can upload them via JOSM. The map below took me less than a week to finish.

housenumber2

There are a few tips I find useful using this app.

  • You need to be on a consistent speed and direction. The app considers your movement direction to approximate which side of road (left or right) the housenumber is located.
  • An accuracy of <6 meters is probably the best.
  • Slow walking will produce low quality GPS trace with jagged lines which influences which side of road the housenumber will be located.
  • It is better to focus on one side of the road for one trip and then the other side on another trip. Editing will be easier since you are sure all your housenumbers are on one side and you can adjust them accordingly in JOSM.

Any other advice for doing address mapping? Please share them below.

I just did a test on using the exif information from geotagged photos for mapping. This time, I set my phone (Samsung GT-S5300) to add the location in the exif data. Using the same phone, I also logged my tracks as a background process with GPSLogger.

The image below shows the image location in JOSM using the exif’s lat/lon data. The GPS trace is also shown. Notice that the photos are arranged in a grid-like manner and does not entirely correspond to my tracks.

Using exif

Using the traditional photo to gps position correlation in JOSM, the photo location is way more accurate.

Correlate with traces

Just to test if this is a JOSM bug, I tried reading the photo’s exif tag in QGIS using the Photo2shape plugin and it shows the same grid-like position in the first image.

Location: 391, Quiapo, Third District, Manila, Capital District, Metro Manila, 1001, Philippines

Just happy to report that last week I was in a university down south
helping several university faculty with their research activities. My
role is simple, make their research output map aware. After 4 days of
informal workshops we were able to collect data, transform them into
maps and relate these information into their respective research which
range from the natural science, social science and engineering domain.

One of the great dataset we were able to utilize is the tremendous
detail of OSM data in their research areas. While road data is not
the main dataset they are interested in. The availability of this
data allowed us to focus on the other data needed and use OSM as
complement in various forms. Either as baselayer for a webmap, a
reference for geocoding raster images, a timeshot for understanding
urban expansion and landcover changes. I will give more details once
these projects gets into public release (you know how the academe
works :) ).

Another important note is that prior to being a user of the data these
faculties are first and foremost contributors and supporters of OSM
[0] so they are aware of the spirit and motivations of OSM.

My personal advise to anyone interested in using OSM in their own
projects (either for fun or profit), be a contributor first. ;)

[0] http://lists.openstreetmap.org/pipermail/talk-ph/2011-May/003211.html

[I sent this message to the talk-ph list. Posting here just in case other osm-ph mappers not subscribed have other ides. ]

I am know collating my mental notes in preparation for the "State of
the PH" lightning talk for SOTM2011. And since this is a community
presentation, I might as well ask you on what we should be presenting.

The primary source materials of my talk is the wiki [0,1,2] and of
course, this list [3]. For sure the OSM-PH data has grown tremendously
in the the past 2 years. There a number of factors that may have
contributed to this growth. I would like to focus the presentation on
on 4 main points. Perhaps you can help me develop the discussion.

1. The osm-ph community. Who is the "community"? What characterize a
PH OSMer? How do we map? What are the innovative ways we do to
improve the map? Are the data users part of this community? Is the
talk-ph list and discussions here a representative sample of the osm-ph
community?

2. How do we use the data? Some sample of data useage we can
illustrate. Maybe a ph brewed mapping application? Or other ways you
have used the data? If there are any,
please provide a link or description and a screenshot.

3. Issues and concerns. Why are we growing in some areas but not
in others? How do you guage our relationship with other crowdsource
mapping initiative in the country (google mapmaker, roadguide.ph, wikimapia)?

4. The future. How do you see the state of PH data in a year or two?
What should be done to further improve and expand data coverage?

If you any thoughts, just send them here or as a PM. Thanks!

[0] http://wiki.openstreetmap.org/wiki/Philippines
[1] http://wiki.openstreetmap.org/wiki/Philippines/Timeline
[2] http://wiki.openstreetmap.org/wiki/WikiProject_Philippines/Featured_images
[3] http://lists.openstreetmap.org/listinfo/talk-ph

I have been editing rivers and stream within the Marikina-Pasig river basin for the past few weeks. Typhoon Ondoy/Ketsana which caused the most catastrophic floods in the country [1] have dramatically altered many river channels.

My personal goal for updating river data is to support research initiatives on flood monitoring [2] and effective basin management.

Thanks again to Bing, new imagery is available in the whole basin/watershed. Icing in the cake are the imagery dates which are between October 2009 to Feb 2010. All of which are post-Ondoy/Ketsana.

Over the course of my edits, I have observed general geographic phenomena that is happening in this area:

1. The floods have dramatically altered many river channels. Previous courses where diverted due to landslides and other obstructions.

2. Many river and stream channels are now gone. This is not primarily due to the floods but of the rapid urbanization in the area. Most of rice paddies are now converted to subdivisions. As a result many of the natural irrigation channels, intermittent creeks and streams are either completely filled up, diverted or the stream banks are constricted thereby limiting natural flow. [3]

3. Within the headwaters of one major river (Boso-boso River) is a big industrial pig farm. I noticed that some canals coming from their waste ponds drains towards the river. [4] I'm interested to know whether they have a pig s*%t processing before dumping water to the river.

[1]
http://wiki.openstreetmap.org/wiki/Humanitarian_OSM_Team/philippines_ondoy
[2]
http://epsg4253.wordpress.com/2009/10/13/free-our-data-rainfall-and-water-level-monitoring/
[3] http://osm.org/go/4zhcDayW--
[4] http://osm.org/go/4zhavWmD

Location: Casili, Rizal, Calabarzon, Philippines