
Finding areas where OSM is low in address data density
Posted by watmildon on 9 December 2022 in English. Last updated on 28 March 2024.Update: Check out my comment below about the state of the art being greatly improved!
The idea
After finishing my first address import I was looking for a good view of “where else needs addresses”. One trick that always pays dividends for me is to look at distributions of ratios of various quantities. In particular, I presumed there should be a pretty smooth distribution to the ratio of number of addresses vs number of buildings in any given area.
Building it
- Get the data from Geofabrik state data dumps (US regions are too big for the tools)
- Use osmconvert to flatten out ways and relations. Something like:
osmconvert alabama-latest.osm.pbf https://wiki.openstreetmap.org/wiki/Tag:-o=alabama-nodes.csv https://wiki.openstreetmap.org/wiki/Tag:--max-objects=50000000 --all-to-nodes --csv="https://www.openstreetmap.org/user/lat https://www.openstreetmap.org/user/lon addr:housenumber building"- A bit of C# to do the binning (I’m sure QGIS and other tools are great for this but you use what you know)
- Tableau Public for the viz generation
The results
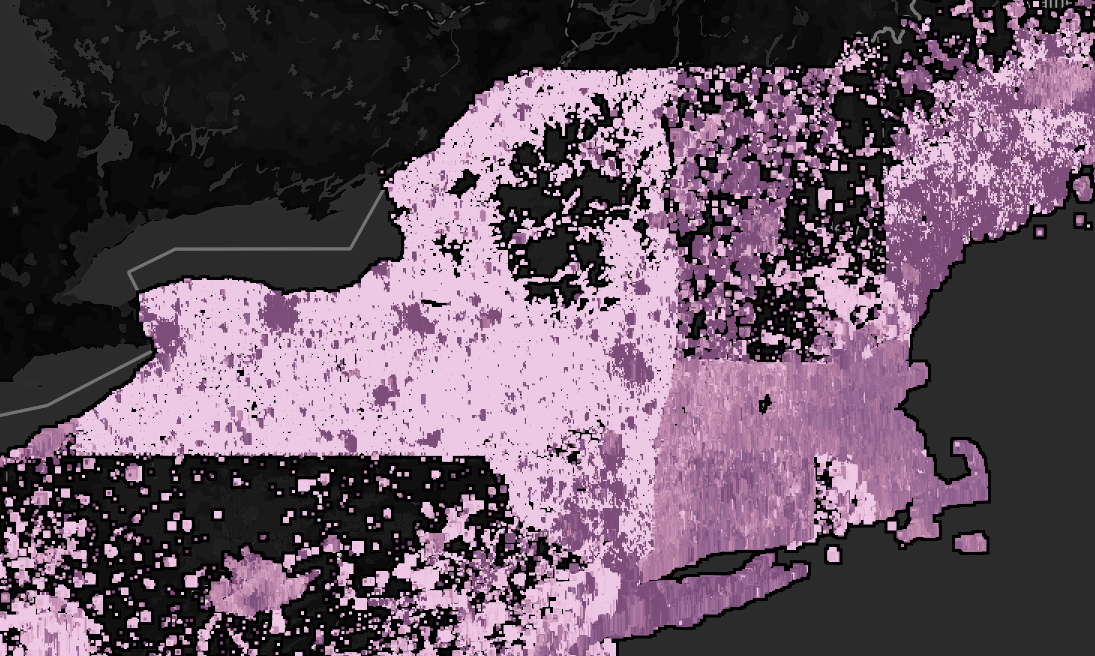
 So what are we looking at? Here is the data for the area around Milwaukee, WI. Each data mark is a lat/long bin .01 degree on a side. The size of each mark indicates the number of OSM buildings objects in the bin and the color is the ratio (number addr:housenumber tags on objects) /(number buildings). Bigger boxes mean more buildings. Darker means better address density comparatively.
It’s nice to see that the viz immediately shows the address import work we recently completed. So what does an area that needs work look like?
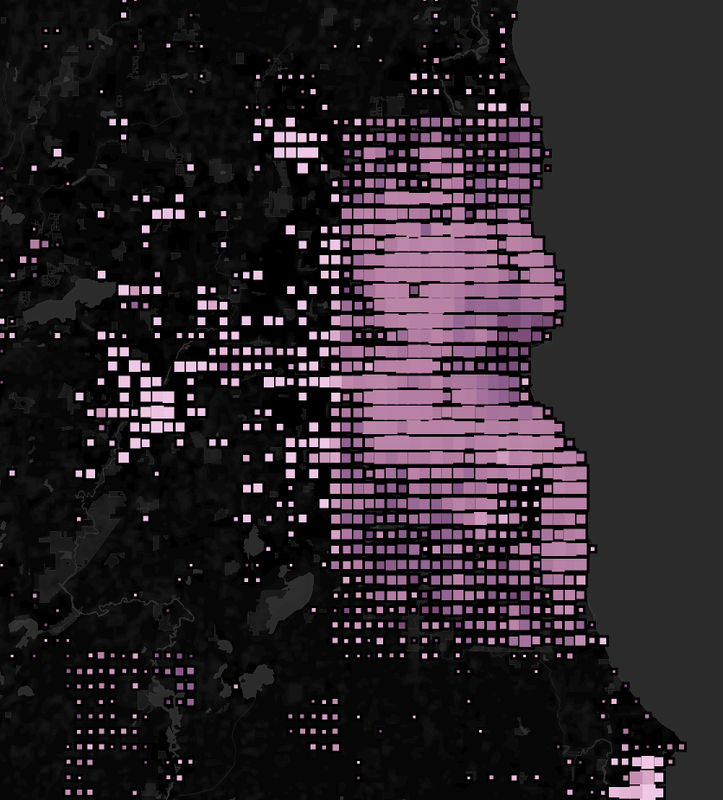
 Welcome to Indianapolis! Lighter areas with large mark size mean there’s lots of unaddressed buildings. It’s particularly surprising to me as the core of the city looks quite under addressed. A great candidate to spend a few hours contributing.
You can look around the data yourself here
Happy mapping.
Some notes
- Some of the larger states (CA/NY etc) will have incomplete data as osmconvert aborted while processing. I presume the data is a reasonable representation of reality but have done no work to back that up.
- I have only processed the lower United States but could generate this for your locality relatively easily. Let me know!
- The scrolling performance is pretty bad due to the number of data points but the search in the upper left works great.
Discussion
Comment from watmildon on 19 January 2023 at 19:38
UPDATE! I have completed the address conflation of NAD data into Indianapolis. I’ll need to post an update to the dataviz for it to be reflected but… one city down, many to go.
Comment from watmildon on 28 March 2024 at 20:42
ANOTHER UPDATE.
It’s now much much easier to deploy an entire dedicated site for things like this. I have built TIGERMap which has an OSM layer as well as a National Address Database heatmap which makes is super easy to see these things with a superior user experience.
Details here: https://community.openstreetmap.org/t/announcing-tigermap-tiger-reviewed-no/110004