
OpenStreetMap Community Statistics Revisited
Posted by SimonPoole on 15 January 2017 in English. Last updated on 1 July 2017.In November 2015 I produced a blog post on the relative sizes of our national communities and their development over time. When I updated the contributor stats on our wiki a couple of days back and looking at the massive impact the influx of first time users using maps.me have on the contributor numbers (not necessarily on anything else as I have pointed out in earlier posts), I thought it would be interesting to update the numbers and have a look at what has changed over slightly more than a year.
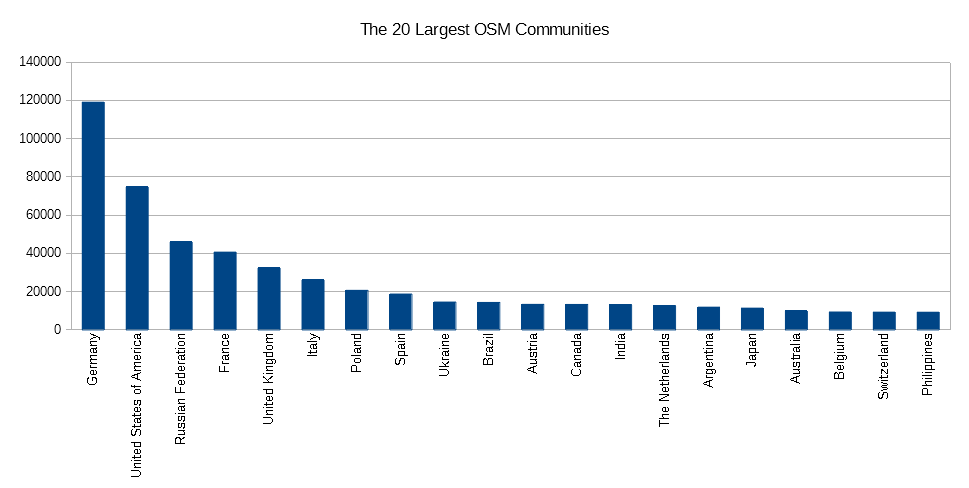
The most notable changes in the top 20 ranking by absolute community size are Russia overtaking France, Ukraine moving up 6 places and the Philippines moving in to the top 20 at the expense of the Czech Republic.
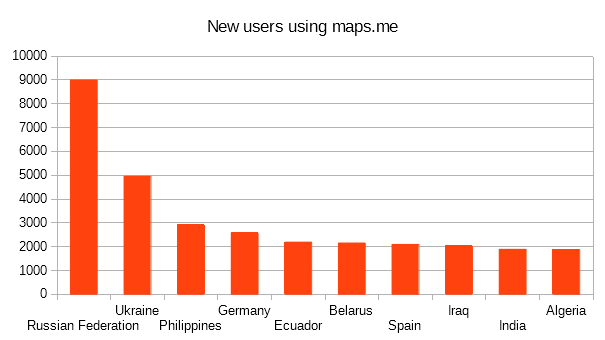
It is reasonable to assume that these changes are mainly due to the differences in the popularity of maps.me, No surprise and expected that it is most popular in Russia and the Ukraine, not so clear why it is so popular in the Philippines:
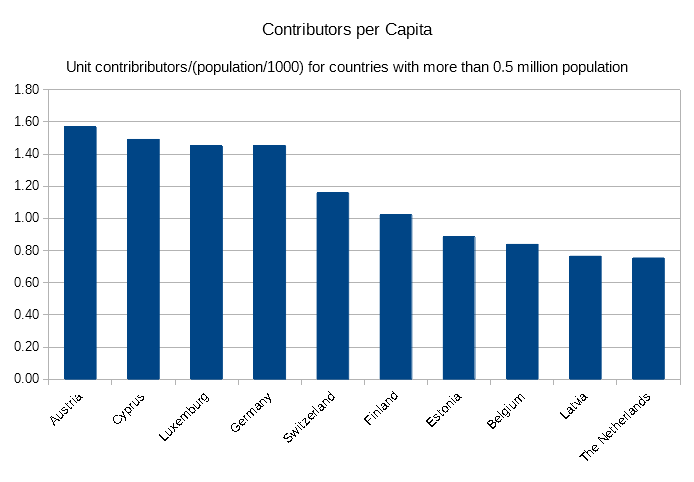
Numerous small changes in the contributors per capita ranking, but I suspect the fact to take away from this is that even in countries that already had the best results we are still improving the penetration levels.
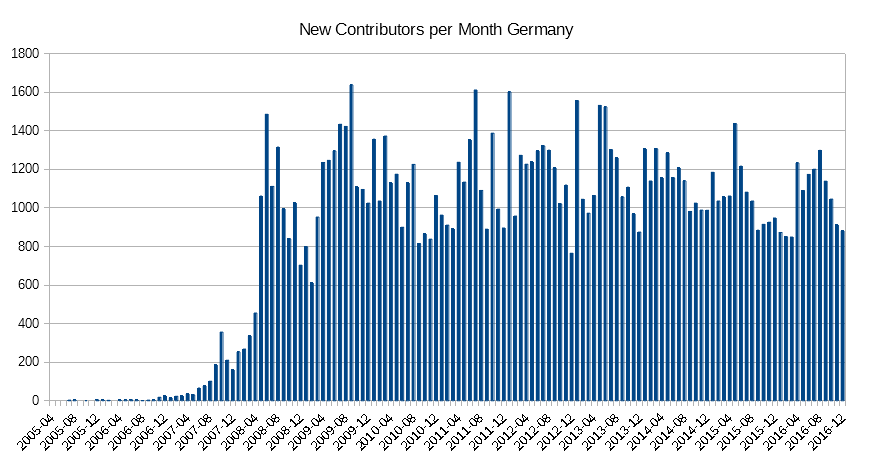
In the first blog I singled out Germany and the United States as the two largest communities with very different growth patterns. Particularly in Germany there has been some concern as both the number of active contributors over short periods and the absolute number of edits have been decreasing slightly over the last two years. However new contributor influx does not show the same trend and we might put the “negative” trend simply down to the major urban areas of Germany being extremely well mapped.
As in 2015 the trend in the United States is very different, with a very large growth peak in December 2016. 3500 mappers in a month is roughly what would be required to grow at the same rate relative to population as Germany, so this should be a great achievement.
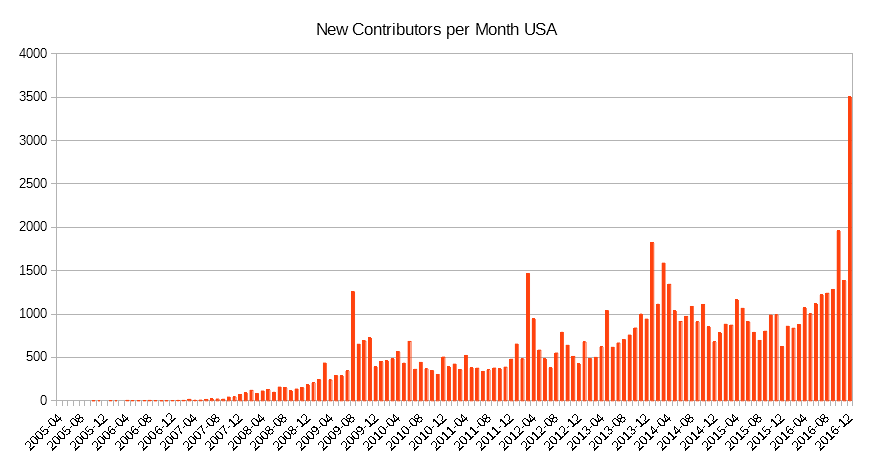
Unluckily it is not.
Closer inspection shows that a large number (in the 1000s) of the accounts created in December and in the preceding months are fake accounts created by one or more SEO companies. While it is rather unclear if the data added itself is legit, the accounts themselves are not.
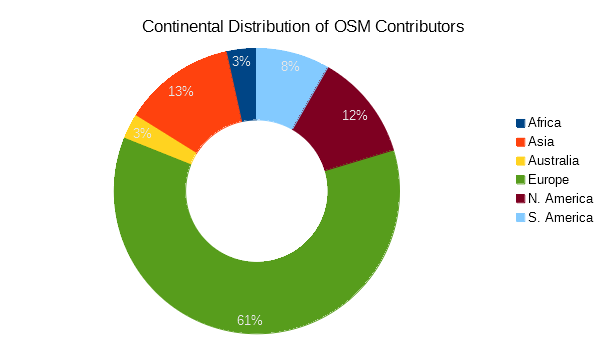
Back to numbers with a more positive context, the continental distribution of mappers continues to even out, while Europe continues to dominate, both Asia and South America have increased their relative share.
The raw data for the stats is available as LibreOffice Calc files. Notes on the methodology can be found in the original blog post.
Discussion
Comment from wille on 15 January 2017 at 16:16
Excelent stats! It’s missing the data about Caribbean and Central America, isn’t it?
Comment from SimonPoole on 15 January 2017 at 16:25
Caribbean and Central America is lumped in to South America IIRC
Comment from pitscheplatsch on 15 January 2017 at 18:11
Because it’s not mentioned in the text above and could be interesting: “Distribution of (active) @openstreetmap contributors. (Date: Nov. 19th, 2016)”. Overall and past 12 months. Furthermore, I also wrote a blog post “A comparative study between different OpenStreetMap contributor groups - Outline 2016”.
Comment from SimonPoole on 15 January 2017 at 20:29
@pitscheplatsch IMHO the most interesting question currently is if we will see any uptick in longer term mappers due to the large numbers of people starting off with maps.me, or if the underlying trend continues as is
Active contributors per year
Comment from BushmanK on 15 January 2017 at 22:18
@pitscheplatsch,
In your blog post, you’ve mentioned that 5% of those who used Maps.me editor also used other editors. But for me, it is still unclear, if these are users who started from Maps.me and then tried another editor or this number is not filtered, so it includes those who used other editors before and then tried Maps.me. This is important for understanding, how many people, more or less interested in contribution, were actually brought by Maps.me. Because if 90% of that 5% are experienced ones who used to contribute before, it’s the completely different thing.
Comment from SimonPoole on 15 January 2017 at 23:46
@BushmanK of the ~89’000 contributors that started off with maps.me ~2’200 tried a different editor at least once. In other words a bit over 2%.
The other interesting number is that just 205 of those 89’000 made more than 1000 changes in 2016. Note “changes” not “changesets”, 1000 changes is really small, typically a changeset or two with a conventional editor.
Comment from BushmanK on 16 January 2017 at 01:18
@SimonPoole,
Thank you. Great info regarding of a transformation of quantity into quality.
It seems like fans of Maps.me are significantly overestimating the potential of this app to bring new “full-scale” and even “casual” (as an opposite to “occasional” and “completely uninformed”) contributors. Your numbers look like something similar by its order of magnitude to regular fluctuations.
So, at least, we know now that Maps.me can not effectively attract new casual or full-scale mappers better than it happens by itself.
Unfortunately, it is hard to automatically estimate the quality of edits as easy, as the amount of it, because I’ve seen many attempts of quality assessments published here before, conducted manually, in an unscientific manner, and by people, who have own questionable quality standards.
(I know that by saying this, I’m making @Zverik to dislike me even more than he already does, and he will likely try to abuse his moderator’s power on Russian OSM forum even more, but objective truth is more important to me than other things.)
Comment from SimonPoole on 16 January 2017 at 09:17
To put the “205” in a bit more context, a comparison over the same time period with iD (~78’000 new users using iD over the period from April to December 2016):
I don’t think this is negative as such, it just shows that users starting off with maps.me are unlikely to be a source of lager mappers that in the end keep OSM alive.
Comment from ImreSamu on 16 January 2017 at 12:55
:)
According to the “LibreOffice Calc files” - “Null Island” is better than “Czech Republic”
Comment from SimonPoole on 16 January 2017 at 13:10
@Imre that is a bit of an insider joke, those are simply the changsets that couldn’t be geocoded because the center wasn’t inside a country boundary (see the original blog post), they can simply be ignored.
Comment from BushmanK on 16 January 2017 at 17:04
@SimonPoole,
I’m not saying it is something “negative”. I’m saying that statements about Maps.me being an instrument to attract new mappers are statistically false. And it perfectly correlates with a hypothesis about “uninformed users” I’ve described several times. Users of Maps.me obviously think it is a navigation app, they have no idea (and don’t really want to have) about the source of data, they only potentially care about getting their map fixed. This isn’t “bad”, this is just a different pattern of use, defined at the moment when a person makes a choice to install Maps.me app (navigator, not OSM editor). And again, I’m saying that OSM-related apps can not magically turn people into mappers if they don’t want to be ones. But there still is a large potential of automated contribution similar to what Yandex does with collecting GPS tracks - it doesn’t contradict a pattern of use.
Comment from joost schouppe on 18 January 2017 at 12:07
Is it easy to share a slightly rawer file too? I.e. a row is a contributor (or the unique combination of a contributor and the editor used), in the columns country, date, editor1, editor2.
Also, the source code zips seem to result in 1 kb files.
Comment from SimonPoole on 18 January 2017 at 13:58
@joost the “rawer” data would be a rather largish database dump, which I can naturally provide, I’m just not so sure that it would be useful. I can naturally run specific queries if a good case can be made for them.
Given that the published souce code is currently just a readme file the 1kB zips are not that surprising (the source code is totally uninteresting throwaway SQL with some perl around it) :-)..
Comment from joost schouppe on 18 January 2017 at 14:13
Simon, I don’t have any previous experience with working with changeset dumps, however a huge file with the basic ingredients to generate the stats you made would be very useful for me.
As I don’t speak but do read SQL, even the throwaway code would be interested if ever I get around to doing something with the changeset dumps.
Comment from SOSM on 18 January 2017 at 20:39
@joost I have to give this some thought what the best approach is for making more detail available.
Comment from stevea on 19 January 2017 at 19:17
Thank you for the numbers, Simon. While it was our American author (and humorist) who said that “There are lies, damned lies and STATISTICS!” I believe we can learn SOME things from these numbers without too much argument.
What falls out as most interesting to me are longer term observable trends in “more mature” OSM environments like Germany and UK: it seems we can and should learn both what happens and what we might do (to guide and instruct less-developed areas) from places where, as you say, “major urban areas…(are) extremely well mapped.”
OSM both does mature and is maturing (in pockets), more and more. Let’s do our best to observe what happens as we do so and how to best apply good lessons from there to more-developing parts of our mapped world.
SteveA California
Comment from stevea on 19 January 2017 at 19:19
Yeah, forgot to say the quote was from Mark Twain (Samuel Longhorn Clemens).
Comment from RicoElectrico on 28 September 2018 at 10:35
@BushmanK: I have to agree with you, people who use Maps.me don’t realize what the OSM community is really about. The general clunkiness of the UI (ie. bad UX) and very weird wording (implying normal OSM mappers are “moderators”) does not help at all.
Zverik, if you want to show good will, maybe implement the community index and show it to the users after uploading their changesets?
Comment from Zverik on 28 September 2018 at 11:58
Michał, maps.me is a commercial product with a roadmap, tight funding and a very limited pool of developers. There are quite a lot of people or NGOs that try to direct maps.me development in their way under “good will” clause. That would work if maps.me team didn’t have any goals and just worked on anything they’d like. But alas non-venture-funded world does not work like that.
I would also be very grateful if you stopped asking me specifically to improve maps.me. I was swamped with tasks and burnt out before, so even if I still worked at maps.me, I’d be unable to help you. And now that I left maps.me, I have even less power. Please write your suggestions to dev@maps.me.