Steep paths : refinement of approach
Posted by SK53 on 9 January 2023 in English. Last updated on 11 January 2023. Lord’s Rake: one of the steepest paths marked on OSM in Upper Wasdale
In my last diary I introduced the idea of using elevation models (DEMs), specifically a DTM (terrain model) to find sections of hiking paths on OpenStreetMap which may cause problems for regular hikers. In this sequel I describe a refined approach using a higher quality terrain model and a vertex-based approach to calculating slope angles actually likely to be experienced by walkers.
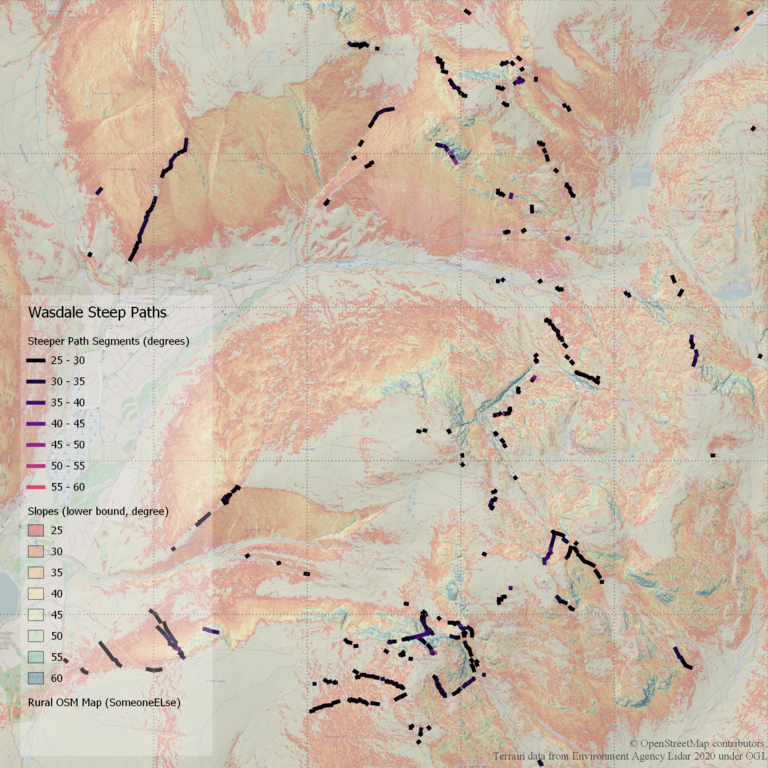
Wasdale steep paths: larger image at 1:25k
Fortunately in most the UK we now have high quality recent Lidar data covering much of the country at a resolution no worse than 2 metres. It is a bit tedious to download as it is available in tiles 5 km on each side (names are based on the 10 km grid square plus a compass direction, e.g., SK53NE), so instead of covering a 100 km square as in the previous example I have just focused on one 10 km square NY20. This covers many of the most difficult paths in the Lake District: those around Scafell, Scafell Pike, Great Gable, the Langdale Pikes, and a bit of the Helvellyn range. Unfortunately not all the Lidar data is 1 m, but the area of Upper Wasdale is thoroughly covered.
Basic Workflow
Lidar tiles are downloaded and unzipped into a single directory. I use QGIS to run a gdal command to create a virtual raster which combines all these tiles into a single file I can load into QGIS. This approach is particularly useful as the virtual raster parameters allow merging data at different resolutions.
From the DTM I then created a hillshade layer and a slope layer. Both of these were more to help with visualisation, than to do the work, which used the base DTM.
As in the previous example I used the QGIS processing function “Reclassify by table” to create a second version of the slope layer with slopes of greater than 25 degrees grouped into 5 degree buckets. This layer is saved as a file for future use.
OSM path data is then loaded into QGIS, and all vertices extracted. Each vertex inherits all the fields of its parent way plus a vertex index. In practice I had to do a bit of data wrangling because path junctions would create multiple vertices in the same place.
I downloaded and installed the “Point Sampling Plugin” for QGIS and ran this to obtain height values for each path vertex. At this point I had to do some wrangling with the point data to merge these values back with the original data, but I suspect I missed a feature.
At this point one has each point in the path with where it is along the path and how high it is above sea level. I took this data and pushed it into PostGIS.
With PostGIS one can use a PostgreSQL window function to rebuild the path segments and to calculate the height difference between successive nodes and the distance between them, and consequently the slope of the path.
The resulting data is then pulled back into QGIS where it can be filtered and plotted.
Results
There were some immediately obvious improvements. Firstly, this approach eliminated the obvious false positives of shallow angle paths traversing steep ground. Secondly, there were many fewer high angle outliers. The vast majority of steep path segments are between 25 and 30 degrees, with only a few as much as 35 to 40 degrees (including part of Lord’s Rake, shown at head of post). Thirdly, most of the paths picked out very much match my expectations.
There are small number of extremely steep sections (for instance exiting the West Wall Traverse), but I suspect many of these are an artefact in that an OSM path being only 2-3 metres out of the correct alignment may move it onto a cliff face. An unanticipated aspect of this is the potential to improve OSM mapping in terrain which is difficult to see on aerial images.
The particular paths I expected to be picked out were. A few examples: the Climbers Path under the Napes on Great Gable, most paths around Mickledore, Brown Band on Great End, the descent from Yewbarrow to Dore Head.
A few paths stand out as worth checking:
- Above right bank of Piers Gill. This is noted by the local mountain rescue as being an “accident black spot”.
- Short cut avoiding Broad Crag Col. This is shown on OSM crossing a couple of cliffs, and is probably misaligned anyway. The data shows it have a couple of very steep sections. This looks to be a route over scree, which may be suitable for descent for very experienced walkers, but is unlikely to be of any appeal on ascent. (One note, in snow many more routes can present themselves, as I found way back in April 1984).
- Direct route to Yewbarrow. I can’t remember seeing a path in this location and have always taken the route which more-or-less follows the south ridge from its base. It is visible on imagery, so it must have arisen relatively recently.
One path (used advisedly) which is not marked on OpenStreetMap is the route descending directly from Dore Head to Mosedale. This roughly aligns with this mapped bit of scree. Parts of the scree have completely washed away and it is no longer a straightforward scree run. Again it is a common location for accidents. Certainly, no longer a quick way to get to the pub.
Conclusions
This has been an interesting exercise for me, as I’d never really done a combined raster and vector analysis in QGIS. There are still a few steps which are a bit cumbersome. I suspect most could be overcome by using PostGIS for associating pixel values from the raster data with vertices of vector data.
There are obvious advantages in being able to analytically create a set of data for checking rather than relying on non-systematic sense checking by individual mappers. It’s already been suggested this is also useful for things like advocacy with the bodies who manage trails elsewhere. The data could also be potentially used to enhance extracted OSM data for hikers.
My next steps are to : a) complete DTM coverage of the NY20 hectad; b) progressively enlarge the vrt file to cover the whole Lake District; and c) to repeat the analysis for the entire area.
Discussion
Comment from InsertUser on 12 January 2023 at 20:17
Does this approach subdivide any paths with long gaps between the vertices? I’m wondering if a straight line over a peak might just show the steepness of a straight ‘tunnel’ through the ground rather than the actual slope up to the top and back down. Or is this a case where all the paths are wiggly enough that this isn’t an issue?
Comment from SK53 on 12 January 2023 at 20:46
@InsertUser: Not at the moment, but once I have everything in PostGIS I would use st_segment to add vertices to paths at a given interval (10-20 m perhaps), one could also use contours to add points where a path intersects the contours. In principle one could do this with vectorised versions of the slope & aspect, but I think that is both overkill & prone to polygon assembly artefacts.
Comment from SK53 on 12 January 2023 at 20:50
I’m actually looking at a ski area which has freeride runs which climb above a lift station in order to gain access to the next valley, for instance this one. In some of these cases the tagging is a bit deficient in not splitting the uphill & downhill parts of the route, but they do neatly exemplify the issue.