Solar power mapping in China: a comparison against ML data
Posted by SK53 on 13 November 2021 in English.A couple of weeks ago a research group in Oxford published a worldwide dataset of predicted solar power locations in the journal Nature (Kruitwagen et al., Vol. 598, 604-610). There is also a blog post by Lukas Kruitwagen himself on The Conversation.
Apart from the subject’s intrinsic interest, the study is noteworthy because it used machine learning (ML) to make the predictions. The base training dataset came from OpenStreetMap (although the paper makes a single mention and then, incorrectly, adds an “s”). The role of OSM is much better described in The Economist (paywall):
“For this, they turned to OpenStreetMap, an open-source rival to Google Maps in which volunteers had already tagged large numbers of solar plants. But there was little consistency. “Some people had just drawn rough outlines around an entire field,” Dr Kruitwagen says. “Others had gone in and traced the outline of each row of panels separately.” Fixing that involved a great deal of manual labour.”
There is also a New & Views piece in Nature as well. These are usually reserved for articles judged to have particular significance.
The Data
The data are available under a CC-BY 4.0 International licence at Zenodo: ![]() I downloaded the predictions and the training dataset, but, to date, have only looked at the former. Suffice to comment that there were a few slightly negative comments about data quality relating to the OSM source (see above). Note the 17000 items at 10 items an hour, which probably understates time spent searching, represent approximately 1 person year effort of data capture, and it is free!
I downloaded the predictions and the training dataset, but, to date, have only looked at the former. Suffice to comment that there were a few slightly negative comments about data quality relating to the OSM source (see above). Note the 17000 items at 10 items an hour, which probably understates time spent searching, represent approximately 1 person year effort of data capture, and it is free!
Comparison
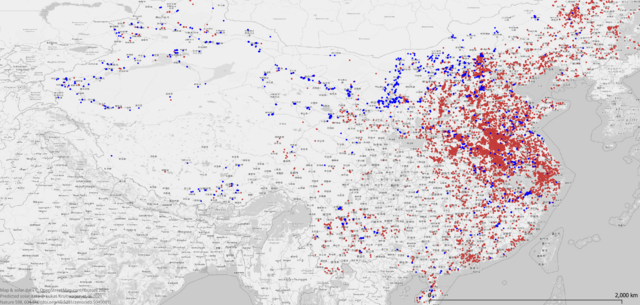 Comparison of solar power locations on OSM (blue) and those predicted by Kruitwagen (dark red). Original Image on Wiki.
I’ve done a couple of comparisons, but want to focus on China, because this is the area which may probably has the most large solar farms missing on OSM. I’ve looked a few times, but have generally found searching for solar by hand not very productive in China.
China
One very useful feature of this dataset is that it is richly annotated with a range of attributes, including country iso codes. It was therefore easy to select a subset for China. I did no filtering on size. There are around 18,500 of which about a fifth occupy more than 10 ha and half are estimated to have a capacity of 1 MW or more.
OSM data were pulled down using Overpass-turbo. Both power=plant and power=generator with a method tag of solar were needed as many large solar farms are still mapped as single generator areas. No attempt was made to exclude power=generator within power=plant, or very small household rooftop installations. I believe virtually all solar power mapped in China in the form of large scale solar farms.
I generated a simple intersections between the two data sets, and then found all items in the predicted data set which did not intersect an existing OSM object. Although the intersection finds over 7000 objects these correspond to about 2,500 items in the predicted set, leaving nearly 16,000 still to be found (see map above).
I’ve looked at a very small number and have not spotted any obvious false positives, although there are some structures which resemble solar panels which are difficult to interpret (possibly related to intensive agriculture). Often doing so highlights just how much mapping remains to be done in China, with whole villages still not marked in any way.
Europe
A little bit about comparison across Europe.
This also definitely identifies missing solar plants. In Britain where we know we have mapped pretty much every plant producing over 1 MW, a comparison picks out quite small scale generators of a few hundred modules (~100-250kW) which in general get picked during detail mapping of rooftop solar. Elsewhere the Oxford data picks out both large solar farms and significant rooftop installations on industrial buildings. Of the small number of locations I examined in Britain, a couple were false positives – both times polytunnels. Overall, the predictions look good and find really quite small sites.
Conclusions
This looks an enormously useful resource, which can potentially be used to help improve the coverage of solar power generation on OSM. The CC-BY licence may be a slight hindrance.
Note that OSM is already one of the best source of geolocated solar power data, see the press release of the Southampton group from last year, and our own work in the UK including rooftop solar published by Dan Stowell, Jack Kelly et al.. Let’s keep it that way!
Thanks to Dan Stowell who pointed me to the data & Jon Pennycook who noticed the article in The Economist.
Discussion
Comment from H@mlet on 16 November 2021 at 14:45
Hi,
I wonder why the training the dataset is not licenced as ODbL ? It’s seems like an extract of OSM data.
And I’m curious about whether this training dataset has been fixed straight in OSM, or if there is a derivative database that could improve OSM…
I see that there is no mention of OSM in the Acknowledgements section on GitHub.
I’m not sure, but I think maybe an issue in the repository about these questions might be useful.
Regards.
Comment from RicoElectrico on 16 November 2021 at 18:22
Did they really need to manually fix the outline if every single row was mapped? Wouldn’t it just require a somewhat tuned ST_ConcaveHull?
Comment from SK53 on 16 November 2021 at 19:06
Thanks @H@mlet and @RicoElectrico. The same thoughts have occurred to me. I hope to have a detailed look at the training set, in which case I’ll do a diary entry.
Comment from PierZen on 18 November 2021 at 21:21
I downloaded the predicted file and looked at this area where we see a lot of structures with no spaces between each row of solar plants. osm.org/#map=18/40.010487/112.891686
From my own observation, Images available via Bing, ESRI and Maxar are not clear and detailed enough to assess if the structures are solar plants, greenhouse or nets over the plants.
As always, AI predictions are quite related to image quality. I wonder if the team had better images to interpret the structures observed.
Comment from SK53 on 18 November 2021 at 22:58
@PierZen : thanks for the comment. I’ve had similar issues in interpreting these very dense structures without gaps. There are obvious solar panels within this polygon which does suggest the others probably are too, but it would be nice to be sure.
I’ve now had a quick look at the training dataset & it’s quite clear that quite a lot of data did not come from OSM, and some must have come from aerial not satellite imagery.
Comment from Mateusz Konieczny on 19 November 2021 at 16:35
Maybe green for one in both datasets would be nice?
Comment from SK53 on 19 November 2021 at 16:45
I was avoiding using green because of people with colour-blindness. I haven’t done the reverse (ones on OSM, but missing from the predictions), but suspect it will be very low. This was a very quick analysis, not an in-depth examination of all aspects of the data.
Comment from Claudius Henrichs on 22 November 2021 at 13:29
I was using OpenInfraMap country statistics over the course of last month to complete power plant information that was lacking source tagging. So the OSM data quality has increased already a bit since this research was undertaken. While China is still underrepresented (as with all OSM data) there’s the oppossite extreme nearby: Japan has the highest rate of Solar plant tagged objects. So might be interesting to perform your comparison for Kruitwagen’s predictions and OSM.
Also I was wondering if the centroids of the predictions could be used as input for a Maproulette task to not copy over geometries, but ask mappers to look at tracing solar plant outlines at that location (similarly to Mapswipe narrowing down where to send mappers). Not sure if this approach would be compatible with CC licensing and if the mapping work would still be considered derivative. A good start would just be at Maproulette task for large installations.
Comment from SK53 on 23 November 2021 at 11:22
@Claudius Henrichs: Two points: