
 Image by kai Stachowiak. License: CC0 Public Domain
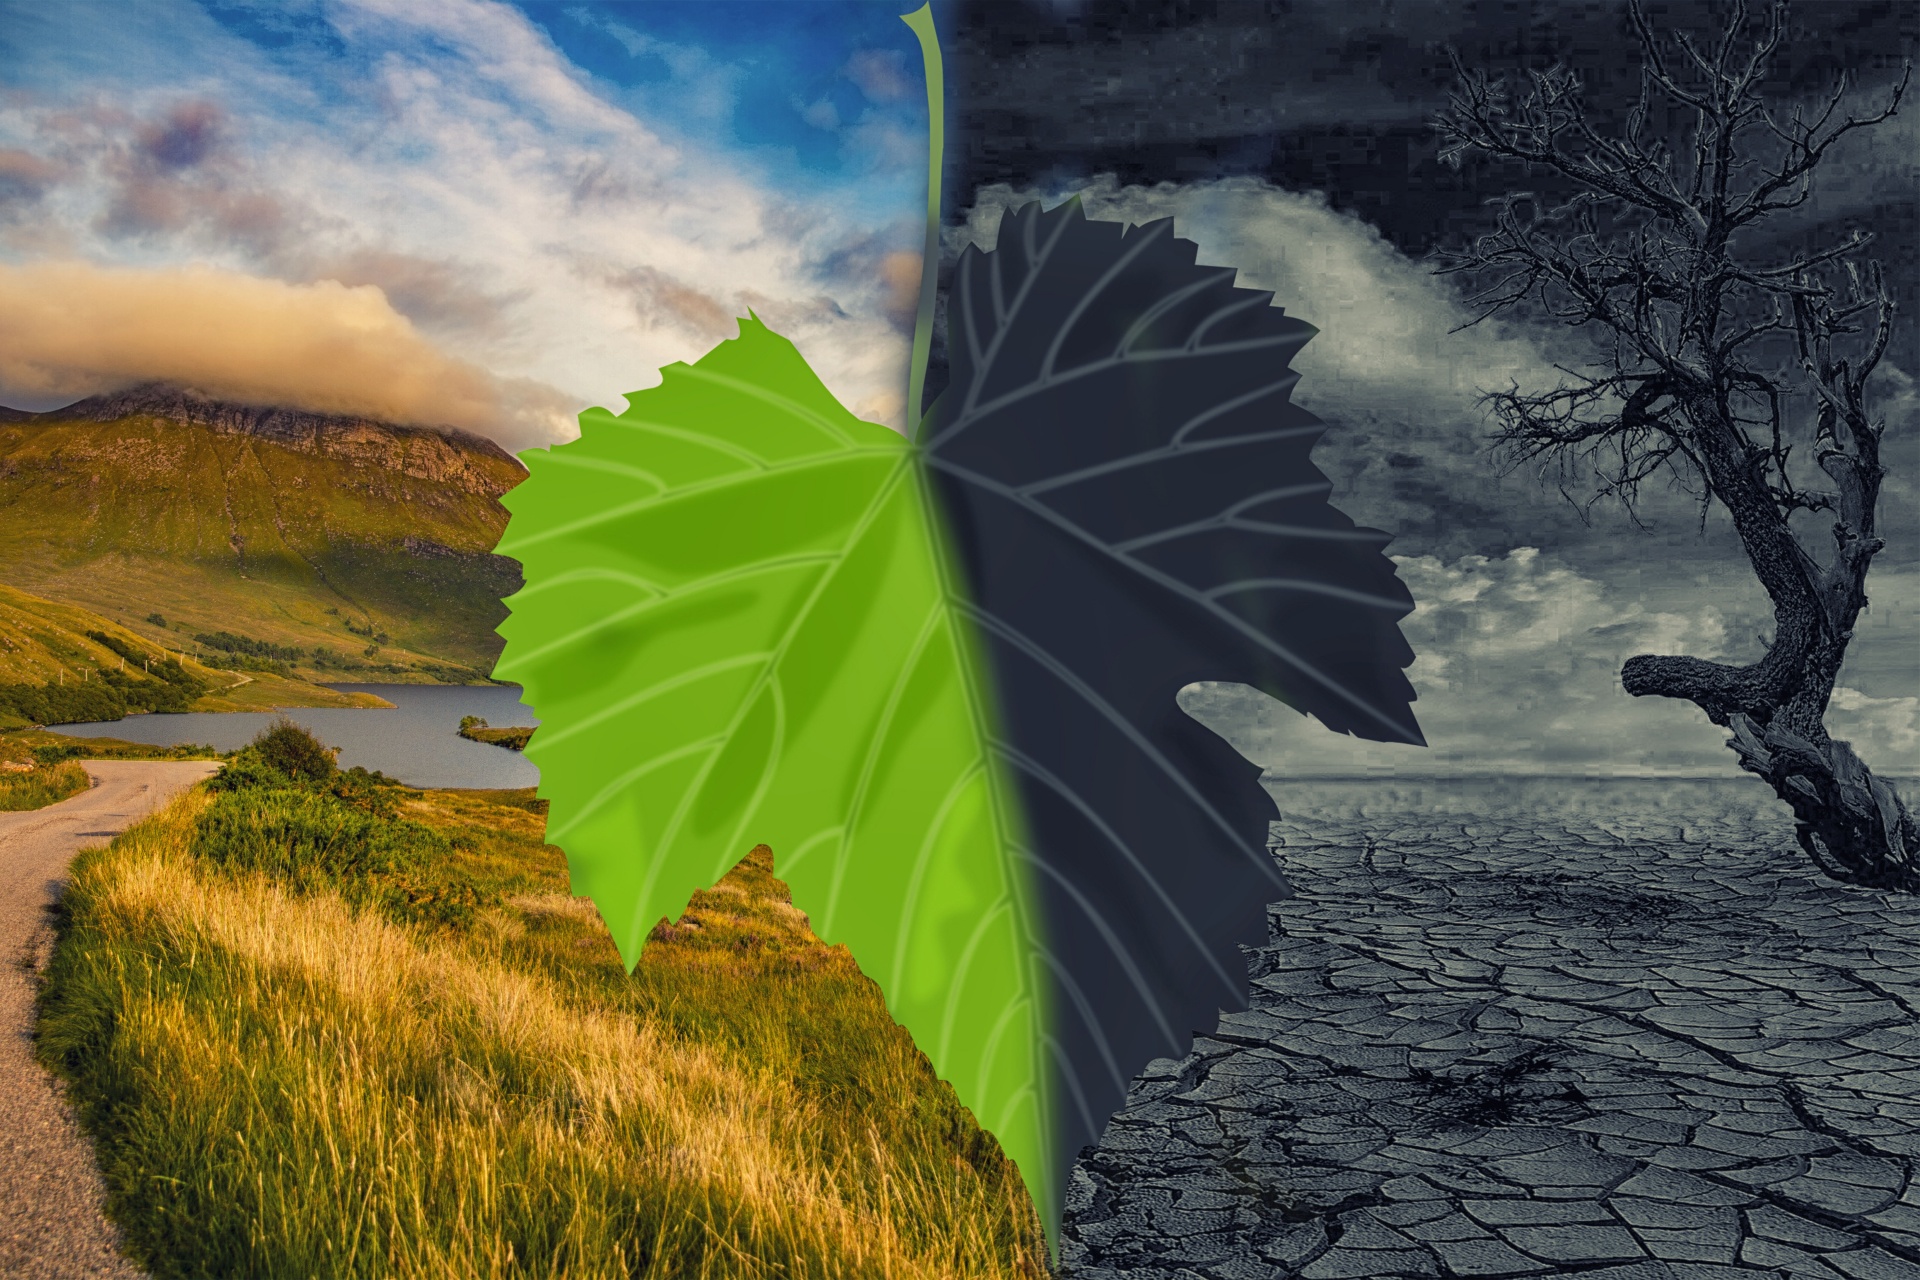
A few days ago I was in Bogotá, which at that time was affected by forest fires, which had raised interest in environmental issues in many people. In fact, at a mappers meeting, one of the topics of conversation was “what” to map to contribute in some way to making visible urban problems that are worsening with climate change.
The talk was long and rich and we all learned a little from each other. It is evident that more needs to be said about this so that people who want to contribute to mapping and in some way collaborate with climate change mitigation can easily find how to do so.
So, below are the mapping topics raised in that talk and some others that I added to the list as a result of conversations with other mappers.
Trees. Trees are cool, they add color to the landscape, they produce oxygen, they provide shade and if they are on hills they can help reduce the risk of landslides. Map them, we must. If in doubt, consult this tree mapping guide on the wiki.
Water sources. Water is life, and it covers a good part of our planet. Although there are many water bodies and courses, some are not yet mapped or need to be updated. Here are the labels and additional instructions. In the city it is also good to map water fountains, very necessary when the heat gets worse. Here how to label the various types of existing fountains.
Solid waste. Garbage is a common problem in many cities. In OpenStreetMap we can map garbage containers of various sizes, as specified here and here. Additionally, we can use this label for cases of contamination. Now, if we want to map the garbage itself, we can use the OpenLitterMap application that georeferences the garbage photos that we upload to the platform on an OSM-based map.
Noise pollution. Latin American cities can be bustling, sometimes too much. We know this from our own experience and we verify it with the sensors that are placed in various parts of the cities. To map these sensors, there are these instructions referring to various types of sensors - not just noise - and the specific label for noise. Noise barriers can also be mapped. But if you want to map the noise as such, a tool that lends itself to that is Umap. As an example you can look at this noise map of a neighborhood in the city of Medellín, Colombia.
Gardens. We map parks and green areas but sometimes we forget about gardens, and they do their part in beautifying cities, but above all they provide a space to relax and eliminate stress, either by resting in them or growing our favorite plants. Here are the instructions to label them correctly and with style precision. (Don’t forget to map the kitchen gardens, there are many networks of kitchen gardeners).
Coastline. There are countries that are in danger of disappearing due to climate change. Because global warming melts the polar ice, the water level rises, and these countries - low-lying islands - suffer the consequences. But other countries may also see part of their territory disappear for this same reason. We can map these areas in detail and then monitor them. Here is the label to use and also an explanation of the complexities of this type of mapping. To specifically map the water level see here and for floods here.
This post accepts suggestions and corrections, so I invite you to comment with your contributions to the topic.
Discussion
Comment from pedrito1414 on 1 February 2024 at 16:08
Comment from arnalielsewhere on 3 February 2024 at 15:34
yes!!! 100%%!!!!!
Comment from Pieter Vander Vennet on 12 February 2024 at 01:52
You might be interested in:
https://mapcomplete.org/trees https://mapcomplete.org/drinking_water https://mapcomplete.org/cyclofix (‘cause bicycles > cars) https://mapcompolete.org/waste
Comment from Cyberjuan on 14 February 2024 at 01:09
Thanks Pieter!!