Should we teach JOSM to first-time mapathon attendees?
Posted by dekstop on 7 December 2015 in English. Last updated on 8 December 2015.Joost asks in a direct message:
I’m organizing a Missing Maps event in Antwerp. One of the co-organizers wants to try giving a tweaked JOSM version on a USB stick to all the participants (preloaded settings etc) and use JOSM as a default editor. […] Did anyone try this at an event? Did you have a look at first timers using JOSM having a higher or lower OSM/MM retention? (It might be too much self-selection to really prove anything…)
I thought this was an interesting angle, and it connects with some of the work I’m currently doing, so I had a look at the data and am posting the results here. The short answer, based on a small sample: we’ve actually seen a difference in retention! However not in the way you might expect. I was surprised.
Before I begin I should say that I’m very interested in other perspectives on this question, particularly actual teaching experiences. This is a good scenario where statistics might be misleading, and where it helps to have actually talked to the mappers and observed what happened. Looking forward to people’s comments!
Preliminary caveats
It’s actually really hard to measure this well and generalise from past experiences, because every mapathon has its own story; different people attending, different things going right or wrong, etc. Different editors are also often used for different kinds of work: JOSM often gets used for field paper tracing and validation as well as satellite tracing. Unfortunately I haven’t been to most of the JOSM training sessions I’ll quantify below, so I don’t know what people actually did!
Furthermore, editor choice affects all kinds of follow-up considerations that may affect the outcomes of such a study; e.g. I’ve seen people forget how to launch JOSM a month after they first installed it, or OS updates causing java versioning issues, all of which is not something that can happen with iD.
And so on. You get the idea: many factors to keep in mind when we look at these numbers.
We can still look at general trends across the JOSM newcomers so far. Unfortunately there’s not a lot of observational data to make any strong statements, however I do think we can see some trends. And I’d certainly say that there is plenty of scope for further experiments!
Our observations so far…
The following statistics compare two groups of attendees at our monthly Missing Maps event in London: people who started with iD at their first mapathon, and people who started with JOSM. To make the comparison somewhat fair I’m only looking at attendees who have little prior OSM experience, with no more than 5 days of prior OSM contributions before their first mapathon attendance. I’ve also excluded the small number of people who used both editors at their first mapathon.
At our monthly mapathons, 37 people started with JOSM right away, spread across 12 events. On the other hand 298 first-time mappers started with iD (13 events).
Activity at the first event
16% of the JOSM mappers contributed for more than 2h in the initial mapathon edit session; this is about half as much as the people starting with iD, where 33% contribute for more than 2 hours. A histogram of their session durations illustrates the difference:
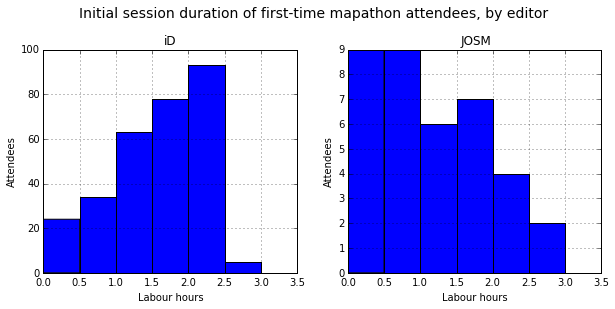
You may notice that the two distributions are quite different. JOSM contributors tend to have shorter contribution sessions. I verified that this is a general pattern across multiple events, and not biased by a single mapathon. Note however that this does not necessarily mean that JOSM trainees tend to lose patience more quickly – they may simply be doing different kinds of work.
Update: As Joost suggests in the comments, it might also simply mean that JOSM collects edit timestamps differently. In past explorations I’ve seen JOSM preserve timestamps for individual edits within a changeset, but I don’t know enough about the editor to understand what exactly is going on.
Short-term retention
Joost however was asking about the impact on retention, so let’s see what happens in the days and weeks after the first attendance. For that we will observe everyone’s subsequent contributions to HOT, at home or at a mapathon, up to a period of 90 days after their first mapathon attendance.
A month later the picture flips. 32% of JOSM newcomers were still active 30 days after they first came to a mapathon. On the other hand, only 20% of iD users were still mapping.
To assess these numbers further we can look at survival plots, these show how likely it is that a certain group is still active after some time has passed. Most importantly they tell us whether these trends are statistically significant.
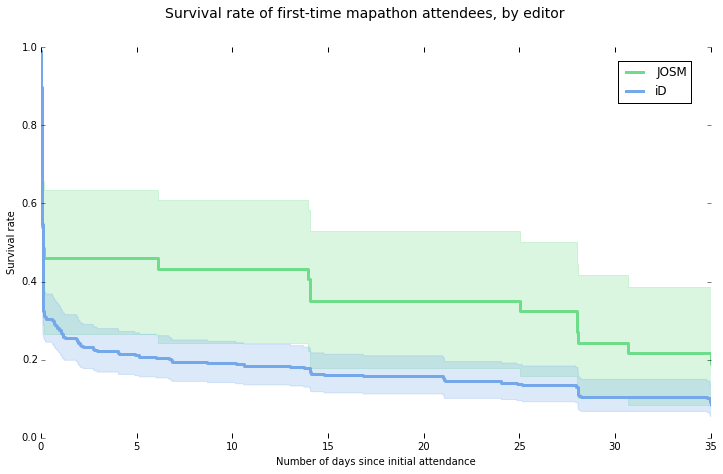
The wide confidence interval for the JOSM group (the shaded region around the curves) illustrates how little data there is. The JOSM group has larger confidence intervals, which means there is a variety of retention profiles in this group, and not enough samples to determine a clear trend. As a result the confidence intervals of the two curves overlap, which means there’s likely not enough data to say for certain that the groups differ significantly.
However the curves do suggest an apparent trend: at Missing Maps monthly events, people who start with JOSM tend to remain actively engaged for longer.
Conclusion
Unexpectedly for me we do get some clear differences in outcome when looking at Missing Maps monthly events in London! Namely:
- I looks like newcomers learning JOSM were more likely to stop early in their first session, compared to iD trainees. (Alternatively, JOSM and iD differ in how they collect edit timestamps.)
- On the other hand, a larger share of JOSM trainees were retained as mappers over the following weeks.
Although I was surprised by this, this is not actually entirely unexpected. JOSM use tends to be associated with higher engagement: the most active mappers are often JOSM users.
However this does not necessarily mean that JOSM is the key trigger. It might simply reflect that the JOSM mappers at our events are a great bunch of people, fun to hang out with, and many of them know each other quite well; whereas the people at our iD tables are typically newcomers who are not yet as well-connected to the community. So maybe the difference is in the people, not the editor.
In closing I would say that we need many more observations across different kinds of settings to make these statistics meaningful. At the moment this is little more than anecdotal evidence. There’s definitely space for further experiments!
Discussion
Comment from joost schouppe on 7 December 2015 at 19:24
Hi Martin,
This is a slightly more elaborate answer than what I expected :)
Here’s some thoughts: - the longer term retention is worth keeping an eye on as numbers increase, keeping in mind selection and social effects of course - are you sure the difference in labour hours at the events is real and not an artifact of the way JOSM and iD save information to the database? For example, if you take the difference between first and last object saved as labour time, that might affect JOSM negatively. Did you (or could you try) look at the last save during an event minus the start time of the event? Probably difficult on a larger scale, but might be worth a check at a single event. - you filtered away the people who used both editors. It might be interesting to see if they started off using JOSM and gave up to fall back to iD or if they took the other way around. If it looks like the former, one can imagine more people giving up before having anything worth saving.
Thanks again. We’ll think about how we can experiment more at our events in Belgium.
Comment from dekstop on 7 December 2015 at 19:29
Ah you’re right – it is possible that JOSM captures changeset timestamps differently. In past explorations I’ve seen JOSM preserve timestamps for individual edits within a changeset, but I don’t know enough about the editor to understand what exactly is going on.
Only 6 people used both editors at their first event, so I felt it’s better to simply ignore these :)
Comment from Warin61 on 7 December 2015 at 20:22
What is the coverage factor in the confidence interval? Around 2 is usual for metrologists.
I don’t think difference of the initial contribution should be a deciding factor. People learn differently. Most would ‘test’ at a later time, so sampling as , say 2 months later for contributions, and the number of nodes added/modified/deleted? With possible follow up at 1 and 2 years?
Comment from RobJN on 7 December 2015 at 21:47
Would HOT be interested in creating their own fork of JOSM? Would allow for plug-ins along the lines of the telenav ImproveOSM plugins.
Comment from Richard on 7 December 2015 at 22:41
There’s two variables which need to be taken into account. One, obviously, is the background of the learner: if you’re a GIS professional you’ll feel right at home with JOSM, whereas if you’re a human being (ok, I jest, but a less experienced user) you’ll probably take to iD better.
But the other is the background of the instructor. A lot of experienced OSMers have lots of practice in JOSM and very little in any other editor. This results (and I’ve seen it) in the instructor trying to use the online editor as they would JOSM, then getting frustrated when it doesn’t work the same. On average, a JOSM-native instructor is less likely to give good tuition in iD than in JOSM.
Comment from dekstop on 7 December 2015 at 23:29
I forgot to mention that we also regularly have mid-monthly events for more experienced volunteers. These are often focused on JOSM work, and many of our most active members come to those, whereas first-timers rarely ever do. You can see fairly prominent steps in the JOSM survival plot around the 14- and 28-day mark, these are likely an artefact of this mid-monthly and monthly mapathon cycle.
If editor choice was the only contributing factor for contributor retention then the presence of this additional event for JOSM people should not make a difference. However we could consider social mapping events as attractors, as reasons to remain engaged, in which case these retention differences between groups would support a growing body of evidence that for HOT volunteers, social factors are strong motivators for engagement.
(It would also make the direct comparison between the groups unfair, because there are more social occasions for JOSM than for iD…)
Comment from dekstop on 7 December 2015 at 23:40
Warin61 – unfortunately I have no idea how to calculate a coverage factor for survival curves! I’m using the lifelines Python library which doesn’t have that feature. But pointers at how to compute it will be appreciated. (Note that the data is not normal distributed, which will likely complicate things.)
RobJN – I’ve heard HOT people discuss custom iD interfaces many times, I expect there would be similar interest in a HOT-specific JOSM distribution. And I’m sure there are plenty of customisations already in the wild. Let’s see what the Antwerp group will produce!
Richard – very true, nice examples.
Ralph also emailed a longer reply with some training experiences in London, I’ll ask him if he wants to post it here.
Comment from Sanderd17 on 8 December 2015 at 08:30
Very interesting stats.
But next to the time mapped on the first event, it would probably also be nice to see the amount of work done on the mapathon (number of nodes, number of ways, number of tags, …)
Measuring the number of elements isn’t such a good way to determine the value of the work (it doesn’t matter if all landuse is complete, when even the most important streets aren’t present). But given that mapathons usually focus on a certain job, it should be more comparable than regular mapping I guess.
I agree with Richard that the lack of knowledge on iD is often a very real problem for potentional teachers. And I guess Joost would agree too, as the quest on the talk-be mailing list to find someone who feels comfortable with iD and wants to teach it is still going on.
Comment from LivingWithDragons on 8 December 2015 at 12:29
It would be ideal if you linked to (or at least mentioned) where Joost’s quote/question comes from, so people can see any discussion happening directly off that.
I’m interested in how the editor options are presented at Missing Maps events and thus how people consider or make a choice on which editor to use.
In leading workshops (including Missing Maps), I usually go through with iD even though I tend to only use it in demonstrations and can’t answer a number of questions I might get. I sometimes refer to “other editors” or specifically JOSM. I led a workshop of geography masters students and expected to focus more on JOSM, until I learnt most didn’t have GIS experience and some struggled to use a web browser “correctly”.
Comment from Vincent de Phily on 8 December 2015 at 12:39
There’s probably a correlation between what makes newbies start with JOSM instead of osm.org’s default and what increases contributor retention time. The newbie being more technology-savvy and the mentor being more enthusiastic with JOSM spring to mind, but these are just guesses.
Maybe we should assign first-time editors at random during some mapathons, and ensure that fans of each editor are available for mentoring ?
Comment from pedrito1414 on 8 December 2015 at 13:18
Just to address Richard’s points quickly (and anecdotally)….
From what I have seen at the London mapathons, it’s not just GIS pros who take to JOSM quicker. It seems that people who deal with any / many types of software professionally (I guess the ‘techier’ end of the mapping party attendee spectrum) get frustrated with iD quickly and take to JOSM very easily.
On the trainers, I can say that as the Missing Maps / HOT London community is quite mature, we actually usually have people who learnt to map using iD at mapathons as the iD trainers. It’s rare that our JOSM experts do this - they more often put their efforts into helping JOSM learners / training validators. This means the iD training is usually quite appropriate for the newbie audience.
Great post @Martin!
Comment from Harry Wood on 8 December 2015 at 13:56
We actually used to introduce people to JOSM from the get-go a lot more than we do now. Certainly at humanitarian events I’ve organised before Missing Maps started. In fact there was one back in 2010 where I had no choice, because we needed WMS-supplied imagery. And on that occasion it was bit of a nightmare. Thankfully things have moved on a lot since those days (most of the JOSM UI issues I mentioned there have been fixed since, and we’re better at finding ways of not using WMS imagery) Even at the first few Missing Maps events, we followed the approach of presenting the choice, but then demoing the install of JOSM, or asking people to come with JOSM installed.
Why did we move to a more iD-ish approach? I think we used to have a very high proportion of absolute beginners, and some early experiences of mapathons, put us off JOSM a bit. It felt very chaotic as >50 people started downloading JOSM for the first time (the download itself can immediately create an internet bandwidth issue for a start) and then asking questions about how to install on different operating systems and versions of java!
But yeah I’ve always said, new users are actually better off going straight to JOSM, for a better more fluid editing experience. BUT…. certain types of new users will find it easier. As Pete says, “people who deal with any / many types of software professionally”, which is probably at least 50% of the new folks coming to these events actually. So the thing is, depending on this proportion, and the number of experienced people you have on hand to help… getting lots of beginners started on iD can be a lot easier for event organisers. With iD you can write out instructions which will work for everyone, and these will fit on one piece of paper.
Comment from dekstop on 8 December 2015 at 14:10
LivingWithDragons – it was personal correspondence, Joost had contacted me by DM.
Vincent – I would love a random assignment study! It requires some discipline to set up correctly though, plus it introduces artificial side-effects; e.g. people may get separated from their friends. It’s hard to do social studies well.
Pete and Harry – some very insightful comments, thank you both!
Comment from Warin61 on 8 December 2015 at 21:51
On the stats;
Distribution; These are resolved into ‘normal’ (Gaussian) distributions so they can be compared, combined or otherwise dealt with. This is an easy thing to do with symmetrical distributions (rectangular, triangular, ‘U’ etc) using a simple multiplier. More difficult with a non symmetrical distribution… I never came across one of these so did not delve into these.
Coverage Factor; I’m no Python expert.. But other programs resolve this into a coverage factor of approximately 1, unless custom written or the coverage factor can be varied by command.
So on an assumption that this program responds similar to others… coverage factor would be 1 and a normal distribution.
On JOSM; When I started OSM contributions I looked at what was available and went for JOSM as the tool that had all the commands. In the past I have been started on the ‘learning’ tools and then had to learn the next more complex tool to do more a complex something, then the next. Waste of time! When I have the choice .. I start with the most complex tool… saves a lot of time for me. Past programming experience has been from machine language (binary and symbolic), interpreters to WYSIWYG. So at the ‘tecky’ end of the scale.
Comment from GOwin on 9 December 2015 at 15:11
Very interesting data @Desktop. What does your data say about ID editors who move to other editors (JOSM?), and vice versa? My theory is that if new mappers are really interested in mapping in the long her, they’d learn about JOSM eventually, and likely on their own.
Our experience in the Philippines is to teach with iD for mapathons or introductory workshop/mind-seeding events, but promote JOSM during hands-on work to demonstrate how much easier it is for certain tasks. Internally, our community continue to debate on this approach.
Comment from dekstop on 9 December 2015 at 16:39
GOwin – it’s indeed interesting to ponder the progression over time! I also expect it depends a lot on the specific setting.
I started looking at this for London events recently. At our monthly mapathons we now make an effort to promote JOSM use to people who are already comfortable using iD. This came from a realisation a few months ago that we need to build more expert capacity in our community; and it already has made an impact both anecdotally and empirically.
At our most recent mapathon, around 40 people were in the iD section; by far most of them were first-time attendees. Around 20 were at JOSM tables, these mostly had been at previous mapathons.
Empirically I found that the more often people return to our mapathons, the more likely they are to eventually learn JOSM. It’s unfortunately too early to put specific numbers on this – I need to take some time to develop this analysis further, and decide how best to capture the effect. It’s also a scenario where we don’t yet have too much observational data (because the JOSM group is still comparatively small), so I might let things develop for a few more months before I come back to this.
As a preview, here’s a visualisation that shows editor use per mapathon attendance for a subset of attendees (people with absolutely no prior OSM experience who attended at least twice):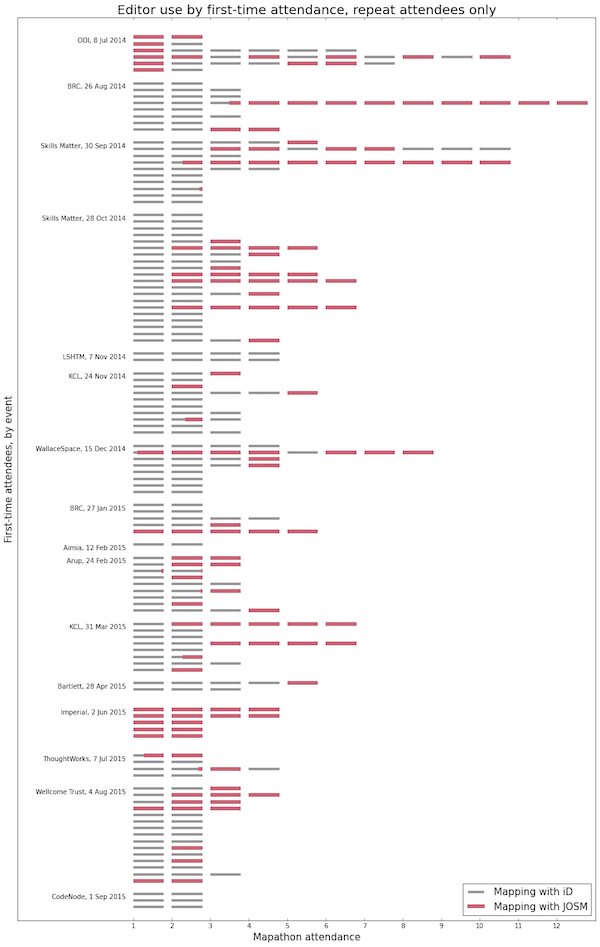
The attendance history for every first-time attendee is visualised from left to right. The left-most column is the first mapathon someone attends, every subsequent block towards the right is an attendance at a subsequent mapathon. Blocks are shaded red when people use JOSM during their session.
This shows that most people do start out with iD, but most long-time attendees eventually switch.
Again, this is mostly anecdotal, and directly influenced by how the London mapathons are organised.
Comment from scruss on 10 December 2015 at 12:50
Any breakdown by user’s OS? JOSM on Mac is deeply unpleasant.
(admission of bias: I will only use JOSM if absolutely nothing else will do the job.)
Comment from dekstop on 10 December 2015 at 12:52
Haha nice suggestion. Unfortunately I won’t have time to explore it – have a busy few weeks ahead with misc deadlines. But you’re right, there’s some further observational data we could make use of.
Comment from GOwin on 11 December 2015 at 01:09
@dekstop, I’m curious to know why you have separate tables for iD and JOSM editors. :) Also, it would be interesting what those users use outside of mapathon events.
Everyone will likely agree that iD editor is an easy-to-use, convenient editor. I personally still use iD for quick and simple edits, if I don’t have a running JOSM instance (because that’s quicker than JOSM’s startup time).
I think the progression from iD to JOSM is an indicator of a user’s sincere interest in contributing data. Learning JOSM is an investment in time and effort, and with first-time participants in mapping events, the steeper learning curve of JOSM vs iD is a possible turn-off, and we don’t want to turn people off based on their first impression.
What we’ve discovered about iD is that it’s seems to be a bandwidth hog, compared to JOSM. And bandwidth is always a challenge for many of the events we’re in to, which only adds to our frustration.