I spent this morning watching live online transcripts of State of the Map U.S. roll in. (What a time to be alive!) Each year, there’s a talk or lightning talk that looks to the future. Alan McConchie’s talk today imagines the project’s possible trajectories, both good and bad. The eventual outcome may end up being some combination of Alan’s scenarios: a ghost town in some respects, a garden in other respects, a Borgesian map in Germany even.
In most of my eight years armchair-mapping for OpenStreetMap, I’ve stayed pretty close to where I started: in my hometown of Cincinnati, Ohio, in the United States. At some point, especially after moving across the country to Silicon Valley, I must’ve imagined that I’d eventually map Cincinnati to completion and move on to other, less well-tended areas. But that never happened. Instead, I found myself mapping the same places over and over again, even as my interests expanded to neighboring counties and states.
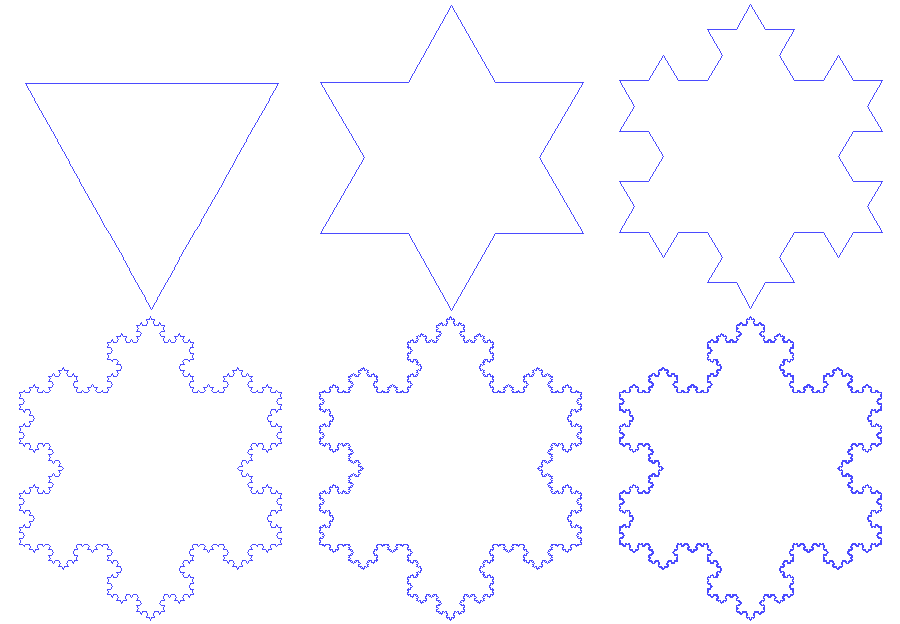
To me, OpenStreetMap behaves like a fractal: the beautiful structure in mathematics that gets more intricate the longer you stare at it.

Koch snowflake, António Miguel de Campos, public domain
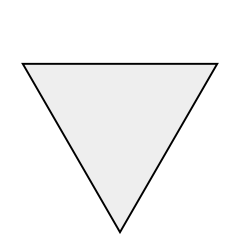
Iteration 0

Koch snowflake iteration 0, Wrtlprnft, public domain
The zeroth iteration, back in 2008, was tracing Yahoo! Aerial Imagery in Potlatch 1. Despite having tons of free time back then, the best I could do with the tools I had was:
- Realigning TIGER-imported roads to Yahoo!’s blurry imagery
- Dividing TIGER-imported freeways into dual carriageways, reclassifying them above
highway=residential, and adding them to relations - Removing “(historical)” GNIS-imported schools and post offices or retagging them as
historical=yes - Adding misshapen buildings (because Potlatch didn’t have a right-angle tool) that looked OK at z17
- Tracing river centerlines
- Delineating golf courses and cemeteries
Iteration 1

Koch snowflake iteration 1, Wrtlprnft, public domain
When the first iteration began sometime in 2010, allowing me to trace Bing aerial imagery in Potlatch 2, any area I mapped had to meet a higher standard. But I also couldn’t help but go back and retrofit the old areas – areas I cared about most – to meet this higher standard too:
- Realigning hand-drawn buildings to have right angles and look OK at z18
- Adding cul-de-sacs and crosswalks
- Adding soccer fields and tennis courts
- Tracing riverbanks and wooded creeks
- Tracing the paths in golf courses and cemeteries
- Expanding the network of high-voltage power lines
- Aligning county boundaries to better follow road and river centerlines
Iteration 2

Koch snowflake iteration 2, Wrtlprnft, public domain
Roughly each year since then, Bing and Mapbox have provided ever sharper imagery for the area, and that imagery has revealed just how much the world changes on a regular basis. Again I had to retrofit my original areas of interest:
- Adding traffic lights and alleys
- Adding new wings to industrial buildings as they expand
- Deleting houses as they’re torn down in urban renewal programs
- Replacing farmland with residential subdivisions
- Delineating and naming residential and retail developments
- Aligning city limits to changes in road pavement quality
Meanwhile, the community grew alongside the map. People with very different interests than me built up bicycle infrastructure, identified countless coffee shops, filled in the map’s background with land use polygons, and even cleaned up the buildings I’d previously drawn.
Iteration 3

Koch snowflake iteration 3, Wrtlprnft, public domain
These days, newer tools like iD and Mapillary mean so much more source material to map and so many more tempting presets to make use of:
- Realigning hand-drawn buildings to look OK at z19 and counting their floors
- Naming businesses that never would’ve caught my attention while field surveying
- Entering lane counts, speed limits, and turn restrictions
- Adding sidewalks, crosswalks, and driveways
- Adding backyard swimming pools
- Tracing drainage ditches
Bots, crowdsourcing tools like MapRoulette, and paid mappers are present, too, taking care of basic upkeep so fractal mappers like me can focus on the next level of detail.
The next iterations

Koch snowflake iteration 7, Wrtlprnft, public domain
Today at State of the Map U.S., there’s talk of mapping curbs and verges, of tracing “road banks” the way we started tracing riverbanks in iteration 1, of using 3D building data in ways that’ll probably require ever granular measurements. Machine learning is taking the gruntwork out of armchair mapping, freeing us to map even more creatively.
Each time I embark on a new iteration of the fractal, I get much the same overwhelming feeling that I got when I first opened Potlatch 1 back in 2008. It’s like we’re starting from scratch, filling in data we didn’t expect to ever care about, except the tools are right here to support us.
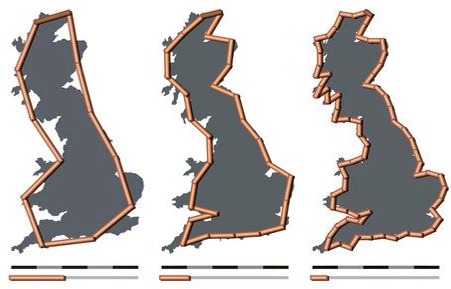
Whatever the future appearance of OpenStreetMap and its community, the full potential is, fittingly, a version of the coastline paradox. Unlike Borges’ map, OpenStreetMap’s fractal remains the same size but its complexity, accuracy, and precision keeps increasing. As new organizations and technologies push ordinary field and armchair mappers like me out of manual tasks we used to perform, we continue to push the boundaries of what can be mapped, what can be articulated about the world.

Great Britain’s coastline, measured at decreasing scale but increasing complexity, Alexandre Van de Sande, GFDL 1.2 or CC BY-SA 3.0

Discussion
Comment from imagico on 24 July 2016 at 17:54
Be careful here not to confuse progressive data representation and mapping strategies with fractals.
Fractals are characterized by self similarity and fractal shapes in physical reality are commonly the results of a self-organization process. This is widespread for natural shapes but is very rare for human generated structures. What you describe above is a progressive approach to mapping things, starting with a crude representation, both semantically and geometrically and refining it step by step. There is nothing fractal about this, there is commonly no similarity between either tags or geometric forms between different levels of refinement.
And it is not the fact that the coastline is longer when measured on a finer scale that makes it fractal-like, it is the fact that the relationship between scale and measured length has a simple form (power law) across a wide range of scales that causes this - see here.
Comment from Minh Nguyen on 24 July 2016 at 22:19
I knew I’d be called out for hand-waving! My idea was more to drive home the idea of an ever-more intricate map and a constantly rising standard for mapping, not so much the technical aspects of mathematical fractals.
Borges’ 1:1 scale map, which folks in the OSM community bring up from time to time, may be a warning about maintainability. But I think it’s also an argument that there’s real value to the work that armchair mappers produce – an abstract yet super-detailed representation of the world’s infrastructure – in an age when software may be able to automatically generate more realistic, point-cloud-based 3D models of the same infrastructure at greater scale, but with fewer insights. Hopefully that wasn’t too much psuedophilosophy for a late night.
;^)Comment from joost schouppe on 28 July 2016 at 17:01
Yes, yes, keep up the pseudophilosophy!
Exactly this simplification of reality is what makes a map useful. So maybe there’s a point where adding more detail to the map decreases its usability. We’re not quite there yet I think :)
Also, I do like your fractal analogy (even if it’s technically wrong). What is missing in it, is that the fractalisation is asymmetrical: in some places the detail level keeps going deeper, in other places it’s still a rough outline.