The damn deploy repository of the Divide and map. Now. has been refactored. And that’s a great opportunity for another round of load testing.
This is the third round of load testing, see the first and the second one if you are interested.
The load testing is a bit different from the last time. I performed load testing of new, freshly deployed damn project instance on $6/month VPS with 1 GB RAM, single 2.5 GHz vCPU, and 25 GB SSD. (The changes from the last time are that there is no more load testing of the “production” server, the price increased by $1/month, and shared_buffers is now 256 MB instead of 409 MB.)
The preparation for load testing on the server’s side, when the damn project is deployed, is just to run
docker-compose -f damn-deploy/gen.yml run --rm prepareloadtest
to create 1000 test users and 10 (load) testing areas in the database. For each run of load testing, the database has been deleted and created again with
systemctl stop damn-http.service
reboot
docker volume rm damn-deploy_damndb-volume
systemctl start damn.target
docker-compose -f damn-deploy/gen.yml run --rm prepareloadtest
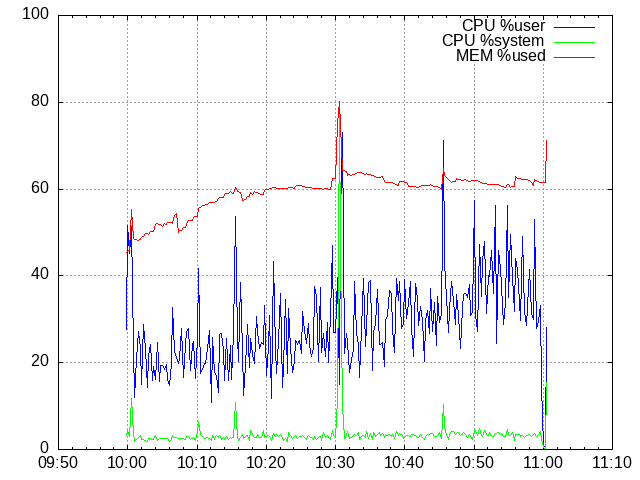
commands. For each run of load testing, log the server’s utilization with
sar -o load-test-100 -A 15 $((4 * 61)) 1>/dev/null 2>&1
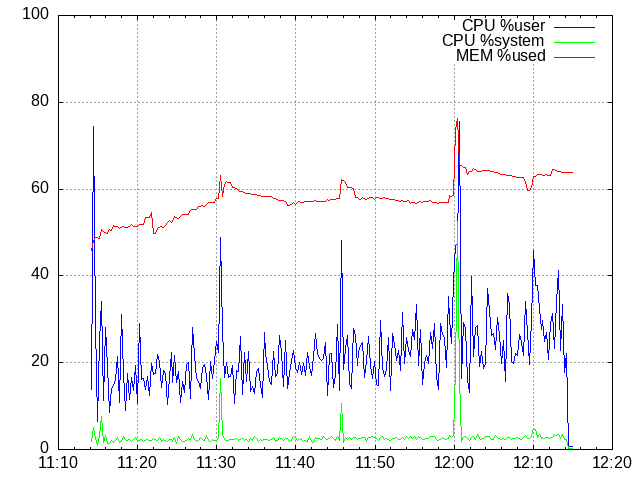
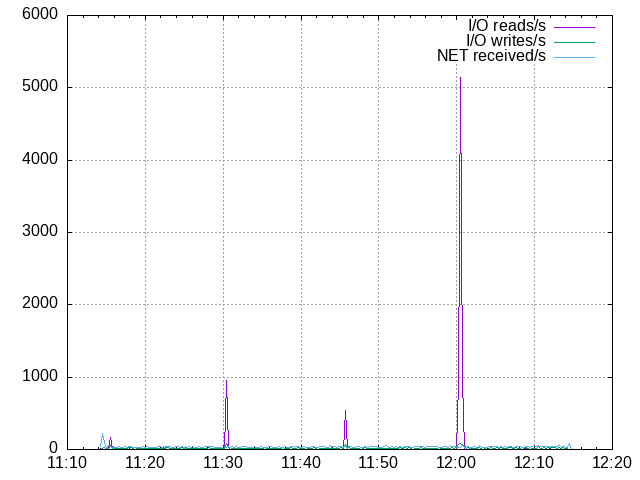
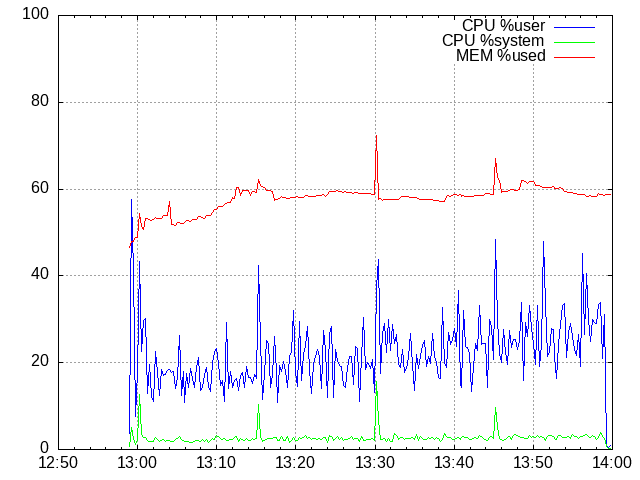
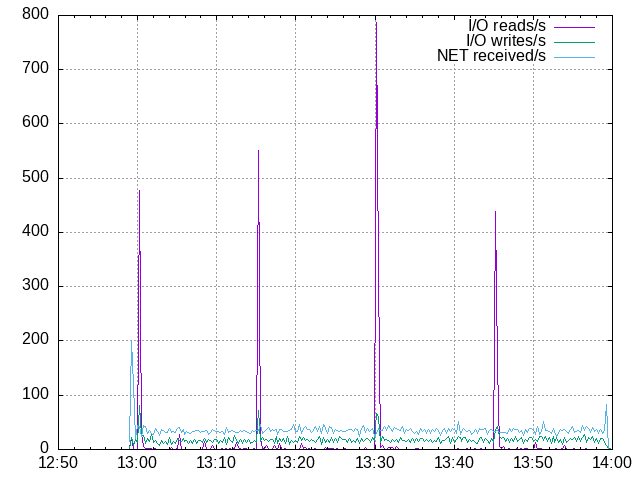
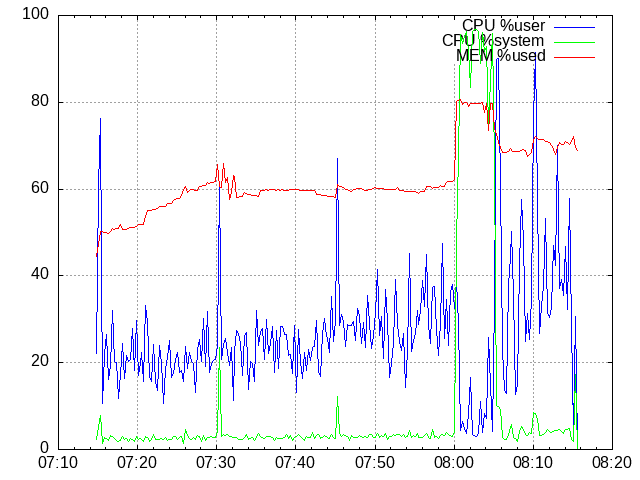
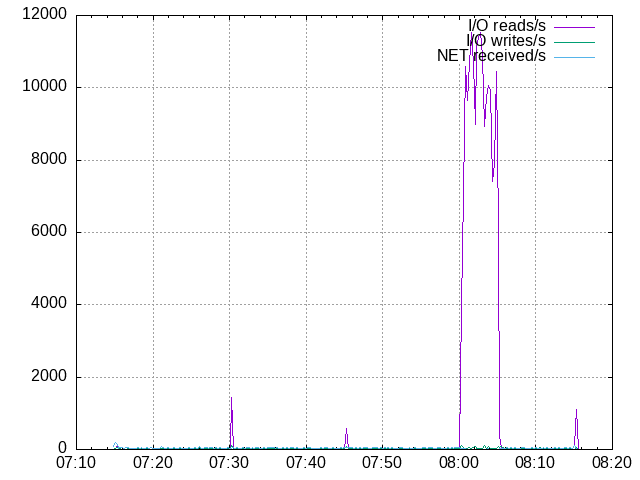
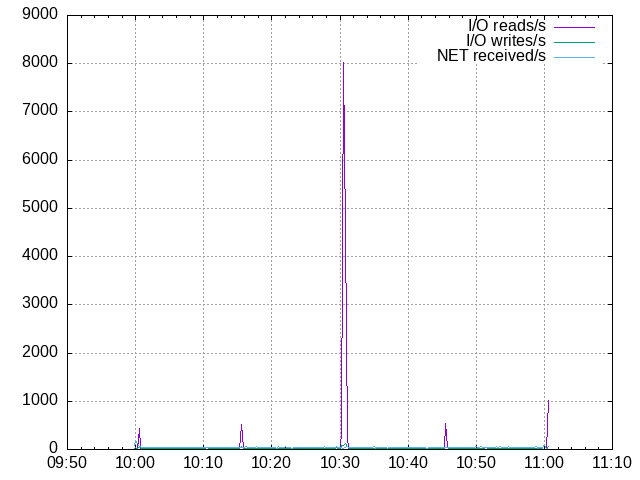
Then, from that file, you can generate data series and plot the graphs with
./get-info.sh 100
gnuplot plot1.pl
gnuplot plot2.pl
where the content of the corresponding files is
get-info.sh:
#!/bin/sh
set -eu

U=$1
F=load-test-$U

sar -f $F | sed 's/  \+/ /g' | cut -d' ' -f1,3 | head -n-1 | tail -n+4 > cpu-user.$U
sar -f $F | sed 's/  \+/ /g' | cut -d' ' -f1,5 | head -n-1 | tail -n+4 > cpu-system.$U
sar -f $F -r | sed 's/  \+/ /g' | cut -d' ' -f1,5 | head -n-1 | tail -n+4 > cpu-memused.$U
sar -f $F -b | sed 's/  \+/ /g' | cut -d' ' -f1,3 | head -n-1 | tail -n+4 > io-read.$U
sar -f $F -b | sed 's/  \+/ /g' | cut -d' ' -f1,4 | head -n-1 | tail -n+4 > io-write.$U
sar -f $F -n IP | sed 's/  \+/ /g' | cut -d' ' -f1,2 | head -n-1 | tail -n+4 > received-datagrams.$U
plot1.pl:
set grid
set xdata time
set timefmt '%H:%M:%S'
set format x '%H:%M'
set yrange [0:100]

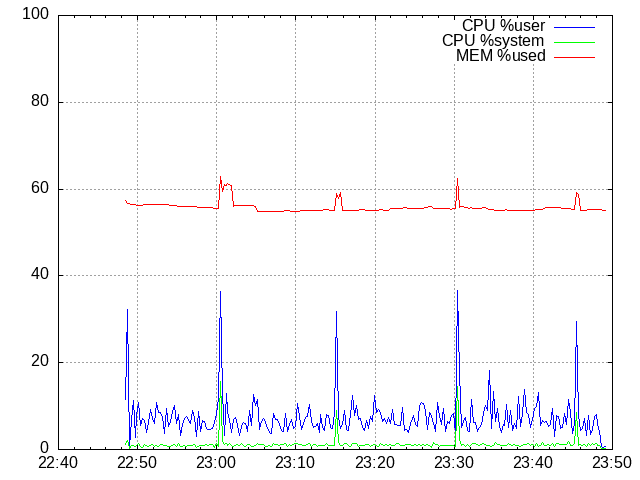
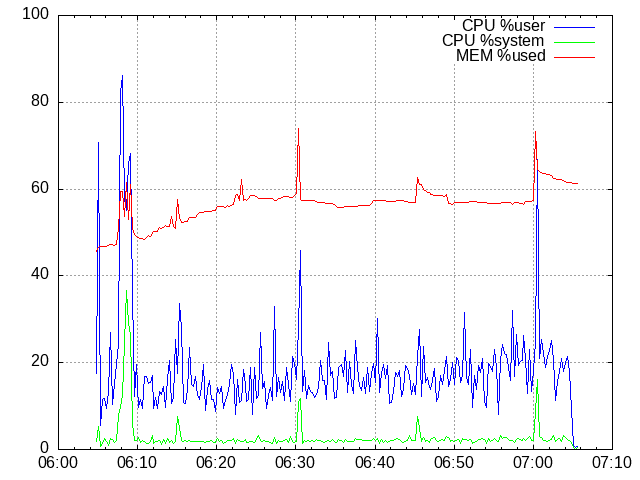
plot 'cpu-user.100' u 1:2 w l t 'CPU %user' lc 'blue', \
     'cpu-system.100' u 1:2 w l t 'CPU %system' lc 'green', \
     'cpu-memused.100' u 1:2 w l t 'MEM %used' lc 'red'
set terminal png
set output 'cpu-100.png'
replot
plot2.pl:
set grid
set xdata time
set timefmt '%H:%M:%S'
set format x '%H:%M'

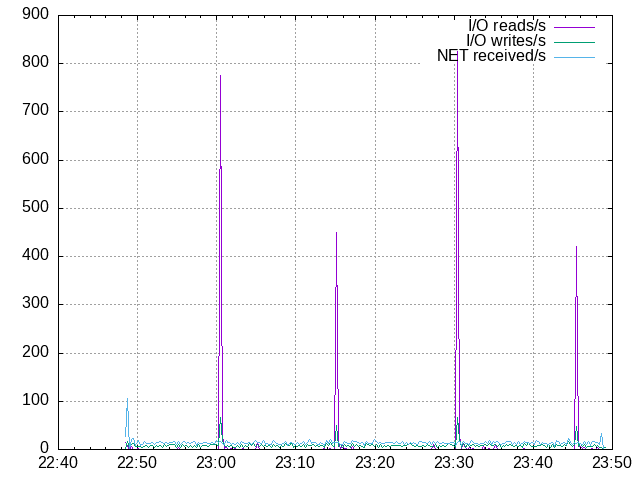
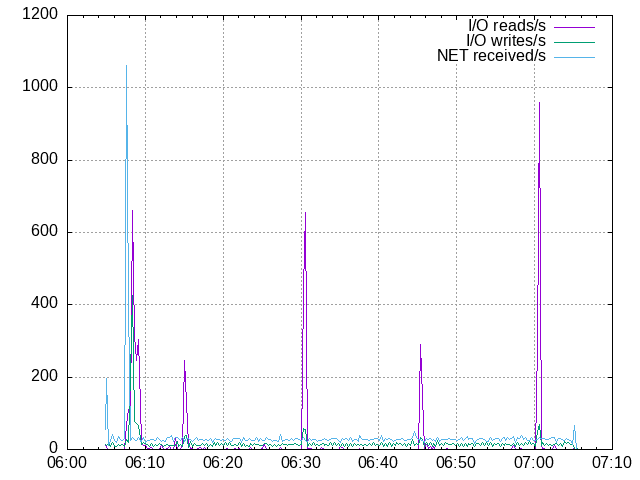
plot 'io-read.100' u 1:2 w l t 'I/O reads/s', \
     'io-write.100' u 1:2 w l t 'I/O writes/s', \
     'received-datagrams.100' u 1:2 w l t 'NET received/s'
set terminal png
set output 'io-100.png'
replot
On a computer to be used for (the server) load testing, clone the damn server repository, set the JWT_SECRET in the damn_server/conf.py file to the same value as is on the (load tested) server, and create virtual environment and start load testing with locust as described in the README (but don’t forget to change the URL of the (load tested) server accordingly).
cd damn-server
python3 -m venv tve
. tve/bin/activate
pip install -r requirements.loadtest.txt
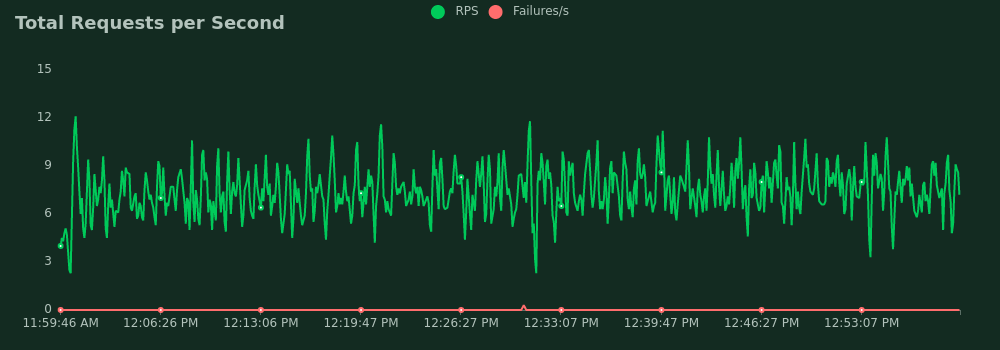
locust -f tests/mapathon.py -H https://current.DOMAIN_NAME -u 100 -r 10 -t 1h --headless --only-summary --html load-test-100.html
Load testing is performed by simulating a mapathon event for one hour. Given the number of mappers (e.g. 100), there is 64 % of newbie mappers, 16 % of advanced mappers, and 20 % of reviewers. Every mapper maps for 30 to 60 seconds and then waits for 30 to 60 seconds. Newbie mappers only map (recent, oldest, random, or nearest) squares. They may mark the square for review, or yet needs mapping, or split the square. Advanced mapper may in addition also merge the squares. Reviewers review the (recent, oldest, random, or nearest) squares and for each square decides if the square is done or needs more mapping. This logic is described in the locust file.
Well, I know, it’s probably not how the mapathoners do their mapping, but hey. It’s at least something. The following are the results.
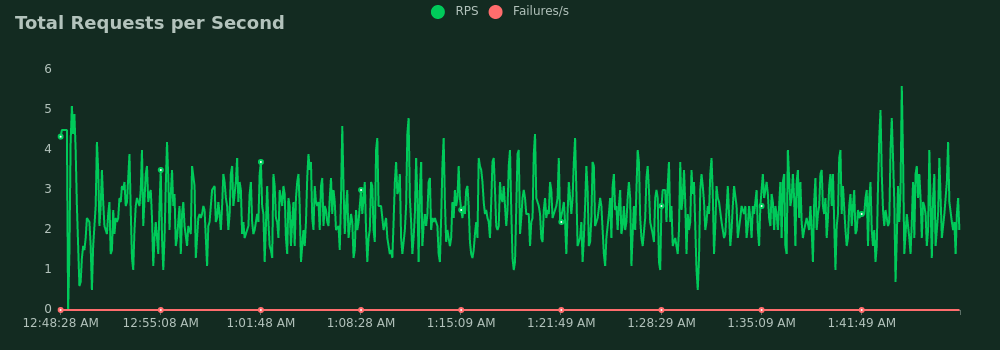
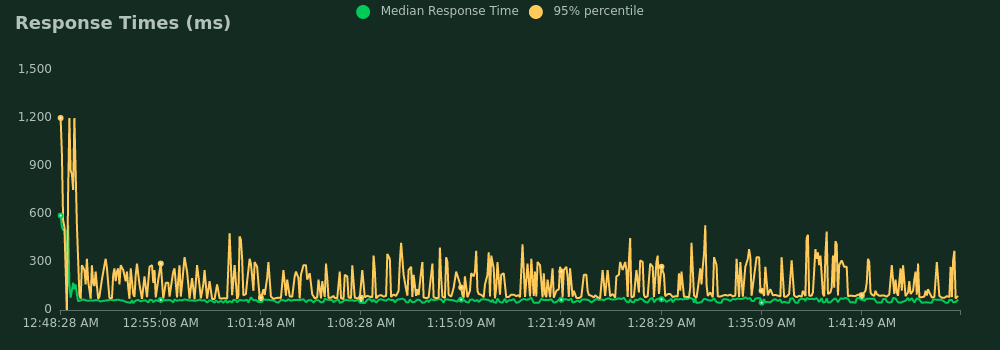
100 mappers
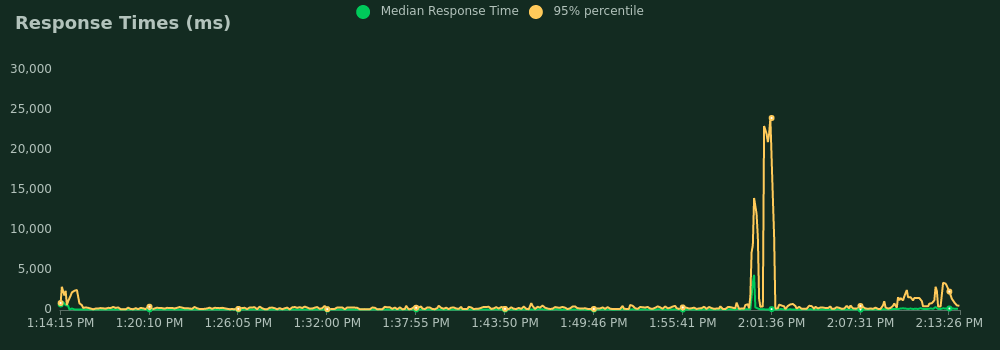
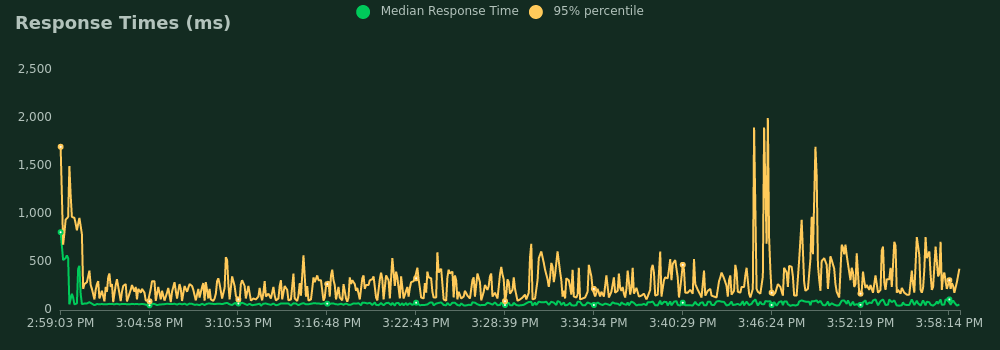
- Average response time: 75 ms
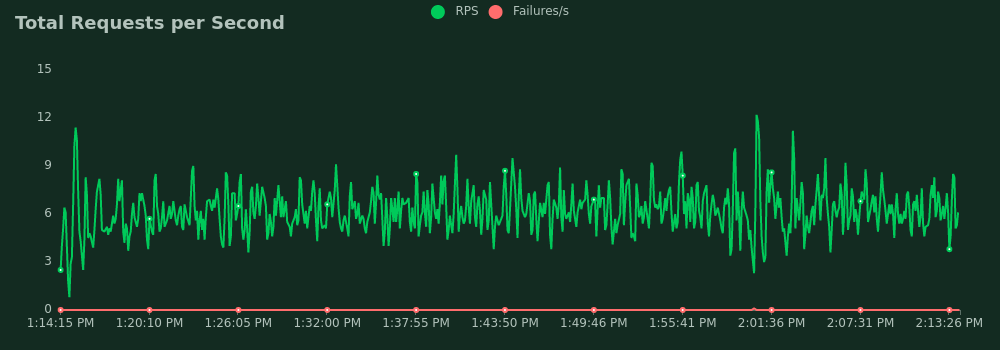
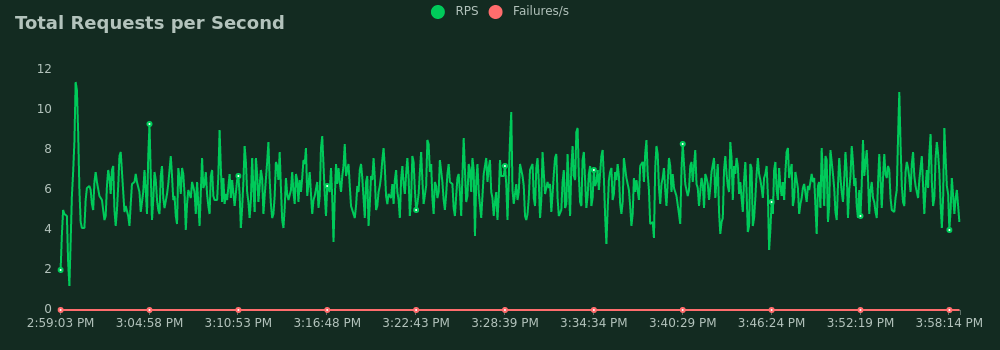
- Average requests per second: 2.5
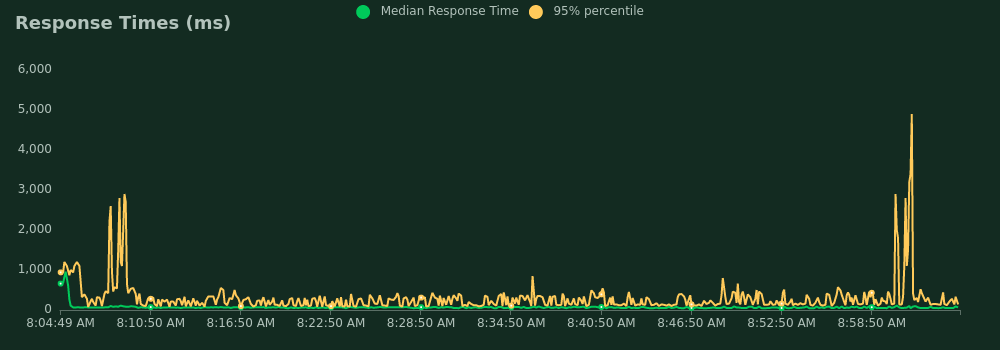
- 95 percentile response time: 200 ms
- The worst response time: 1.3 s
200 mappers
- Average response time: 100 ms
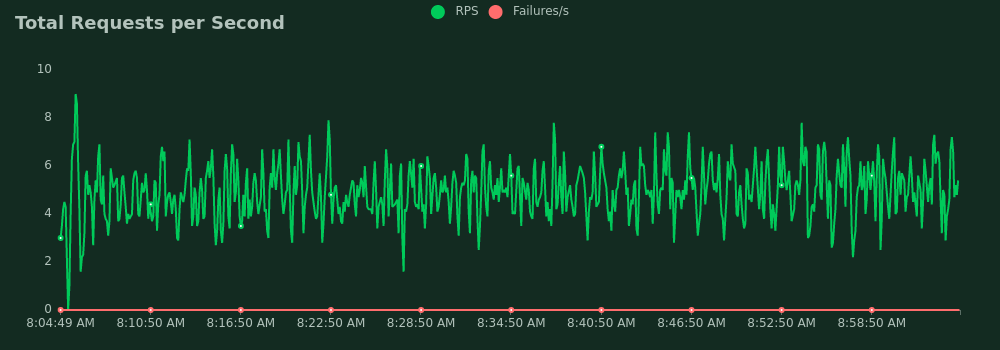
- Average requests per second: 5
- 95 percentile response time: 310 ms
- The worst response time: 7 s
250 mappers, first time
- Error occurences: 1
- Average response time: 190 ms
- Average requests per second: 6.2
- 95 percentile response time: 410 ms
- The worst response time: 31 s
250 mappers, second time
- Error occurences: 0
- Average response time: 100 ms
- Average requests per second: 6.2
- 95 percentile response time: 310 ms
- The worst response time: 5 s
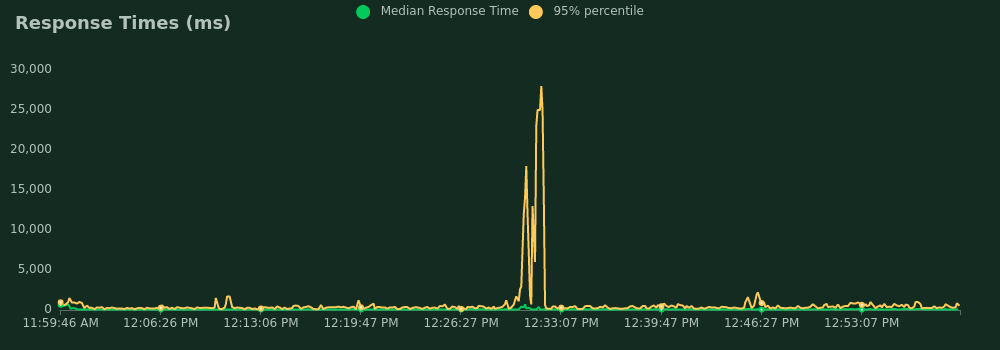
300 mappers, first time
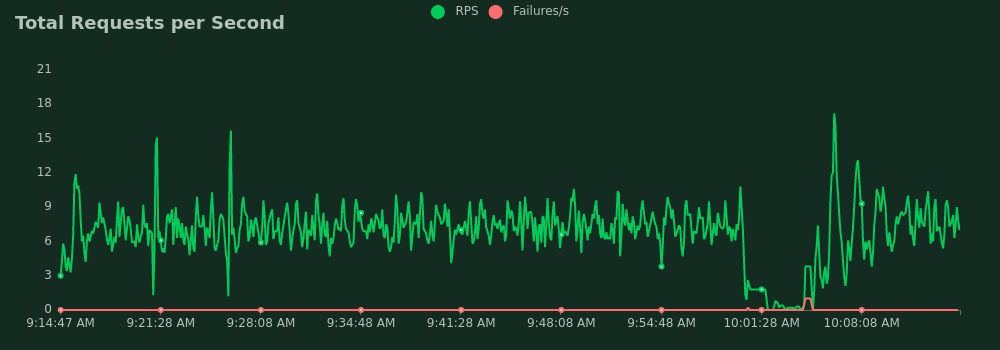
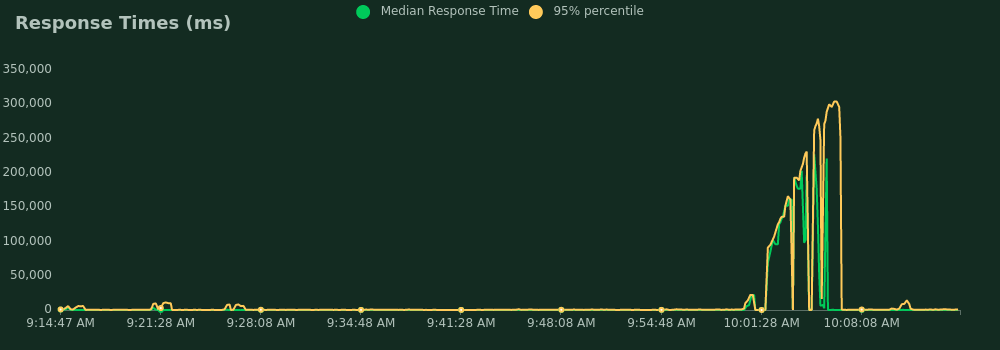
- Error occurences: 16
- Average response time: 3.5 s
- Average requests per second: 6.8
- 95 percentile response time: 800 ms
- The worst response time: 323 s
NOTE: Do not forget that shared_buffers is set to 256 MB from the total of 1 GB, so 80 % of the MEM means there is no free memory left.
300 mappers, second time
- Error occurences: 3
- Average response time: 190 ms
- Average requests per second: 7.4
- 95 percentile response time: 470 ms
- The worst response time: 35 s
And the conclusion? The most important is that a mapathon of 200 mappers still could have been handled.
Divide and map. Now. – the damn project – helps mappers by dividing a big area into smaller squares that people can map together.

Discussion