
OpenStreetMap’s 2021 survey wrapped up just over ten days ago, and the Board has posted summarized results on the Wiki. The geographic survey responses are aggregated to preserve anonymity, in some cases grouping dozens of countries under a single region. The maps below show simple survey results using the Board’s country-to-region mapping to make the responses easier to interpret.
All maps below should be considered “No Rights Reserved,” CC0, or public domain.
Mappers
Let’s start with the mappers. The majority of survey respondents worldwide agreed that the term “mapper” described their involvement with OSM:

To re-create the map above, and all other maps in this post, source tabular data, region GeoJSON, and a QGIS file are available in a Github gist.
Jennings Anderson posted earlier today with a view of worldwide mapping behavior to put the above results into context. He provides a simple methodology for determining who’s a local mapper for each survey region:
Assuming the mapper “lives” in this country is perhaps inferring too much, but we can definitively say that this mapper makes the majority of their recurring edits within this country, so they must have more knowledge of this country than any other.
The maps below show the prevalence of local and non-local mappers with more than one day of editing activity in each regional population according to Jennings’s data, with a high of 100-200 mappers per 1m total population in Western Europe and lows of ~0-25 mappers per 1m total population across South America, Africa, and Asia.


What Mappers Want
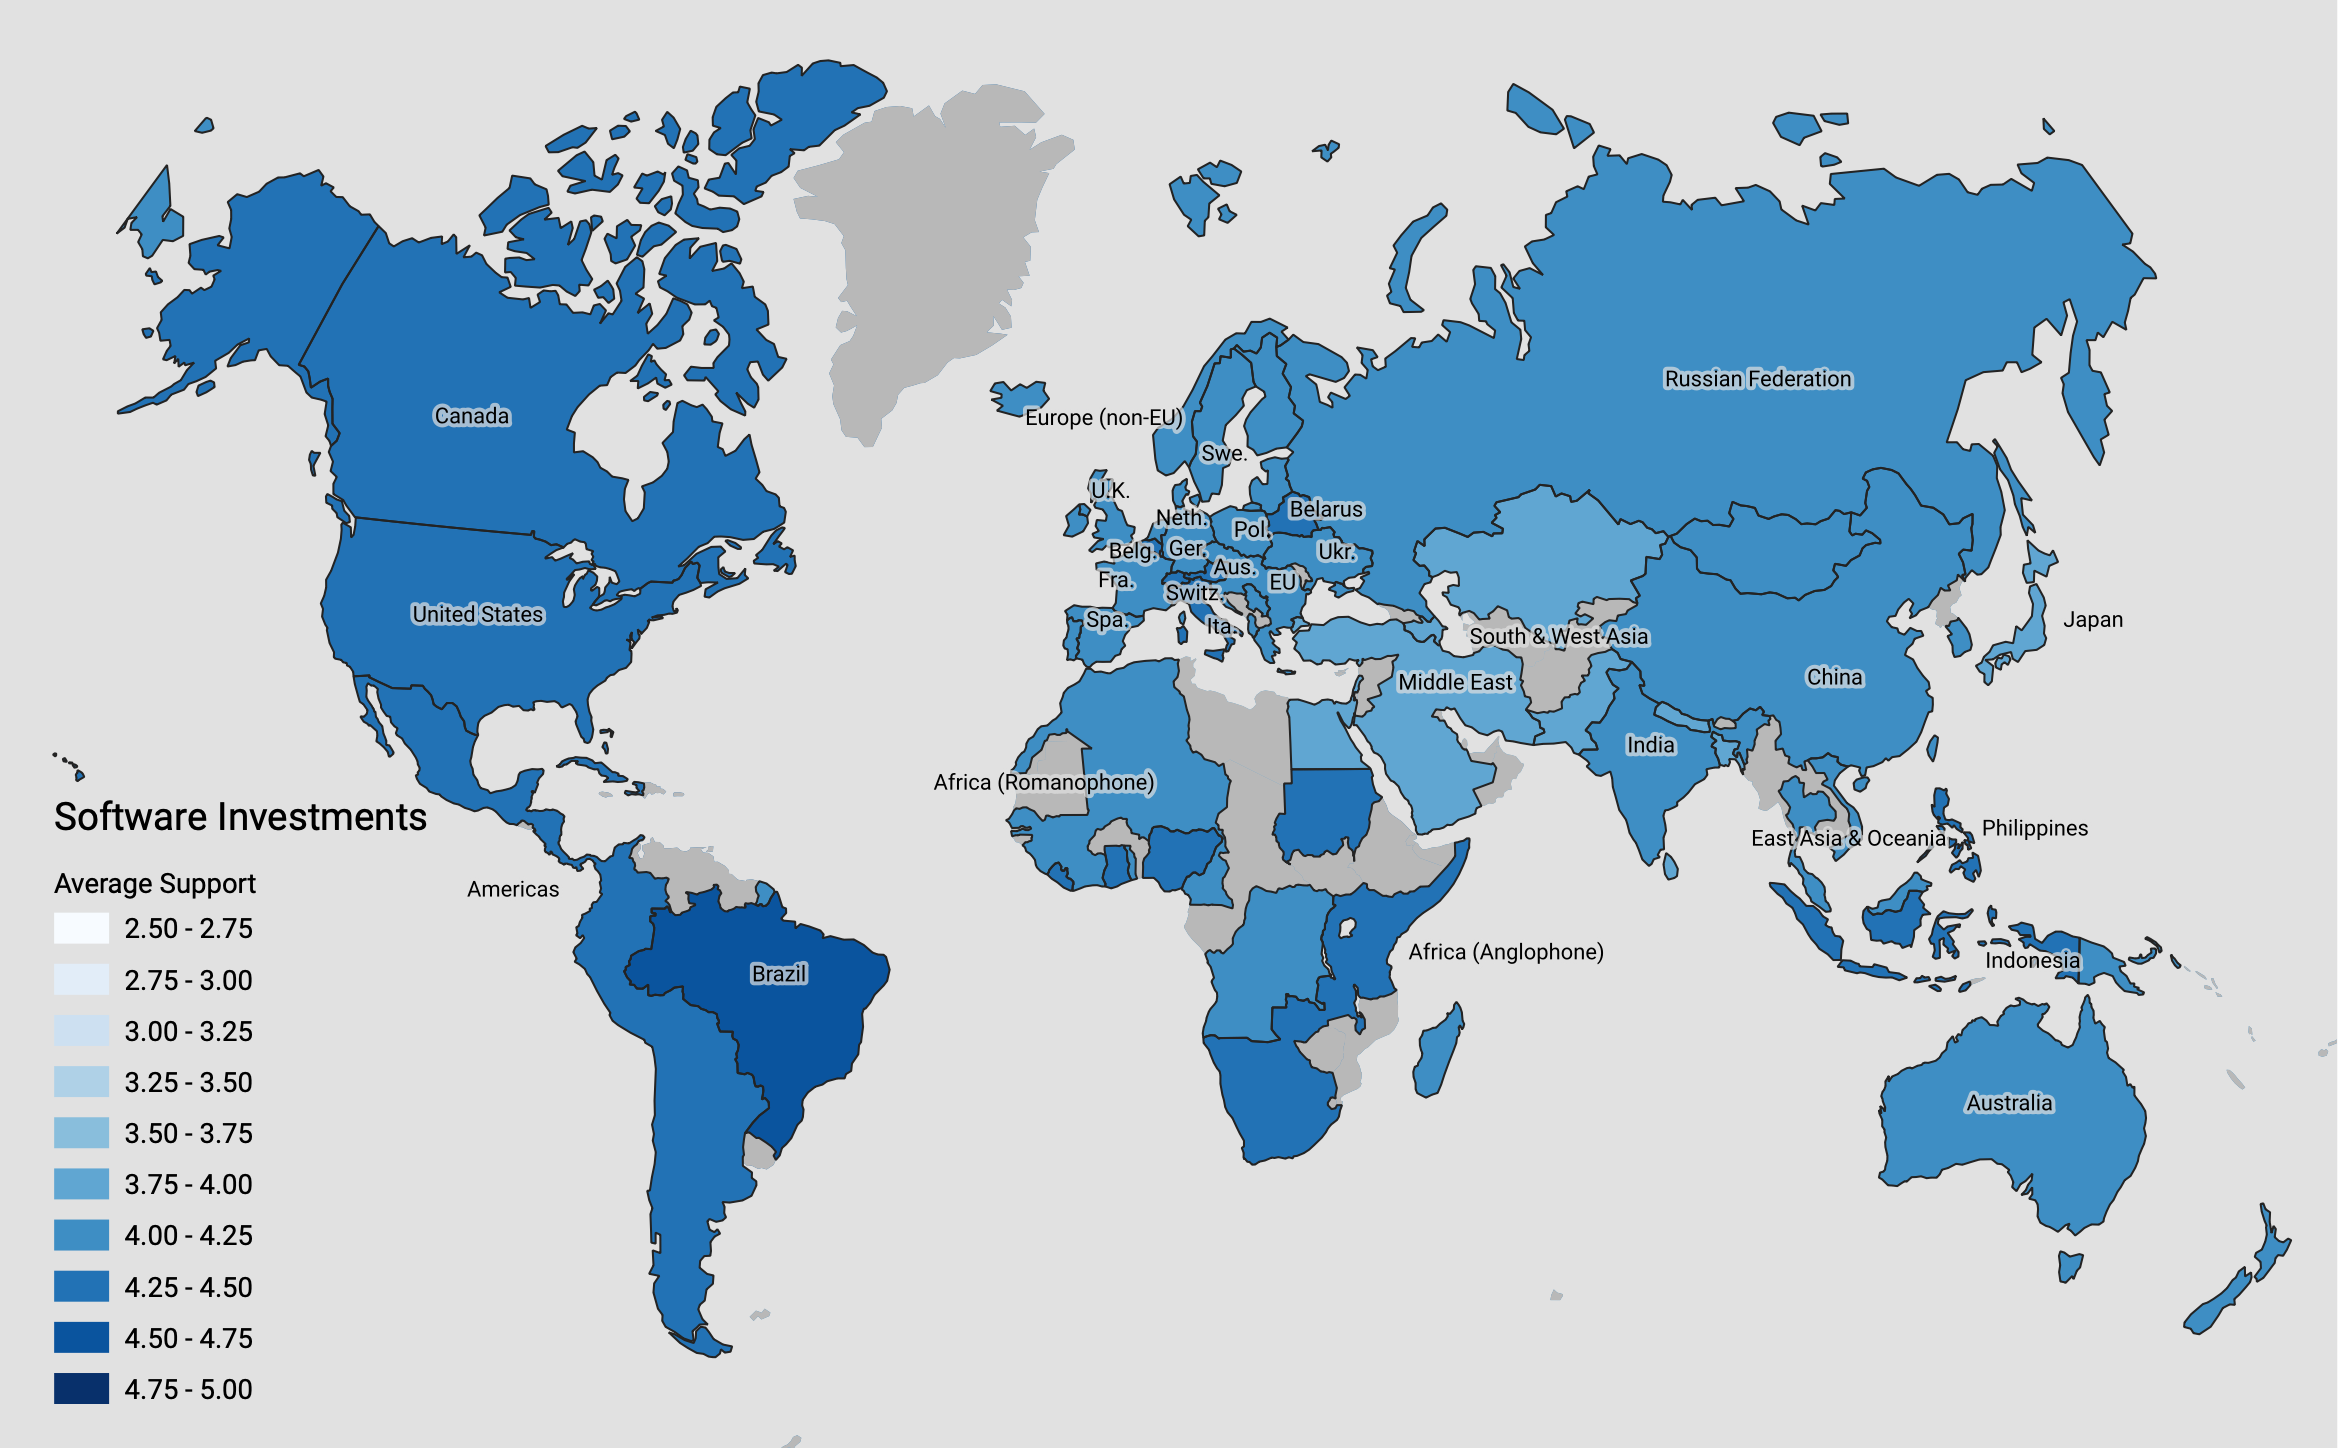
The survey asked for sentiment responses to five questions about board activities. Each question asked for feedback on recent board actions on a scale of 1 to 5, where 1 is strongly disagree, 2 is disagree, 3 is neutral, 4 is agree, and 5 is strongly agree. Sentiment on each of the five questions is neutral-to-positive to varying amounts, with no average negative sentiment recorded in any geographic region.
Action 1: Code Of Conduct
“In 2020 the Board created a Diversity and Inclusion Special Committee, and asked the Local Chapters and Communities Working Group to recommend actions in response to complaints about Systemic Offensive Behavior in the OSM Community.”

Action 2: Fundraising
“In 2020 the Board began raising funds via large donations to cover projected increased costs of maintaining the platform (hardware, software, personnel) in the face of rapidly growing demand for OSM data.”

Action 3: Software Investments
“In 2020 the Board began funding small-scale, one-time, limited-scope, short-term projects to improve existing software products that are considered core to OSM: Nominatim, osm2pgsql, and Potlatch. These products had previously been maintained wholly by volunteers.”
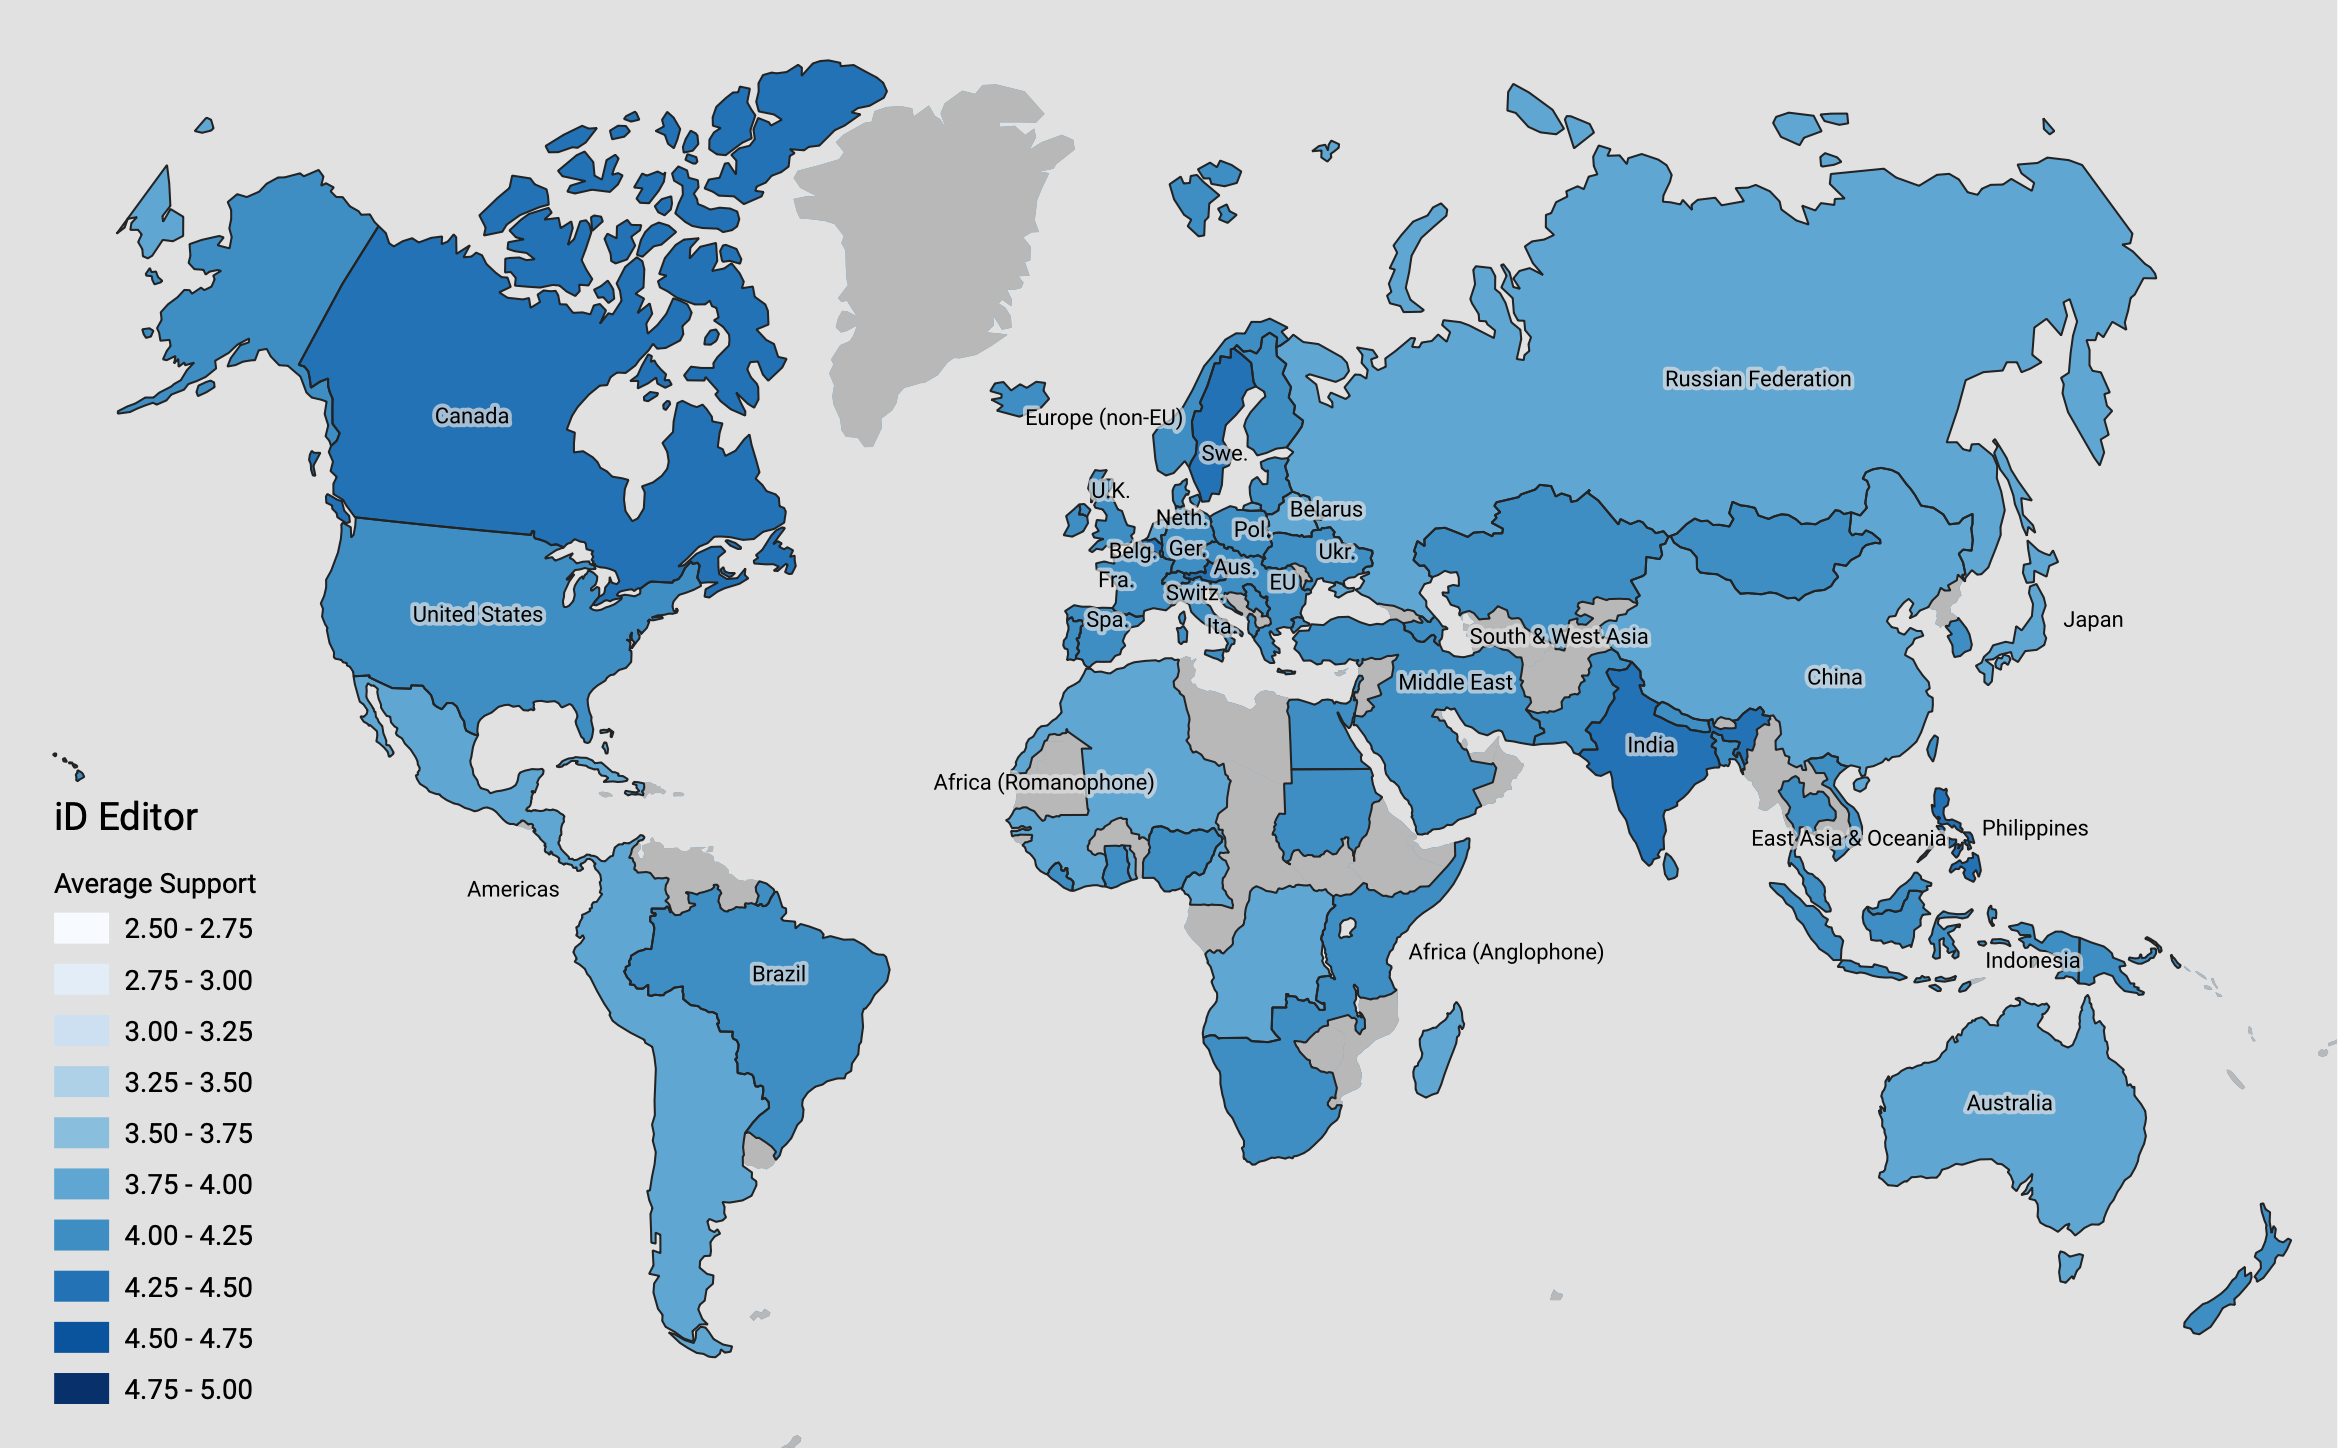
Action 4: iD Editor
“In 2020 the Board voted to take over the cost of a single software developer for maintaining the default iD editor from a private firm that had been funding the position, thereby shifting control of iD maintenance from a third party to the OSM community.”
Action 5: Microgrants
“In 2020 the Board began funding microgrants for one-off projects.”

Survey Respondents
Similar to the Mappers example above, survey respondents were asked whether they identified with a non-exclusive list of identities. After “mappers,” the largest numbers of respondents identified as “data users” and members of “local communities without chapter status.”


Joiners
Many people indicated involvement with formal OSM activities, such as membership in working groups, local chapters, and the OSM Foundation itself.


Organizers
Communication and event organization featured more heavily in the global South and West.


Workers
Some people agreed that they work for OSM-involved organizations, such as corporate sponsors, commercial companies using OSM data, or non-profit organizations using OSM data.


Nerds
Finally, a small number of respondents are software developers, maintainers, and sysadmins.


Next Steps
This post summarizes OSMF 2021 Survey responses providing board feedback on past actions and basic activities. In a followup post, I’ll share maps of ranked choices of future priority order of tasks the Board of Directors has set for itself. If you’d like to dig deeper into the underlying mapping population to put the regional survey results into context, please visit Jennings Anderson’s earlier post with code and data
Source data and files for all the maps above are available in a Github gist, including a GeoJSON file with survey response regions you can use to map official results.
Update
I’ve published a follow-up post with maps of ranked choices of future priority order of tasks.
Discussion
Comment from Øukasz on 8 March 2021 at 15:50
Hi Michal,
Many thanks for this work - this is really interesting and helpful. Thanks to you providing all your working files, I was able to write a follow-up with some adjustments here