
Map Visualisation - Covid Hospitals Visakhapatnam
Posted by marthaleena on 11 November 2020 in English. Last updated on 12 November 2020.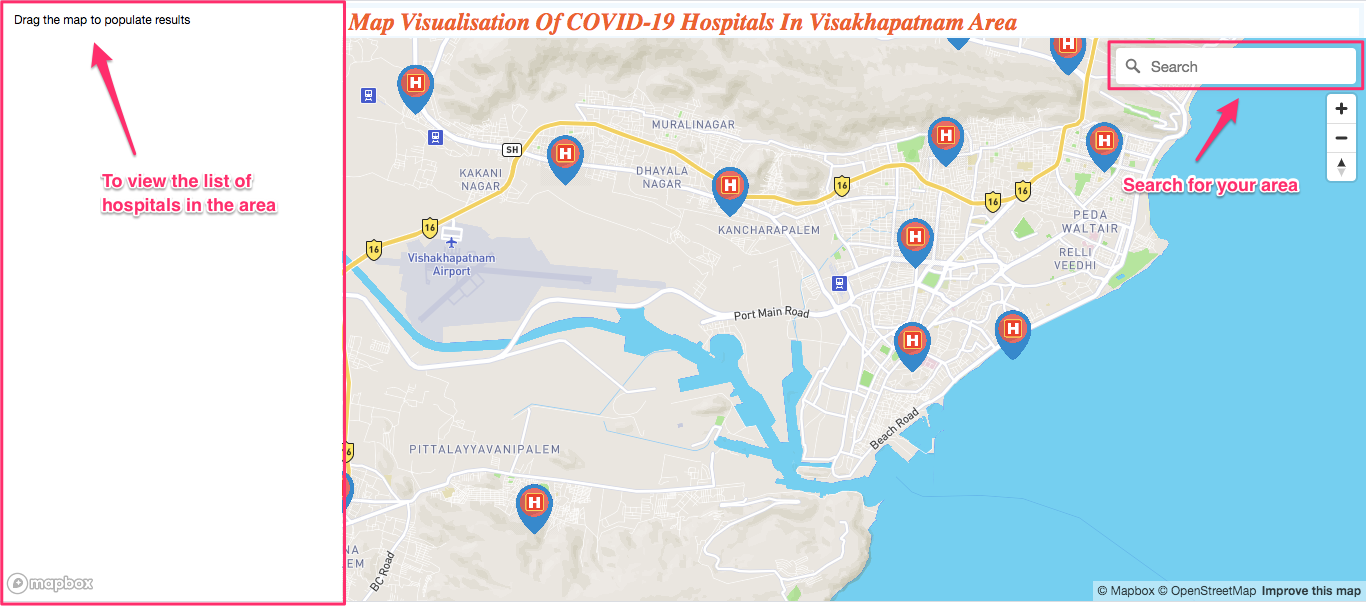
What's this data about?
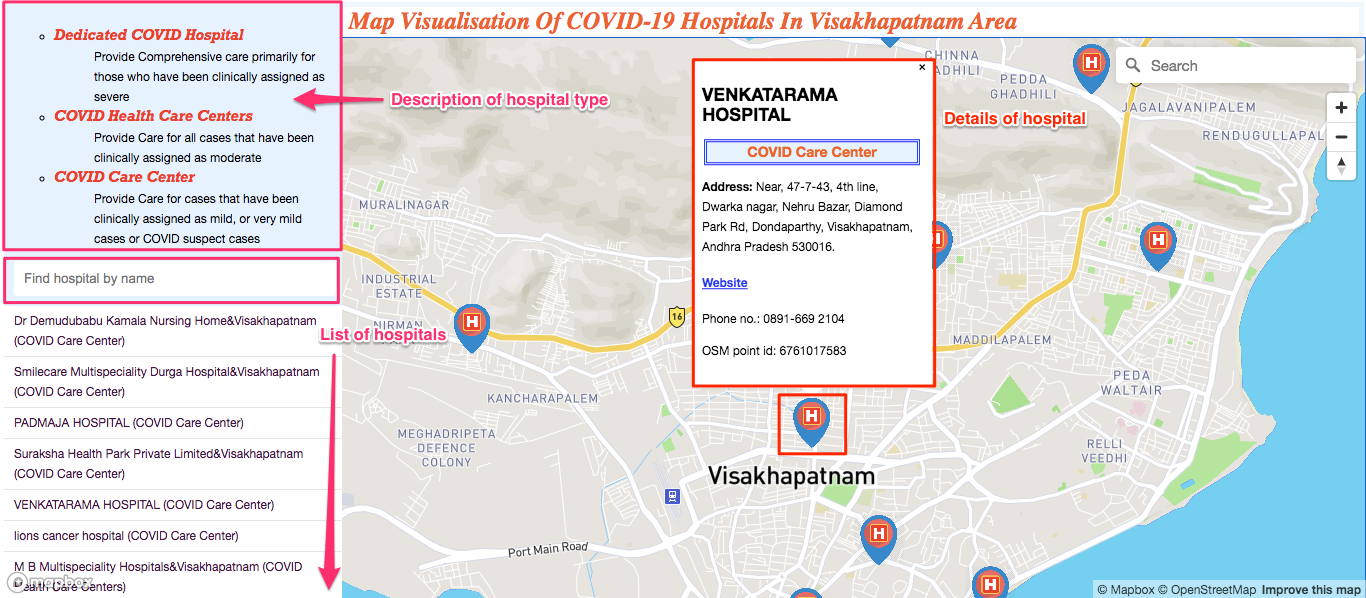
Initially the Department of Health, Medical, & Family Welfare of AP Government has released an active list Covid hospitals in 3 categories based on the services provided. We have considered the hospitals in Visakhapatnam and checked with Existing OSM data. We modified and created hospitals which aren't available on OSM based on local knowledge and official sites.
Who & why did we do this?
As there was enough time with family due the global pandemic (thankfully ended up with family during the difficult times :) ). Being GIS enthusiasts me and my sister started contributing to OSM to improve the data in our locality. We realised that the hospitals in Visakhapatnam have been imported by a non local, though the data seems to be nearly accurate while some needed corrections. Considering the statistics of cases arising in Visakhapatnam we wanted to explore the hospitals coverage and visualise the results. As Mapbox GL JS has been a personal interest and has a huge scope of learning, this opportunity has been utilised to explore its capabilities and improve our skills with collective learning.
What could we do with this data?
Firstly, Data collection of all the matching hospitals of the list with OSM. Added and corrected the locations of multiple hospitals on OSM. Finding a hospital based on a simple area description was indeed a task but indeed my Dad and Uncles helped in figuring out the hospital poi location on Map. Although not every hospital had a official website of its own we did try adding all the accurate information available.
Secondly, Data formatting The OSM point data was converted in a geojson and also compiled with attributes such as Hospital category, address, phone number, website, OSM id etc. A simple overpass helped to export in geojson and compilation of attributed did involve some additional effort from QGIS.
Thirdly, Designing a page :O For a beginner Mapbox GL JS would be a good start. The documentation is very informative and understandable. The examples solved the majority of the key features we've wanted to have in the page.
Key Learnings
- The coverage of map data (POI & Building) needs to be improved in Visakhapatnam
- Lots of scope to learn with Mapbox GL JS.
- Create more interactive featured maps.
Discussion