
This wiki page has a nice collection of stats on editor popularity. The data is up to date, but the graphs aren’t. I’m not a big fan of the logarithmic scale either.
So here’s one graph to tell the main story.
I focused on “the big editors” to keep the graph simple. If you want more detail, just head over to the wiki page.
You can read the graph horizontally, showing first the distribution of changesets, then number of unique contributors, then total edits. On the left, market share. On the right absolute numbers.
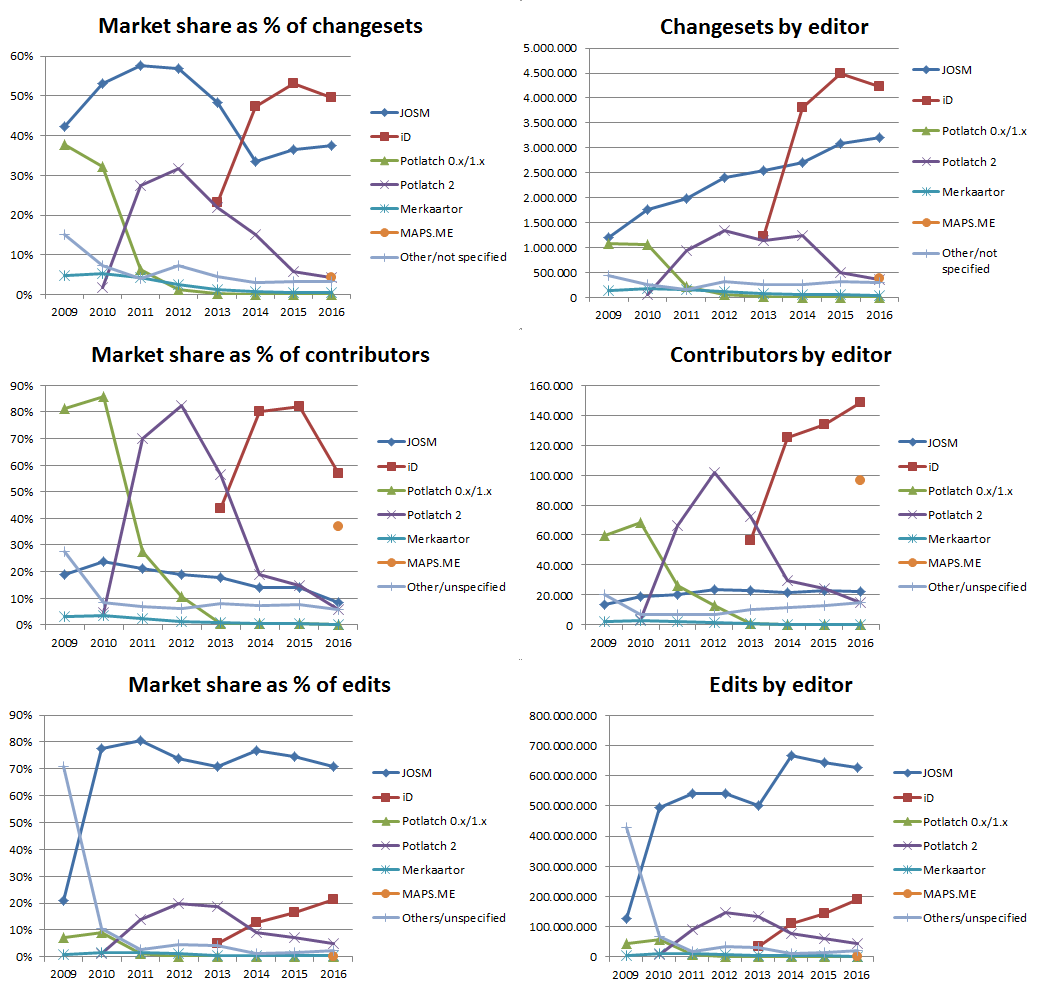
There’s some very clear patterns there. I really like how you can connect the dots for contributors of the “default editor” at the time: first Potlatch, then Potlatch2, then iD. All three of them reached 80% market share at their peak. But iD went down in relative terms because of Maps.me. That could only happen if Maps.me editors don’t use iD much. That’s a good thing, as it show they are new mappers. And it’s a bad thing, as it shows that we haven’t (yet) succeeded in getting them more deeply involved in OSM.
To make some of that more clear, here’s three more charts. Changesets per contributor show that JOSM users are quite productive. There’s also a very clear growth path for JOSM users. Merkaartor has a similar pattern. Maps.me hardly shows, with just 4 changesets per contributor.
Some changesets are bigger than other. JOSM changesets are the biggest. Potlatch2 are somewhere in the middel, and iD changesets are quite small. The average Maps.me changeset has only 2 changes.
So what’s the overall productivity of contributors? Here JOSM is quite extreme.
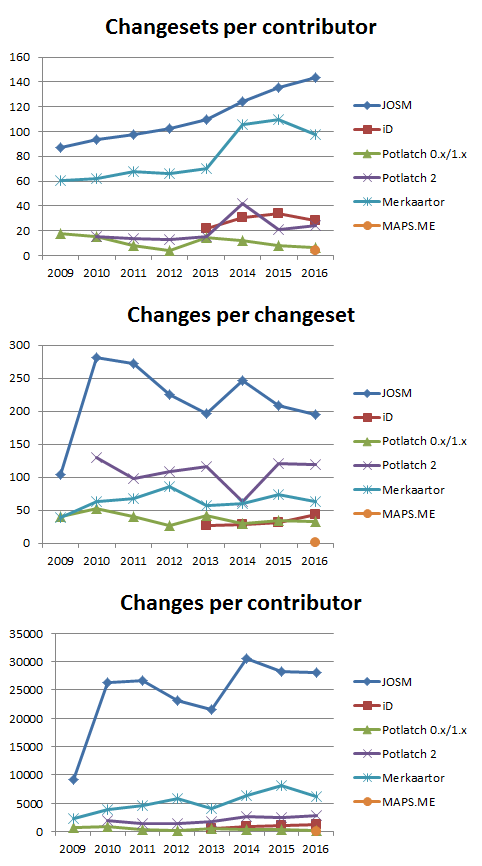
Note that this doesn’t say anything about quality or amount of work. For example a JOSM changeset editing thousands of objects could have been made in minutes. Someone could have surveyed a day to collect ten POIs and map them with iD.
As one of the few remaining Potlatch users, I had to make this graph too:
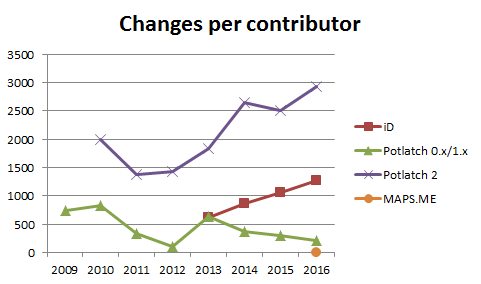
As Potlatch2 lost the status of default editor, the remaining users became ever more productive. That makes sense, because “low engagement” contributors won’t find the way to that editor. So the only relevant numbers are those for 2011 and 2012. And compared to that, the low numbers for iD are striking. Low numbers may mean that more people with less motivation can be pushed to make at least one edit, so you can call that a success. This is the argument to call Maps.me a editing a huge success. But it can also mean that the editor isn’t as inviting to work on more stuff than just on the thing you wanted to do. Anyway, a much deeper analysis would be necessary to draw any conclusions on that. You’d have to take account of previous mapping experience, later shifts to JOSM, and possible differences between 2011 and 2016 newbies, to name just a few controls. Also: the numbers are rising every year, even as it remains the editor for new contributors.
And then there’s the good old Potlatch 1 of course. There’s only one reason to open that ugly duckling: go to a place where you think something was deleted, press U, and you can see and recover it. It is amazing that no other editor has a similar feature that makes this so simple.
You can download the cleaned up data here (dropbox).
Discussion
Comment from imagico on 12 April 2017 at 10:33
I always wonder how these numbers were going to change if you’d exclude imports. Obviously most imports these days are performed through JOSM so it seems likely that the dominance of JOSM in terms of edits as well as the average changeset size of JOSM edits would drop significantly if you’d only look at normal edits. It would be interesting to know by how much though.
With just one data point in 2016 it is not really possible to say much about the effects of Maps.me based on this probably.
Comment from Zverik on 12 April 2017 at 14:29
Amazing but understandable: our API has special Potlatch-only methods just for that.
Comment from SimonPoole on 12 April 2017 at 16:49
Why on earth did you include Merkaator in the graphs?
Comment from Klumbumbus on 20 April 2017 at 20:49
So, do you plan to replace the graphs on https://wiki.openstreetmap.org/wiki/Editor_usage_stats with yours?
Comment from Kevin Kofler on 21 April 2017 at 11:10
Why not? It had over 5% market share in 2010, it has been maintained again for a couple years now, it has been ported to Qt 5, and it is still a great option as you can see from the productivity stats.
For all those who dropped Merkaartor during the time where it was unmaintained and stuck on Qt 4, you may want to give it another chance.
http://merkaartor.be/
Comment from joost schouppe on 21 April 2017 at 13:12
@simon and @ kevin: yep, I started off by sorting them by max market share over all the years. And maybe that .be aspect was part of it too :)
@Klumbumbus: that was the original plan, but then I started writing this thing instead. The images are on the wiki, so feel free to change that page.
Comment from SimonPoole on 22 April 2017 at 20:32
@Kevin well 7 years ago, Merkaator had its peak with 3.5% (not 5%) market share at a point in time when there was very little competition and the numbers in general were very very small (that is why joost sorting by max market share ever doesn’t make a lot of sense), it has continued to decline in -absolute- numbers since then even though it had prominent mentions all over the place in that time,
Comment from HolgerJeromin on 22 April 2017 at 21:25
I am interested in the stats for vespucci.
Comment from SimonPoole on 22 April 2017 at 21:29
@HolgerJeromin not sure why you are not looking at the relevant wiki page which includes stats for all identifiable editors.
Comment from joost schouppe on 23 April 2017 at 13:03
About 5% of changeset share; but yeah, it was kind of haphazard and it doesn’t add much to the graphs.
Comment from SimonPoole on 23 April 2017 at 13:13
changesets is no measure of anything in particular (see numerous other discussions on the topivs), you might as well measure number of key presses per app which actually could be more meaningful.