Showing boundaries as a separate layer on https://map.atownsend.org.uk
Posted by SomeoneElse on 24 November 2018 in English. Last updated on 20 September 2021.When I developed the map style that you can see here from OSM-carto one thing that I didn’t carry forward was the representation of borders. Partly this was because it’s not easy to separate maritime ones from non-maritime ones, the the purple maritime country borders frankly don’t look very nice:
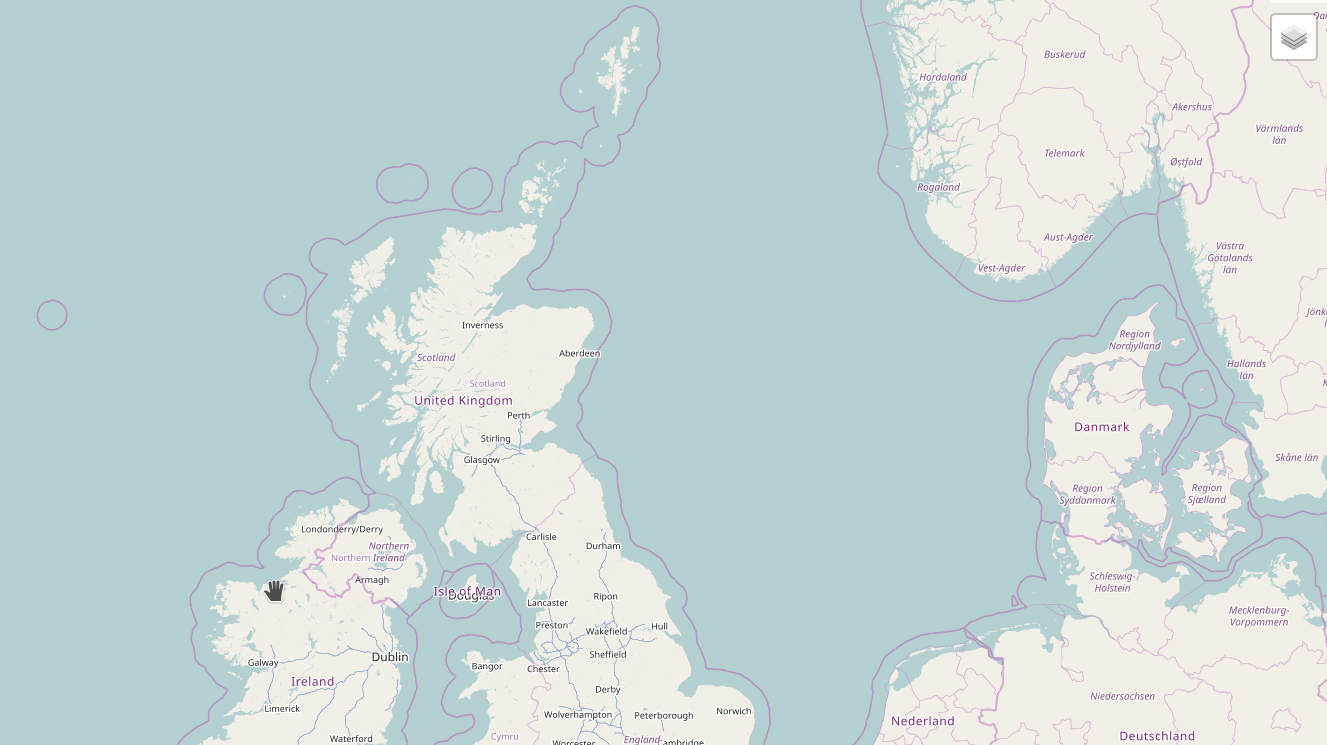
Partly it was also due to “clutter” - I didn’t want an arbitary boundary to get in the way of a river or stream or other feature.
Sometimes however, it would be useful to see what borders are where, so why not do it as an overlay? This turned out to be rather easier than anticipated.
Firstly, a separate database was created (called “gis2”; by default an OSM Carto-based style will use “gis” as a database). That was set up as per the createdb section of the switch2osm guide. The reason for using a separate database was mainly to allow boundaries to be loaded independently of the rest of the data (and for a larger area if desired), but it would also allow different sets of boundaries to be loaded, if that was needed (some countries have legal requirements about how they are displayed on maps, and these may not match on-the-ground reality or the requirements of neighbouring countries).
The next job was to load some data into it. Normally I’d reload data using this script. For boundaries I created a version of that that used osmium, osmconvert and osmfilter to select only boundaries from the data and remove non-boundary tags that might render too.
After processing, the file with just boundaries in it was around 1/30 the size of the original file, so loading the second database with all of Europe’s boundaries wasn’t a problem.
Next the style needed to be changed so that boundaries were displayed over transparent tiles. This was done by changing water-color and land-color in style.mss to “rgba(0,0,0,0)” in each case.
Finally and most importantly, the style needs to read data from “gis2” rather than “gis”, and that’s defined as the “dbname” in project.mml.
The results can be seen here. Select “Controls” and then “Boundaries” from the layer switcher to turn them on and off.
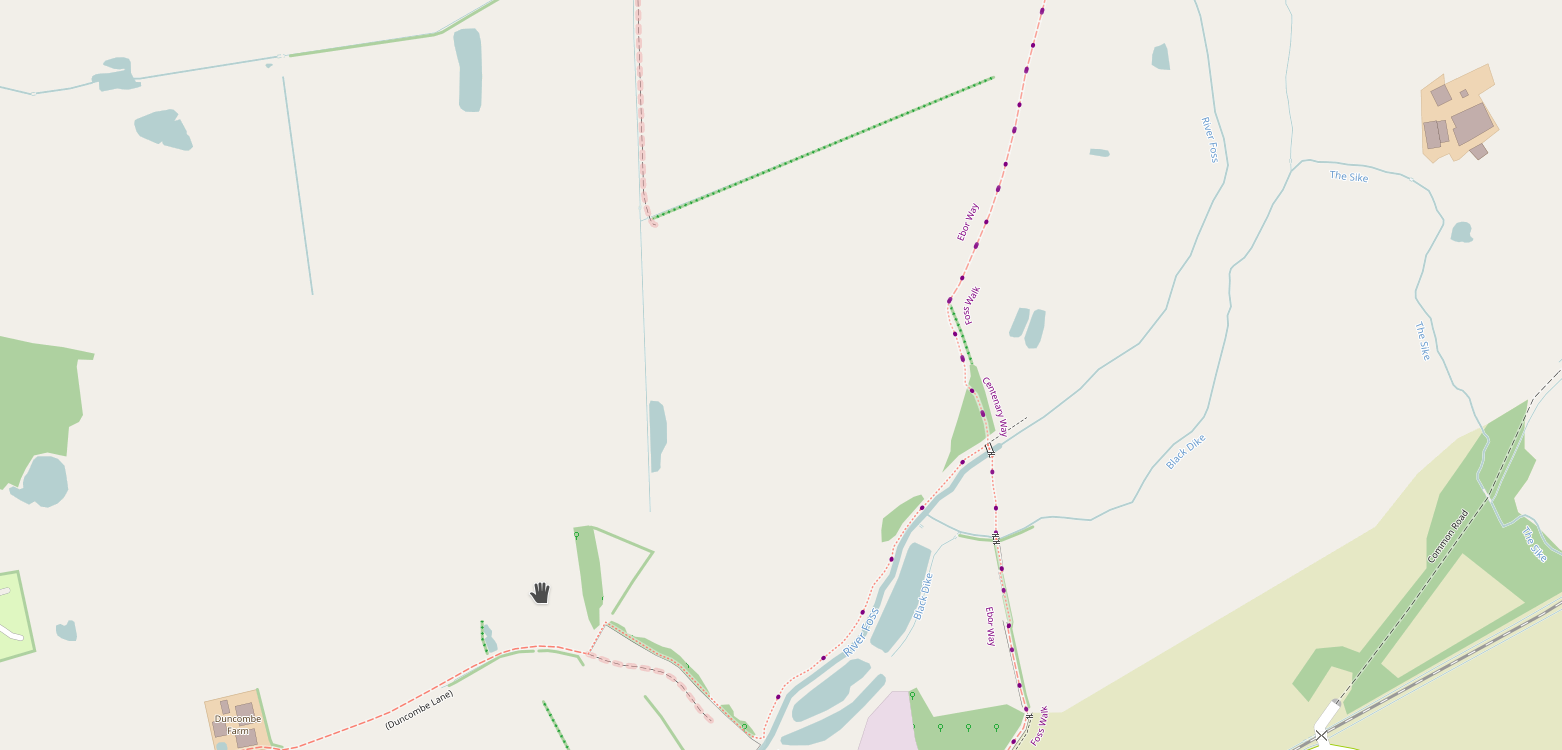
An example of a map without boundaries is:
and with is
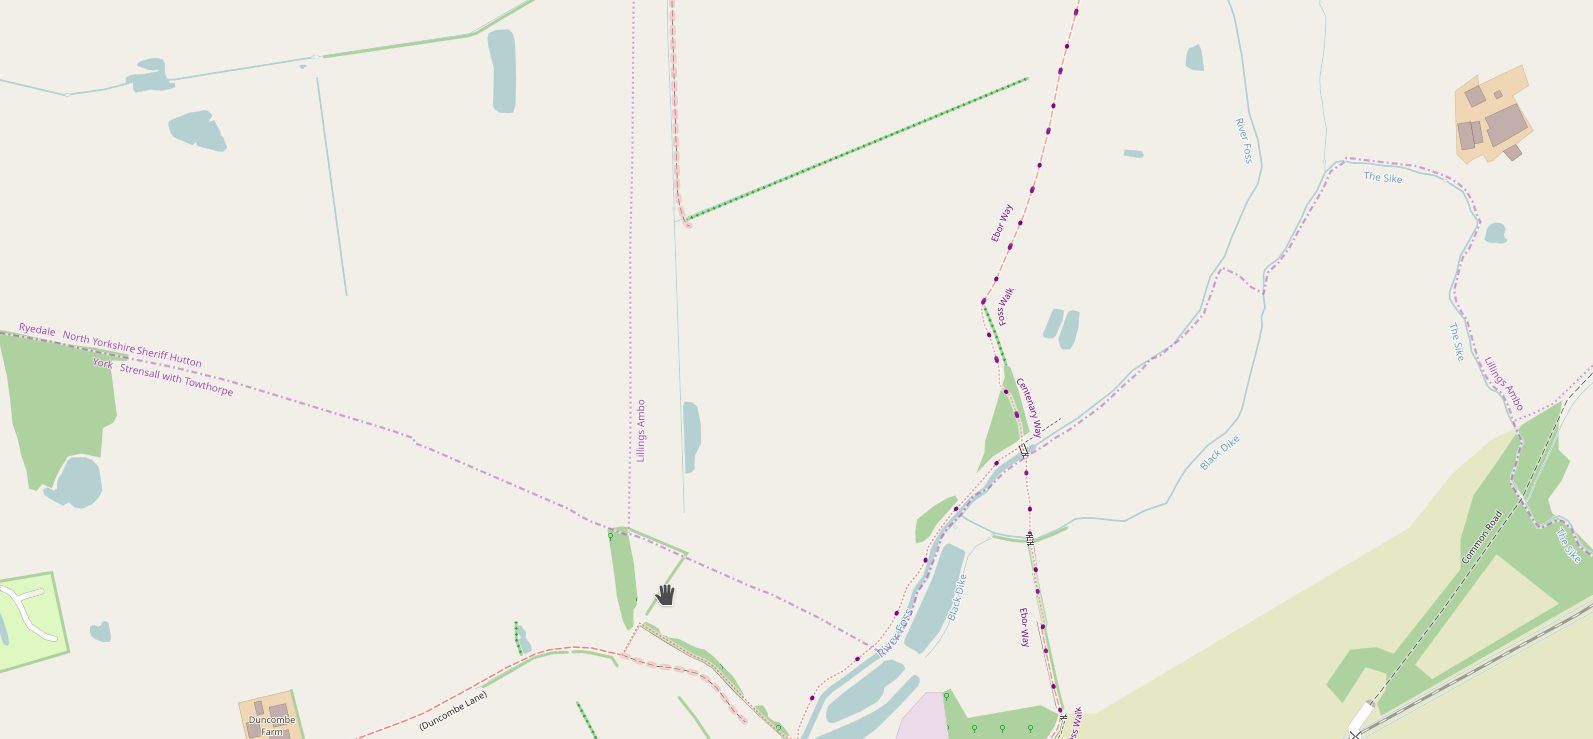
Surprisingly, even though walking routes and boundaries are both labelled in purple, because boundaries are the only purple linear feature, there isn’t any real confusion between the two.
Discussion
Comment from imagico on 24 November 2018 at 14:04
The main problems with that approach are that
For the collisions you could try rendering all labels in both layers and just render the ones you don’t want to actually show in transparent color. I have not actually tried this so i don’t know if that would work.
I am not quite sure about your two step filtering here:
https://github.com/SomeoneElseOSM/Boundary_Scripts/blob/master/update_boundaries.sh#L127-L133
First this seems very inefficient because you can also use negative filtering with osmium. But more importantly why do you specifically drop boundary features with those tags? For my low zoom demo i just use:
osmium tags-filter osm_lowzoom.pbf r/admin_level=2,3,4 -o osm_lowzoom_admin.pbfas source for the boundary data processing.
Comment from SomeoneElse on 24 November 2018 at 14:23
@imagico on the two-stage filtering process, I did that because I didn’t see a way to get osmium to filter tags from objects (which I was surprised about, TBH). The reason why boundary features with those tags are dropped is because I don’t want to have to remove non-boundary rendering from the “other” map style (I did actually try that approach first, but this one was more effective and ultimately easier).
Label collisions are of course a potential issue, but I’ve not actually found one yet!
Comment from imagico on 24 November 2018 at 14:46
Ah, sorry - i misread - you are not filtering features, you are filtering tags, i.e. you modify the data instead of just dropping certain features. This you of course can’t do with
osmium tags-filterMy approach for this kind of thing is to modify the style rather than modifying the data. This should make rendering more efficient since you don’t have all the layers with no data. Filtering specific layers from the mml file is something you can do with
sed(yes, somewhat ugly) or probably more elegantly with python using the YAML parser.Examples for label collisions:
https://map.atownsend.org.uk/maps/map/map.html#zoom=6&lat=51.82&lon=-0.88 https://map.atownsend.org.uk/maps/map/map.html#zoom=16&lat=53.03933&lon=-2.86514 https://map.atownsend.org.uk/maps/map/map.html#zoom=16&lat=53.13563&lon=-2.18444
Comment from SomeoneElse on 24 November 2018 at 16:29
Thanks. The collisions at low zoom I suspect I won’t be able to do anything about. The one on the Dee doesn’t look too bad too my eyes (sorry if that’s heresy!). The one at Nick’i’the hill is a fair cop though - but I don’t think I’d want to supress the place name because of the boundary.
Comment from Warin61 on 24 November 2018 at 22:35
At low zoom you may not need to show the boundary labels.
Unfortunately some boundaries are bound (pun) to resemble paths. Best if ther is some way to differentiate between them.
Comment from Jochen Topf on 3 December 2018 at 12:31
You should be able to leave out the second
osmconvertcall. Osm2pgql uses libosmium to read its input and can read o5m/o5c files. (Osmium can read those files, but not create them.)Comment from yvecai on 18 April 2020 at 14:44
For the record, and as this topic has recently been brought up from the QA, labels with transparent color on the base map works well for Opensnowmap. A few street and city labels are missing of course.