As there has been an Address import in the Brussels region, and the Flemish Agiv also opened a database with address positions (not good enough to import directly, so we agreed to draw the buildings from aerial imagery while adding addresses, that way we at least check consistency of addresses). In Flanders, it’s a slow import that started around the end of 2014.
So I wondered what evolutions were visible lately. If it was possible to see where people were editing. Stuff like that.
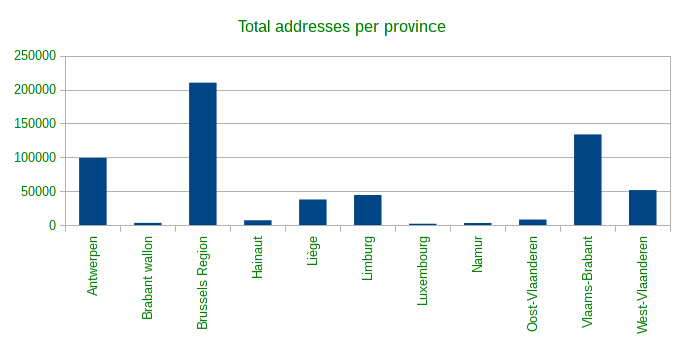
First I investigated the total number of addresses per province. Brussels capital region doesn’t have any provinces, nor does it belong to a province (although it’s completely enclosed by one). But Brussels is included next to the provinces, just to cover Belgium completely.

Here you clearly see that Brussels has many addresses mapped. Most likely due to the import. But between other provinces, there are also major differences. Oost-Vlaanderen and Vlaams-Brabant are both part of Flanders, they have the same resources, but there’s a major difference. The population also doesn’t seem to matter, as Oost-Vlaanderen has almost 1.5 million inhabitants, and Vlaams-Brabant has just 1.1 million.
Then I wanted to compare addresses with their data types, to see if nobody just imported nodes from Agiv without drawing the buildings. Nodes as addresses are not forbidden (f.e. on an entrance), but the clear majority should be on buildings.

Ok, this looks good. Most addresses in Flanders are on buildings. Ratios seem rather constant. There are a few addresses on relations too (normally multipolygons), however, too few to be visible.
After that, the evolution of addresses through time is also interesting.

Here you clearly see the import of Brussels. Skyrocketing all provinces. But address mapping in some other provinces is also gaining traction lately, however small.
Overall, I’m very surprised by the differences between the provinces, even if you ignore Brussels. And I hope address mapping in other provinces will gain some more traction.
As a final treat, I give you some graphs per province.