Back in March I was amused to see Amanda tweet that the UK OpenStreetMap community ran a solar power mapping project “several years ago”. This was the theme of the [quarterly project(osm.wiki/UK_2019_Q3_Project:_Solar_Power) in Q3 2019, but the project keeps trucking on.
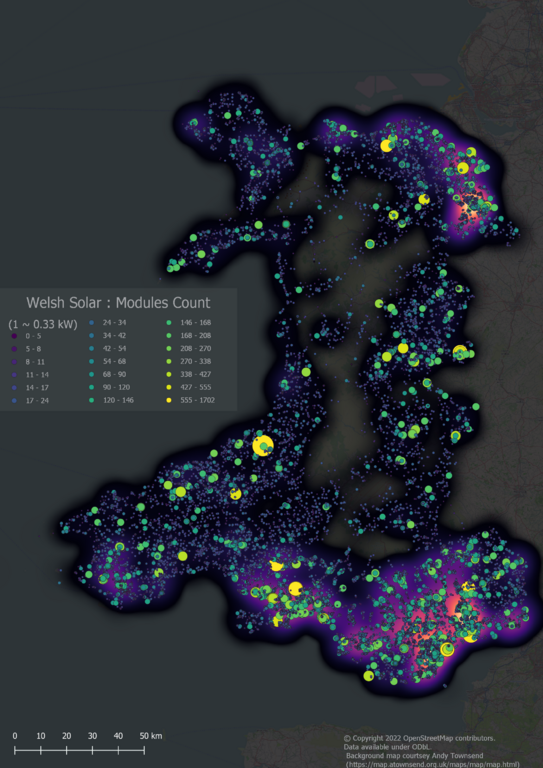
All small-scale Solar Power in Wales (i.e., excluding solar farms of more than 1MW capacity)
In the past few days we reached a milestone of having comprehensive solar cover for Wales, one of the constituent countries of the United Kingdom. I think this is the first country to have solar power mapped at such a fine level of detail either on OSM or anywhere else.
The rest of this post discusses aspects of the how & why of this work.
Solar Mapping in the UK
Active mapping of solar farms had been proceeding for a while prior to 2019, but it was Jack Kelly of OpenClimateFix who posed the question about mapping rooftop solar photovoltaics. His problem is nowcasting changes to power generation from solar which could reduce the need for some carbon-based standby power. When clouds pass over, solar generation can drop, leading to transient changes at a local level. Rooftop solar is a not insignificant part of the mix & both highly dispersed and clustered (at all levels: groups of houses, streets, estates, local authorities and even countries).
Current Status
Solar farms were pretty much all mapped by the time Dan Stowell talked about the project at SotM-19. Ongoing mapping is mainly about rooftop solar, with a much smaller number of ground installations, ranging from 4kW to 300kW.
We reached 40% coverage for Great Britain at the end of 2021, 400,000 individual solar panels in January this year, and currently there are 449k panels, 396k installations (an installation can have more than one panel) representing 46% of the total government figures (or 39.6% if we use a higher estimate of 1 million installations). Mapping in Northern Ireland has been more limited, but VictorIE has made decent inroads recently.
Over the 3 years since we seriously started mapping rooftop solar we’ve benefited significantly, in terms of visual feedback from Gregory Williams website and Russ Garrett’s OpenInfraMap. It has also been a good activity during the pandemic when regular mapping has been curtailed. For some of us this is still the case. Aerial imagery has also improved significantly, with installations going form black blobs to ones with clearly delineated individual modules. We can also use property boundary open data to align imagery more precisely.
At the outset we tried many different areas, but ended up focusing on a relatively small number with good aerial imagery & readily observed solar. Even then it was only possible to exceed 50% coverage in a few areas. Particularly noticeable was that visual search in rural areas was pretty hit-and-miss. I personally gave up on Anglesey, having only found 20% of the installed base and most of that in one estate in Llangefni.
Eventually, after a bit of trial and error with various open data sources, I found that clustering buildings from Ordnance Survey Local gave a small enough set of areas to search. A geojson of centroids can be used either in the Josm “To Do” plugin, or the Potlatch 3 task option. Using a Lower Super Output Area (LSOA) as a unit of work proved convenient as most can be searched in under 30 minutes, and as this is the lowest reporting unit of Gregory’s map, feedback is available in 24 hours. I first applied this in parts of Devon, but had long wanted to try it in Powys (the most rural area of England & Wales).
Overall Goals
Our initial goals in mapping solar were therefore:
- Investigate the practicability of mapping with OSM. Initial results were encouraging as the current status confirms.
- Map enough solar to allow investigation of nowcasting and other predictive approaches. This required large numbers of installations to be mapped, unlike many other OSM use-cases where usefulness either does not have a threshold, or the threshold is much lower.
- Document preferred building types used for rooftop solar. This is possible, but probably requires a better attributed & more consistent set of building data than currently available in OSM.
- Enable the creation of a solar cadastre, as was carried out with the OpenSolarMap project of Etalab in France.
- Document a significant change in the appearance of both urban & rural landscapes.
- Provide enough data in specific areas for research & case studies around domestic solar power. A comprehensive data set for Wales represents a big milestone in this regard.
- Provide good training data for automated recognition of roof-top solar from aerial imagery.
- Automated recognition of solar from aerial imagery. Although Tyler Busby did some initial work on this back in 2019, this is probably the one goal where I feel we have not made as much progress as I had hoped.
The current Project : mapping solar in Wales
Last December proved to be a convenient time to return to mapping in Powys. I spent that month adding solar, and a few other things, to Powys. This proved to be productive and met my initial goal both with respect to comprehensiveness (see below regarding comprehensiveness) and level of detail (q.v.)
Having got around 85% completion of Powys, my thoughts turned to the other rural areas of North Wales, Gwynedd and Anglesey. I started on these two in the New Year, and before I knew it realised I’d embarked on covering the whole of Wales. Originally, I anticipated this would be a six-month project. However, a few things derailed that timescale:
- City Nature Challenge 2022: without Muki Hakaly’s prompting I might have missed this after participating for the previous two years. This in turn led me to spend a lot more time recording nature on iNaturalist & other platforms.
- Degraded imagery. Bing imagery started being replaced whilst I was mapping Cardiff in April. The new imagery is much less well orthorectified than the old and is considerable more oblique. This made the process of mapping & tagging panels rather more tedious, and meant that many more installations needed close attention.
- Well-mapped areas needed more time. The councils which were already at 60% (basically along the N. Wales coast and Wrexham) took rather longer to work though than I anticipated. Similarly earlier work by brianboru, Gregory Williams, ZenPhil, and myself often required not just adding module counts & direction, but repositioning.
However, I did reach my target about a week ago, just dipping into August, making 8 months altogether.
Apart from being a country in it’s own right, Wales also encompasses a very broad range of urban and rural areas from dense cities and post-industrial towns to sparsely populated valleys with a few scattered farms in upland areas. It’s therefore a decent microcosm for mapping solar elsewhere in Europe.
Next Steps
Of course there is still a lot to do with the Welsh data. Some basic tidying up will be the necessary over the next couple of months;
- Convert any remaining larger solar mapped as nodes to areas.
- Ensure all larger rooftop solar has a building underneath it.
- Review some LSOAs where less than 70% of solar has been captured. Often imagery has been updated.
- Split or add buildings where the algorithm used by Gregory to calculate installations either under or over counts installations. (I have had to do a lot of work with the Terracer plugin in Wrexham for this reason).
Other people are mapping buildings, for instance around Merthyr & Rhondda Cynon Taf, so gradually this mapping will also improve solar by improving the level of detail, but ultimately remaining buildings will need to be added, so this may be the next major project.
Further afield, the use of clustering of buildings can be used anywhere that OSM has a decent number of buildings: the OSM-IE buildings project & OSM-FR mapping from cadastre both offer opportunities to improve solar mapping now.
Appendix: Some Terminology
Comprehensive vs. complete
I use the term comprehensive rather than complete. We can rarely claim any subset of OSM data is complete, but it is not unusual for the data to reach a level where it is quasi-complete (i.e., perhaps missing a small number of features, and requiring some updating). Limitations to achieving true completeness are : continual change; use of aerial imagery which is a few months to a few years old; difficulty of interpretation of imagery; ordinary omissions & commissions which occur in mapping (fortunately much less than 1% in this case). Good examples are the highway network, where typically we miss new residential developments and may not update changes in one-way systems., or mapping shops where change is continual.
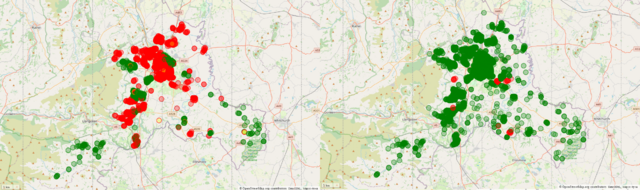
Wrexham : a comparison of how relative complete mapping (80%) compares with comprehensive mapping (at 96%). Note greater dispersion of elements showing a more successful search approach.
My initial target for comprehensive mapping of solar was to achieve at least 80% of the known installed capacity, but with one or two exceptions well over 90% has been reached. Continued mapping & roll-out of new imagery, and even a bit of on-the-ground surveying can then incrementally increase this (as can be seen in places like Watford & Canterbury).
Level of Detail for rooftop solar
In terms of Level of Detail (LOD), there are perhaps 5 stages of mapping rooftop solar:
- A node tagged with location, locational accuracy perhaps 10 m root-mean-square (rms). (This proved the most practical LOD for all our initial mapping. Vagaries of aerial imagery quality, alignment & recency made it too hard to do extra detail, plus the optimum zoom for finding solar does not resolve detail
- A node with additional tags for direction & module count ( a proxy for power rating), but also more accurately located (5 m rms). An area without these detailed tags is equivalent
- A level 2 node with an underlying building, ideally topologically accurate, but certainly slightly more accurate location (rms 2.5 - 3 m). A specific issue is that in some places building locational accuracy itself is in the order of 3-4 m rms ( buildings had been mapped before the cadastral data was available to improve alignment)
- As for level 3, but converted to an area, building alignment refined.
- As for level 4, but the underlying building is mapped with S3DB.
My goal for Wales in the current project was to have everything mapped to stage 2, and all ground and larger rooftop installations (more than 30-40 modules) at stage 4. This will still leave many thousands of buildings to map to further improve the level of detail for ongoing work.
Discussion
Comment from CjMalone on 14 August 2022 at 10:44
Wow is the only response I can think of, and that doesn’t come close to cutting it. You’ve done great work. This both puts my “efforts” to shame, and gives me motivation to do more.
Can you give some more details on this?
Also do you know if we can filter overpass by Lower Super Output Area? When I map solar panels I like to have a layer in JOSM that only contains
power=generator, I usually do this by an approx bbox or a larger area by name. Being able to use LSOA in a query would be great.Comment from SK53 on 14 August 2022 at 11:48
@CJMalone: thanks for this.
I’ll write up the clustering as a separate item as I think it applies to any feature one is searching for in rural areas (things I noted : covered reservoirs, water towers, some missing communication masts, yurts, massive poultry houses). I have tested the idea with places with reasonable imagery & fairly complete building data on OSM: Poland, Switzerland and France. I do it all in QGIS or PostGIS, so currently I don’t know of a way it can be done with a command line.
As LSOAs are fairly arbitrary units, and change from census to census (I think the ones for the 2021 census will be different from the current 2011), they’re not really appropriate for OSM. I suspect we’d need a UK specific instance of Overpass to incorporate them & there would be some issues in inventing osm identifiers for them. The best I can think of is creating an area from a set of co-ordinates, which ought to straightforward if doing it from a command line, rather more fiddly for Overpass-turbo. In practice I run an overpass query & pull it into a QGIS file with the Welsh LSOAs where one can do things like Point-in-Polygon queries. Outside of towns community or civil parish boundaries might be just as suitable for many purposes too.
Comment from CjMalone on 17 August 2022 at 14:51
I’m pretty sure Overpass gets boundaries from multiple places, not just OSM. If so, I think adding them there would be better than OSM. But I’m not sure, I could be making it up.