Online mapping party on building coverage in Penza, Russia
Posted by Kachkaev on 12 April 2021 in English. Last updated on 22 April 2021.ℹ️ This diary entry is a copy of my twitter thread
👀 Russian translation by Google + localised visualizations
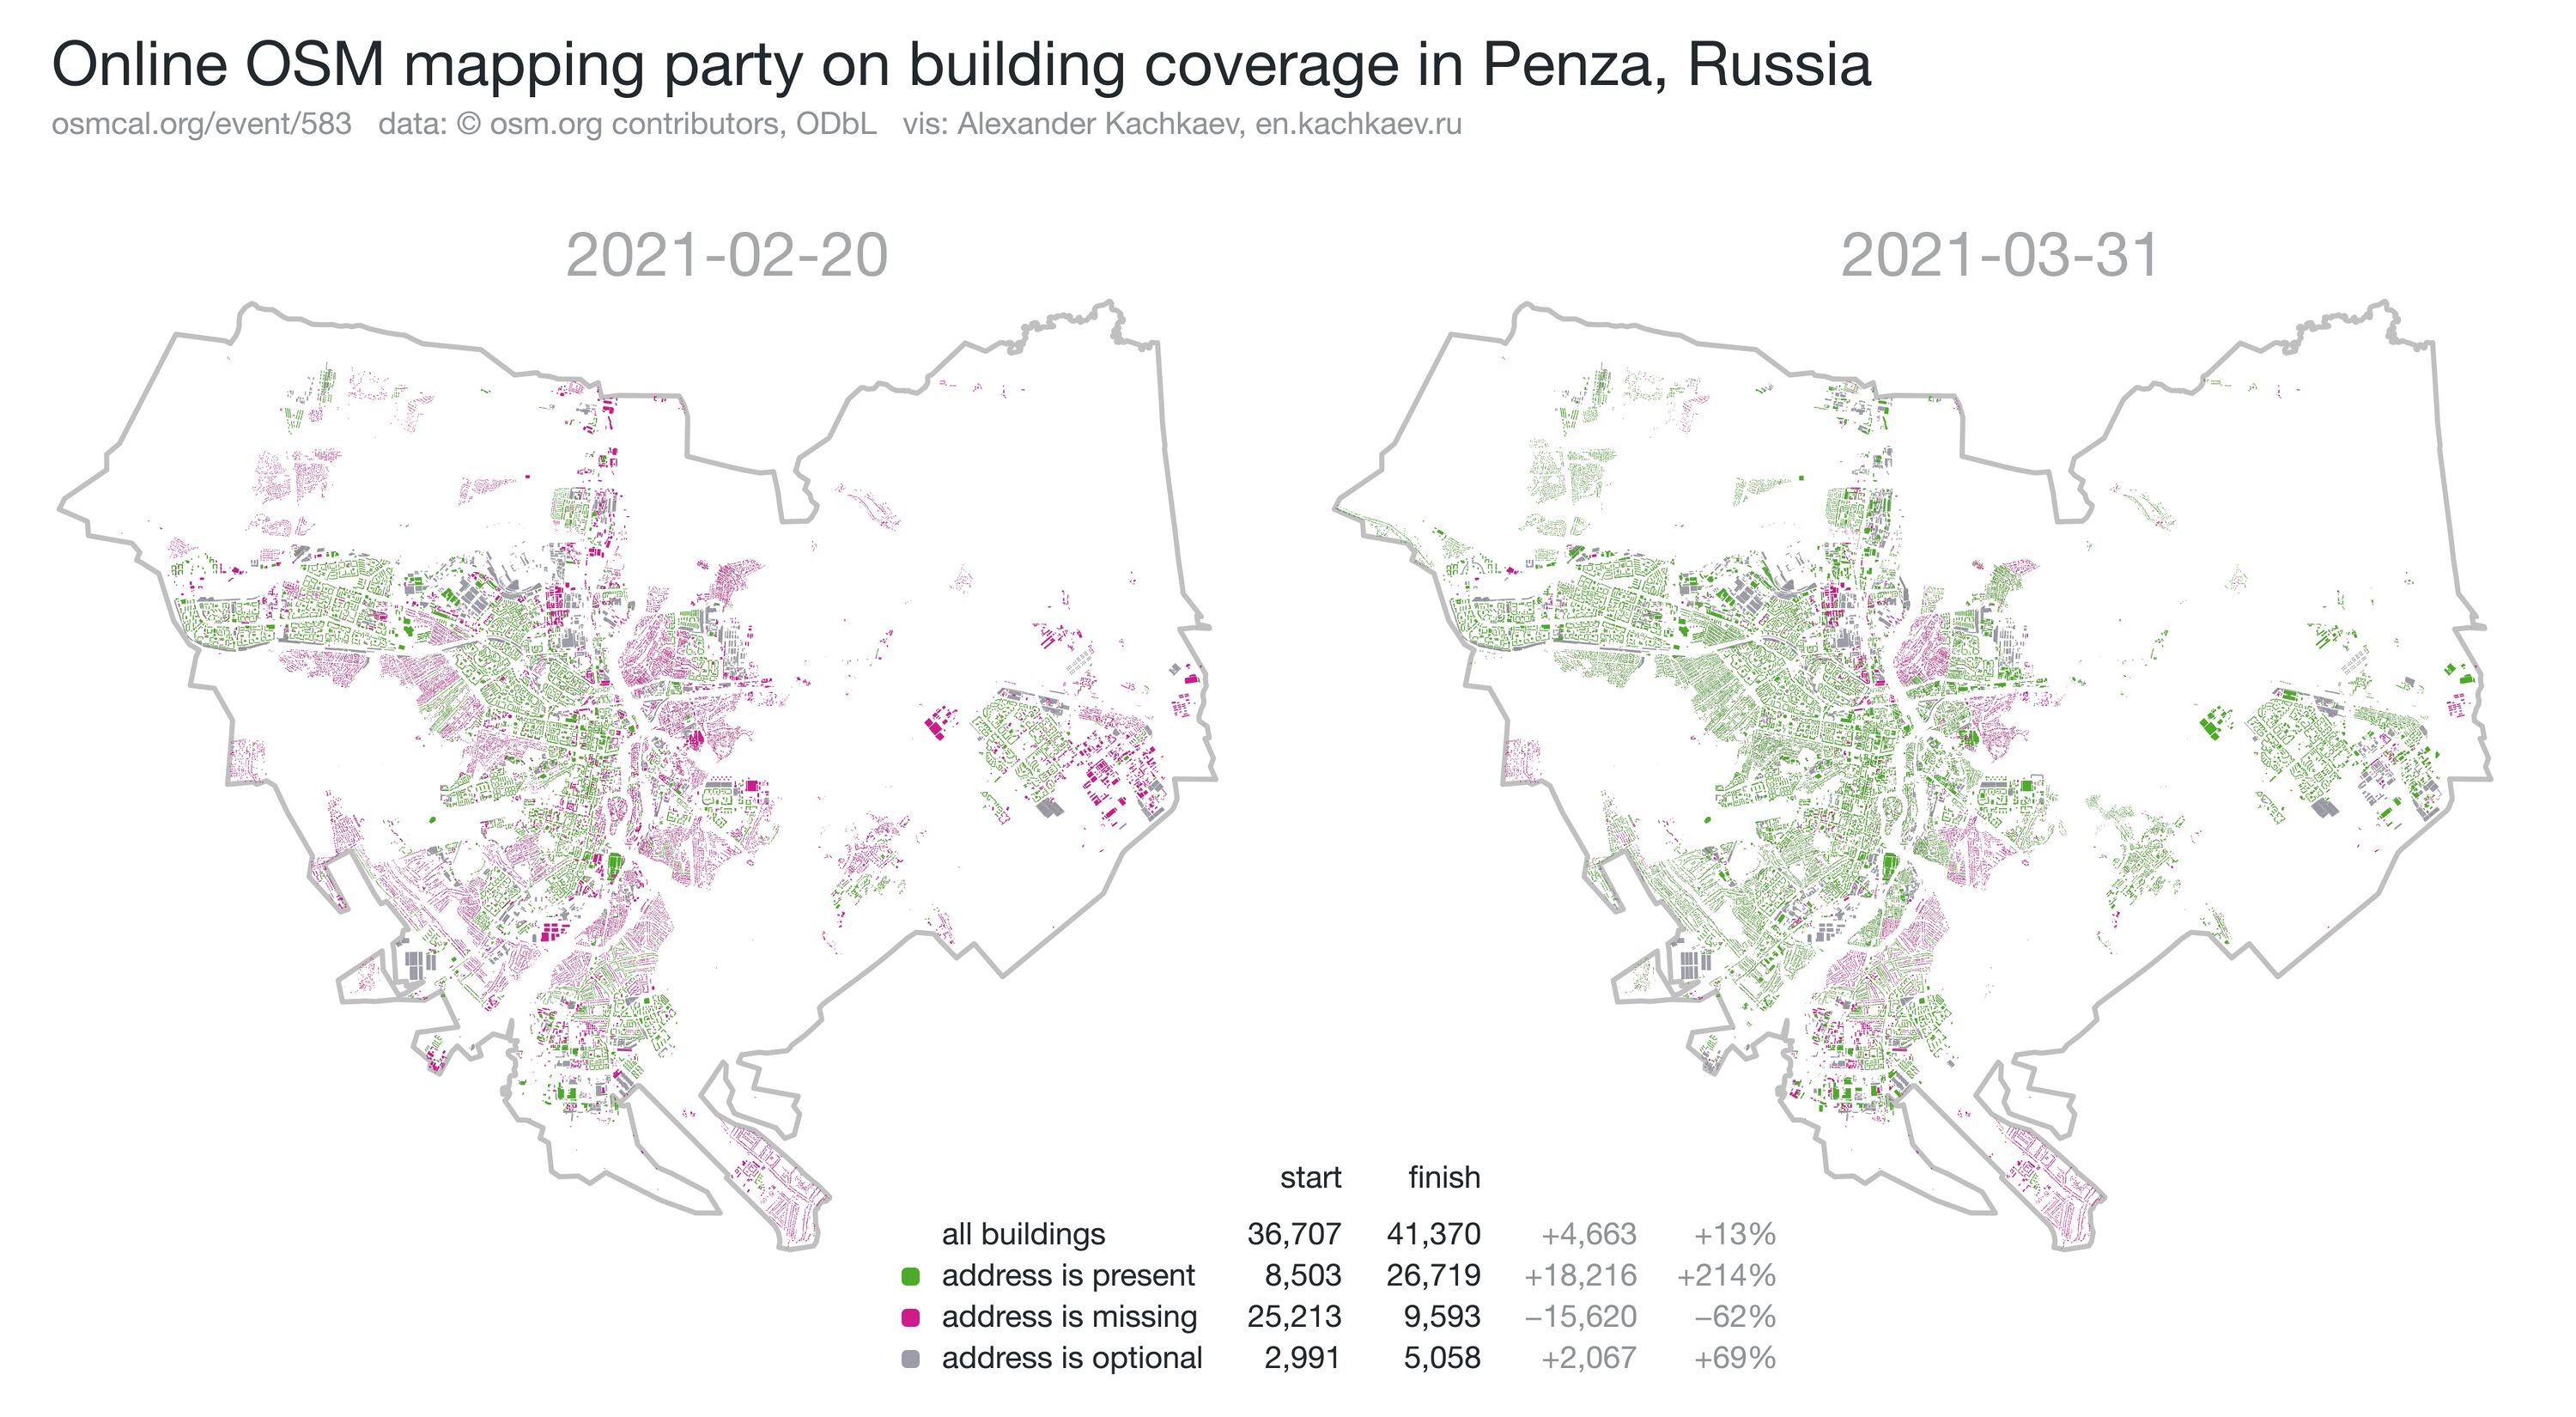
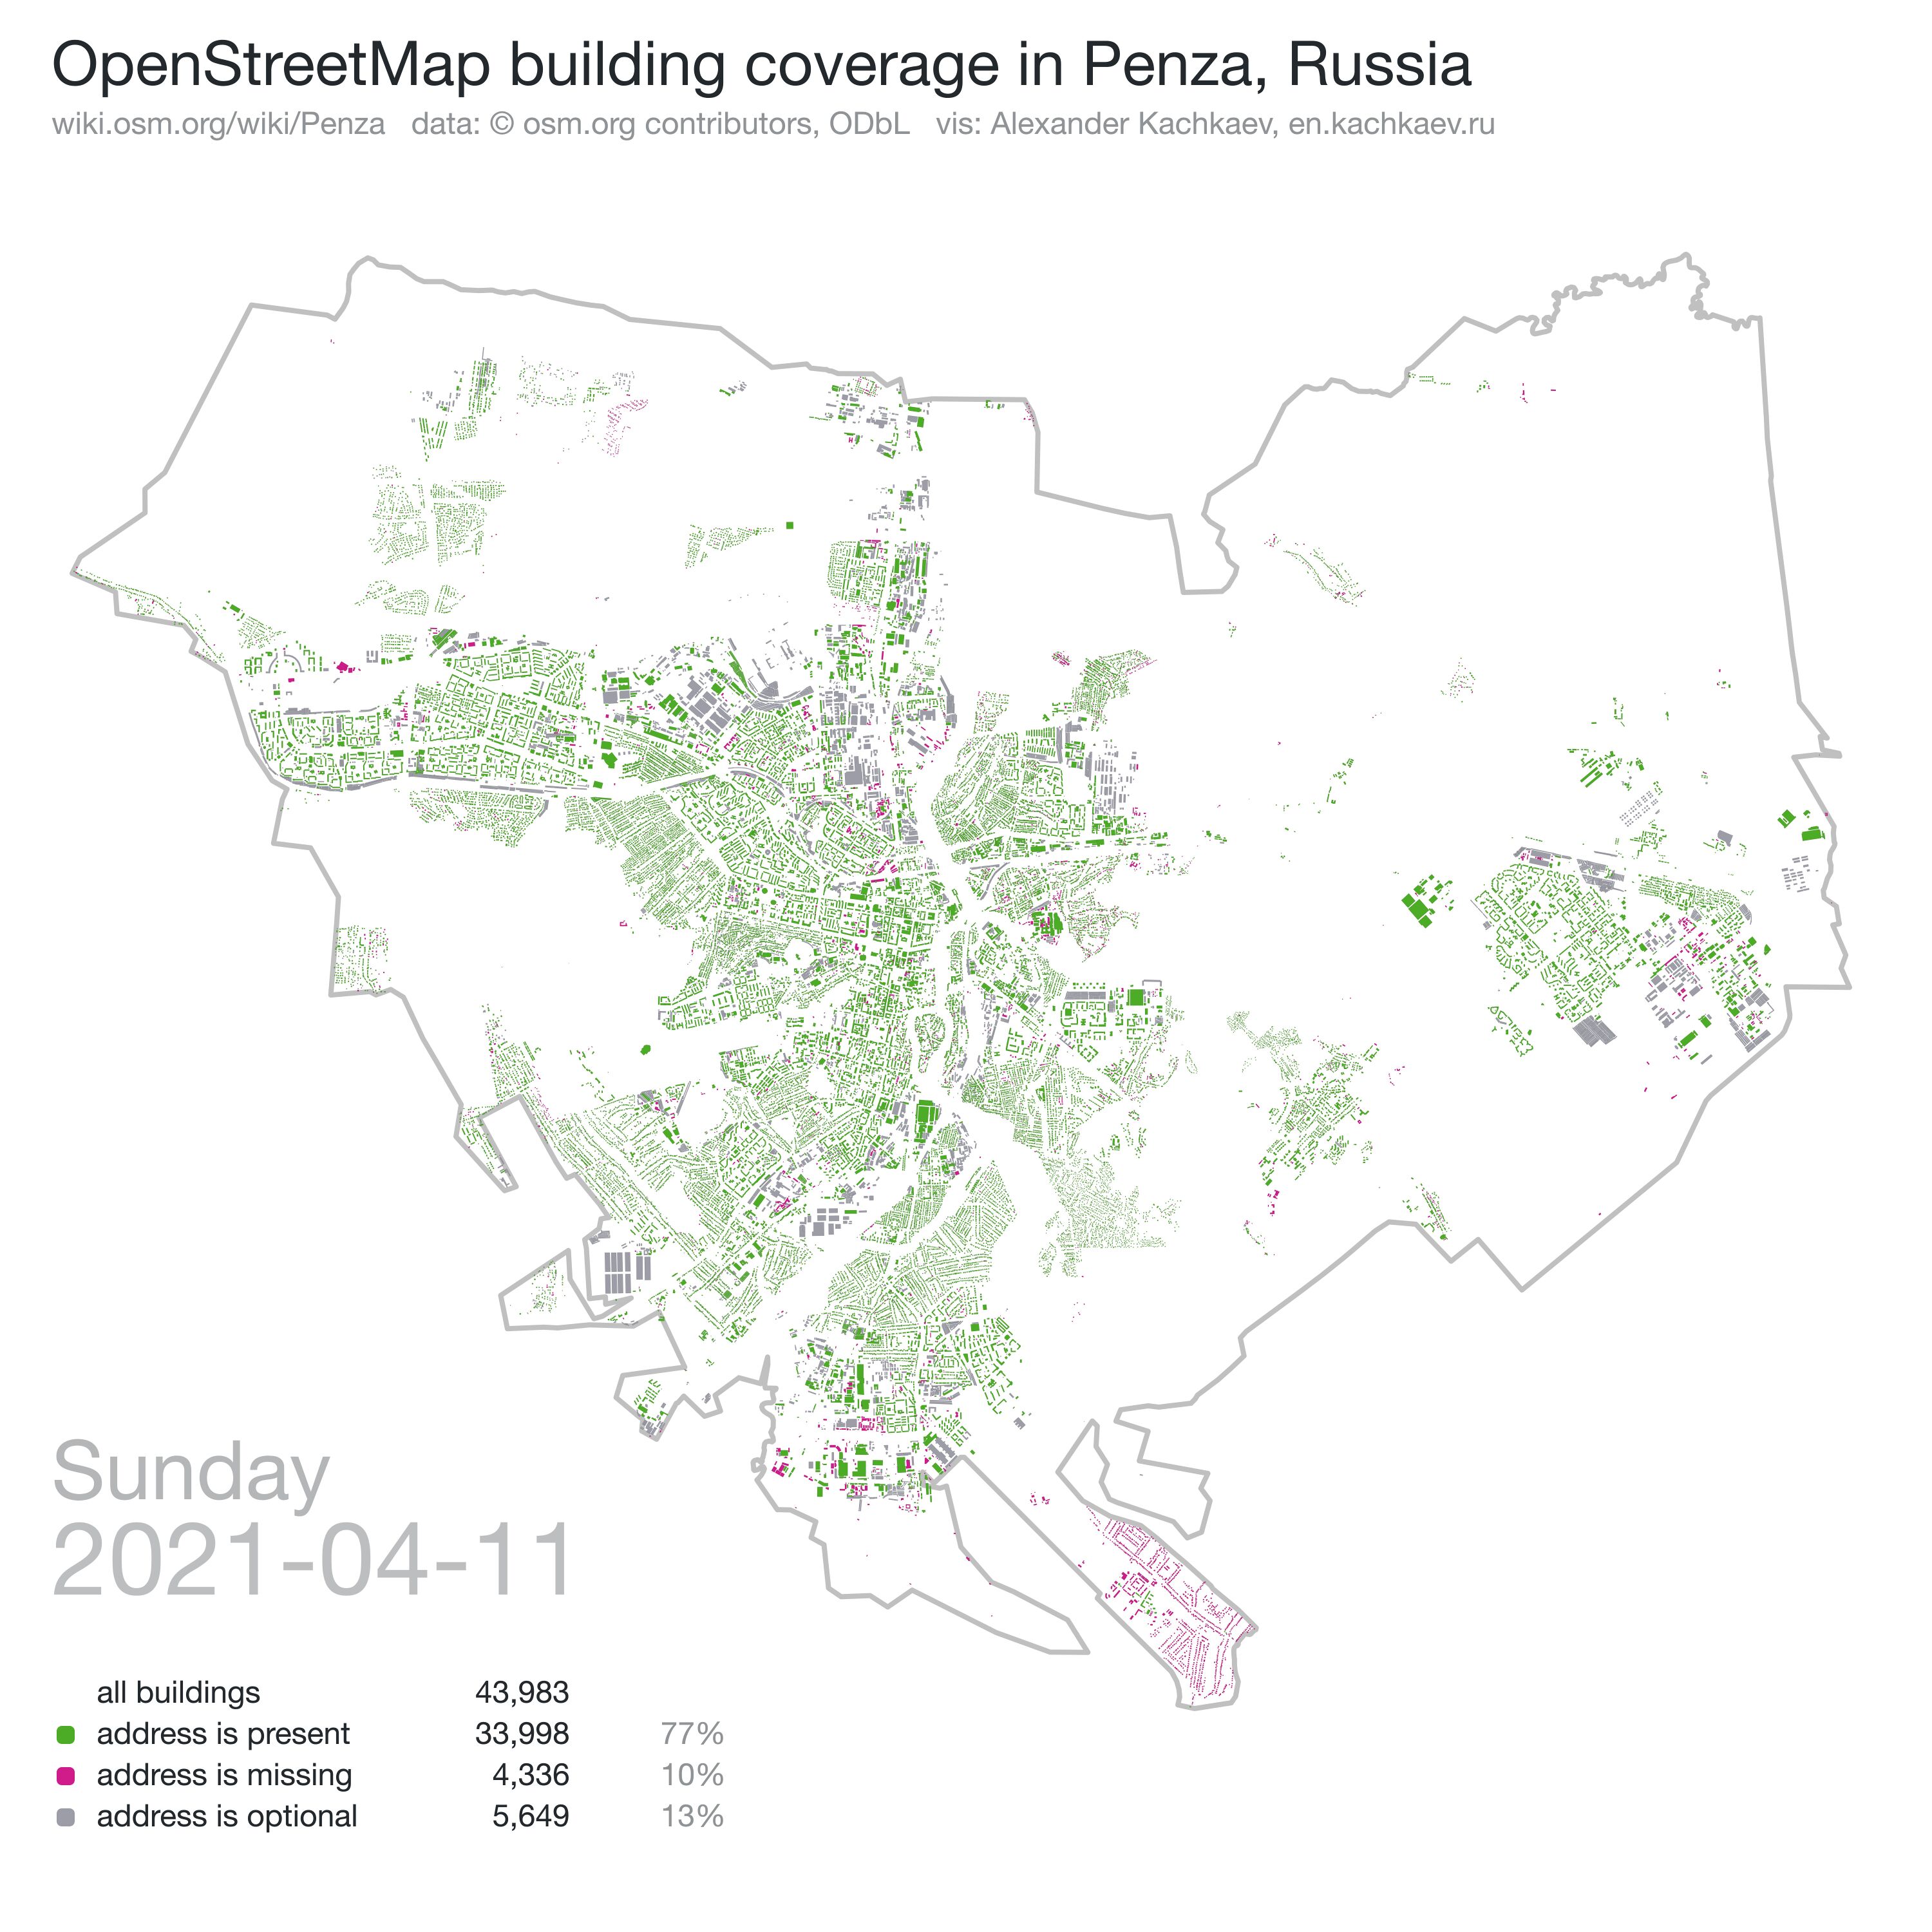
A few weeks ago we kicked off an online OpenStreetMap mapping party in Penza, Russia. Our main focus was the building coverage and I’m extremely happy to share the results!
A geovis is worth a thousand words, so:
The key sources for the building outlines where Bing and Maxar imageries. To fill in most of the missing addresses, we looked into the governmental land registry [ru]. It became a permitted data source for OSM quite recently. Some folks also checked Yandex Panoramas [ru] to read address plates or to derive 3D building shapes. This source was also allowed because the OSM community got an explicit permission back in 2011.
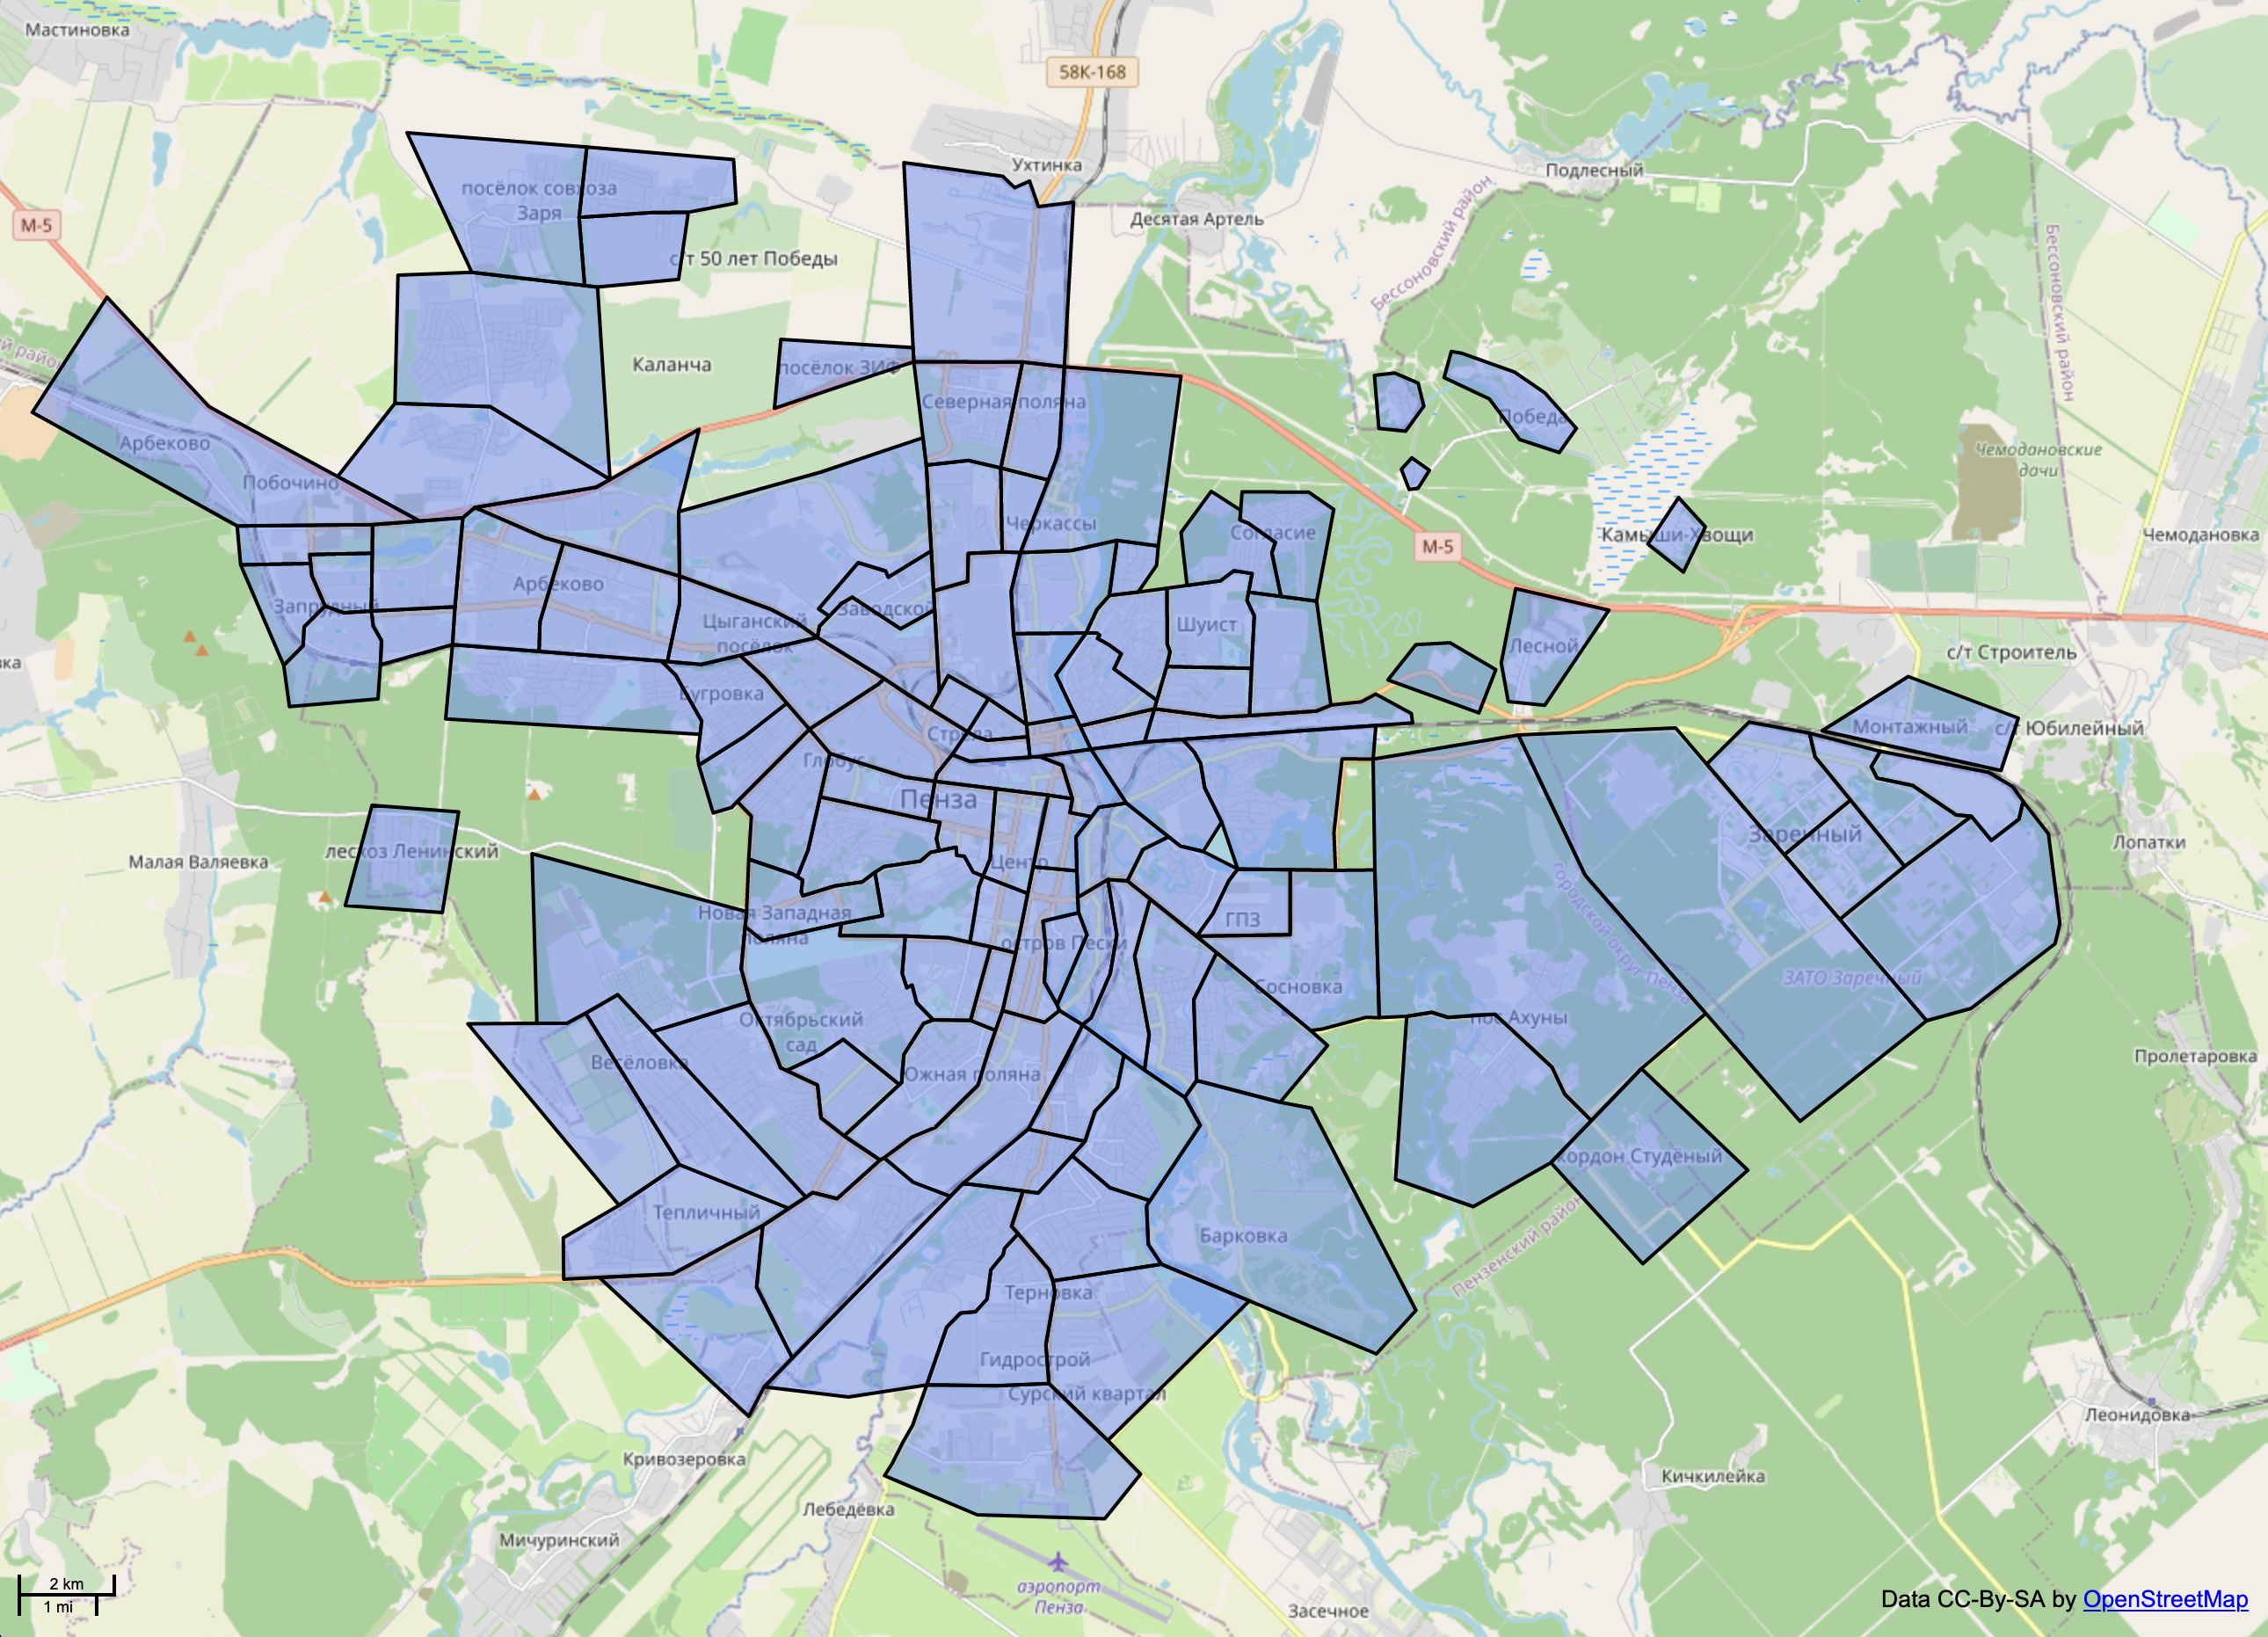
To help us coordinate the efforts, the area was turned into a ‘mapping cake’ on MapCraft. People grabbed ‘cake slices’ and mapped within them, thus reducing the chances of conflicts in data.
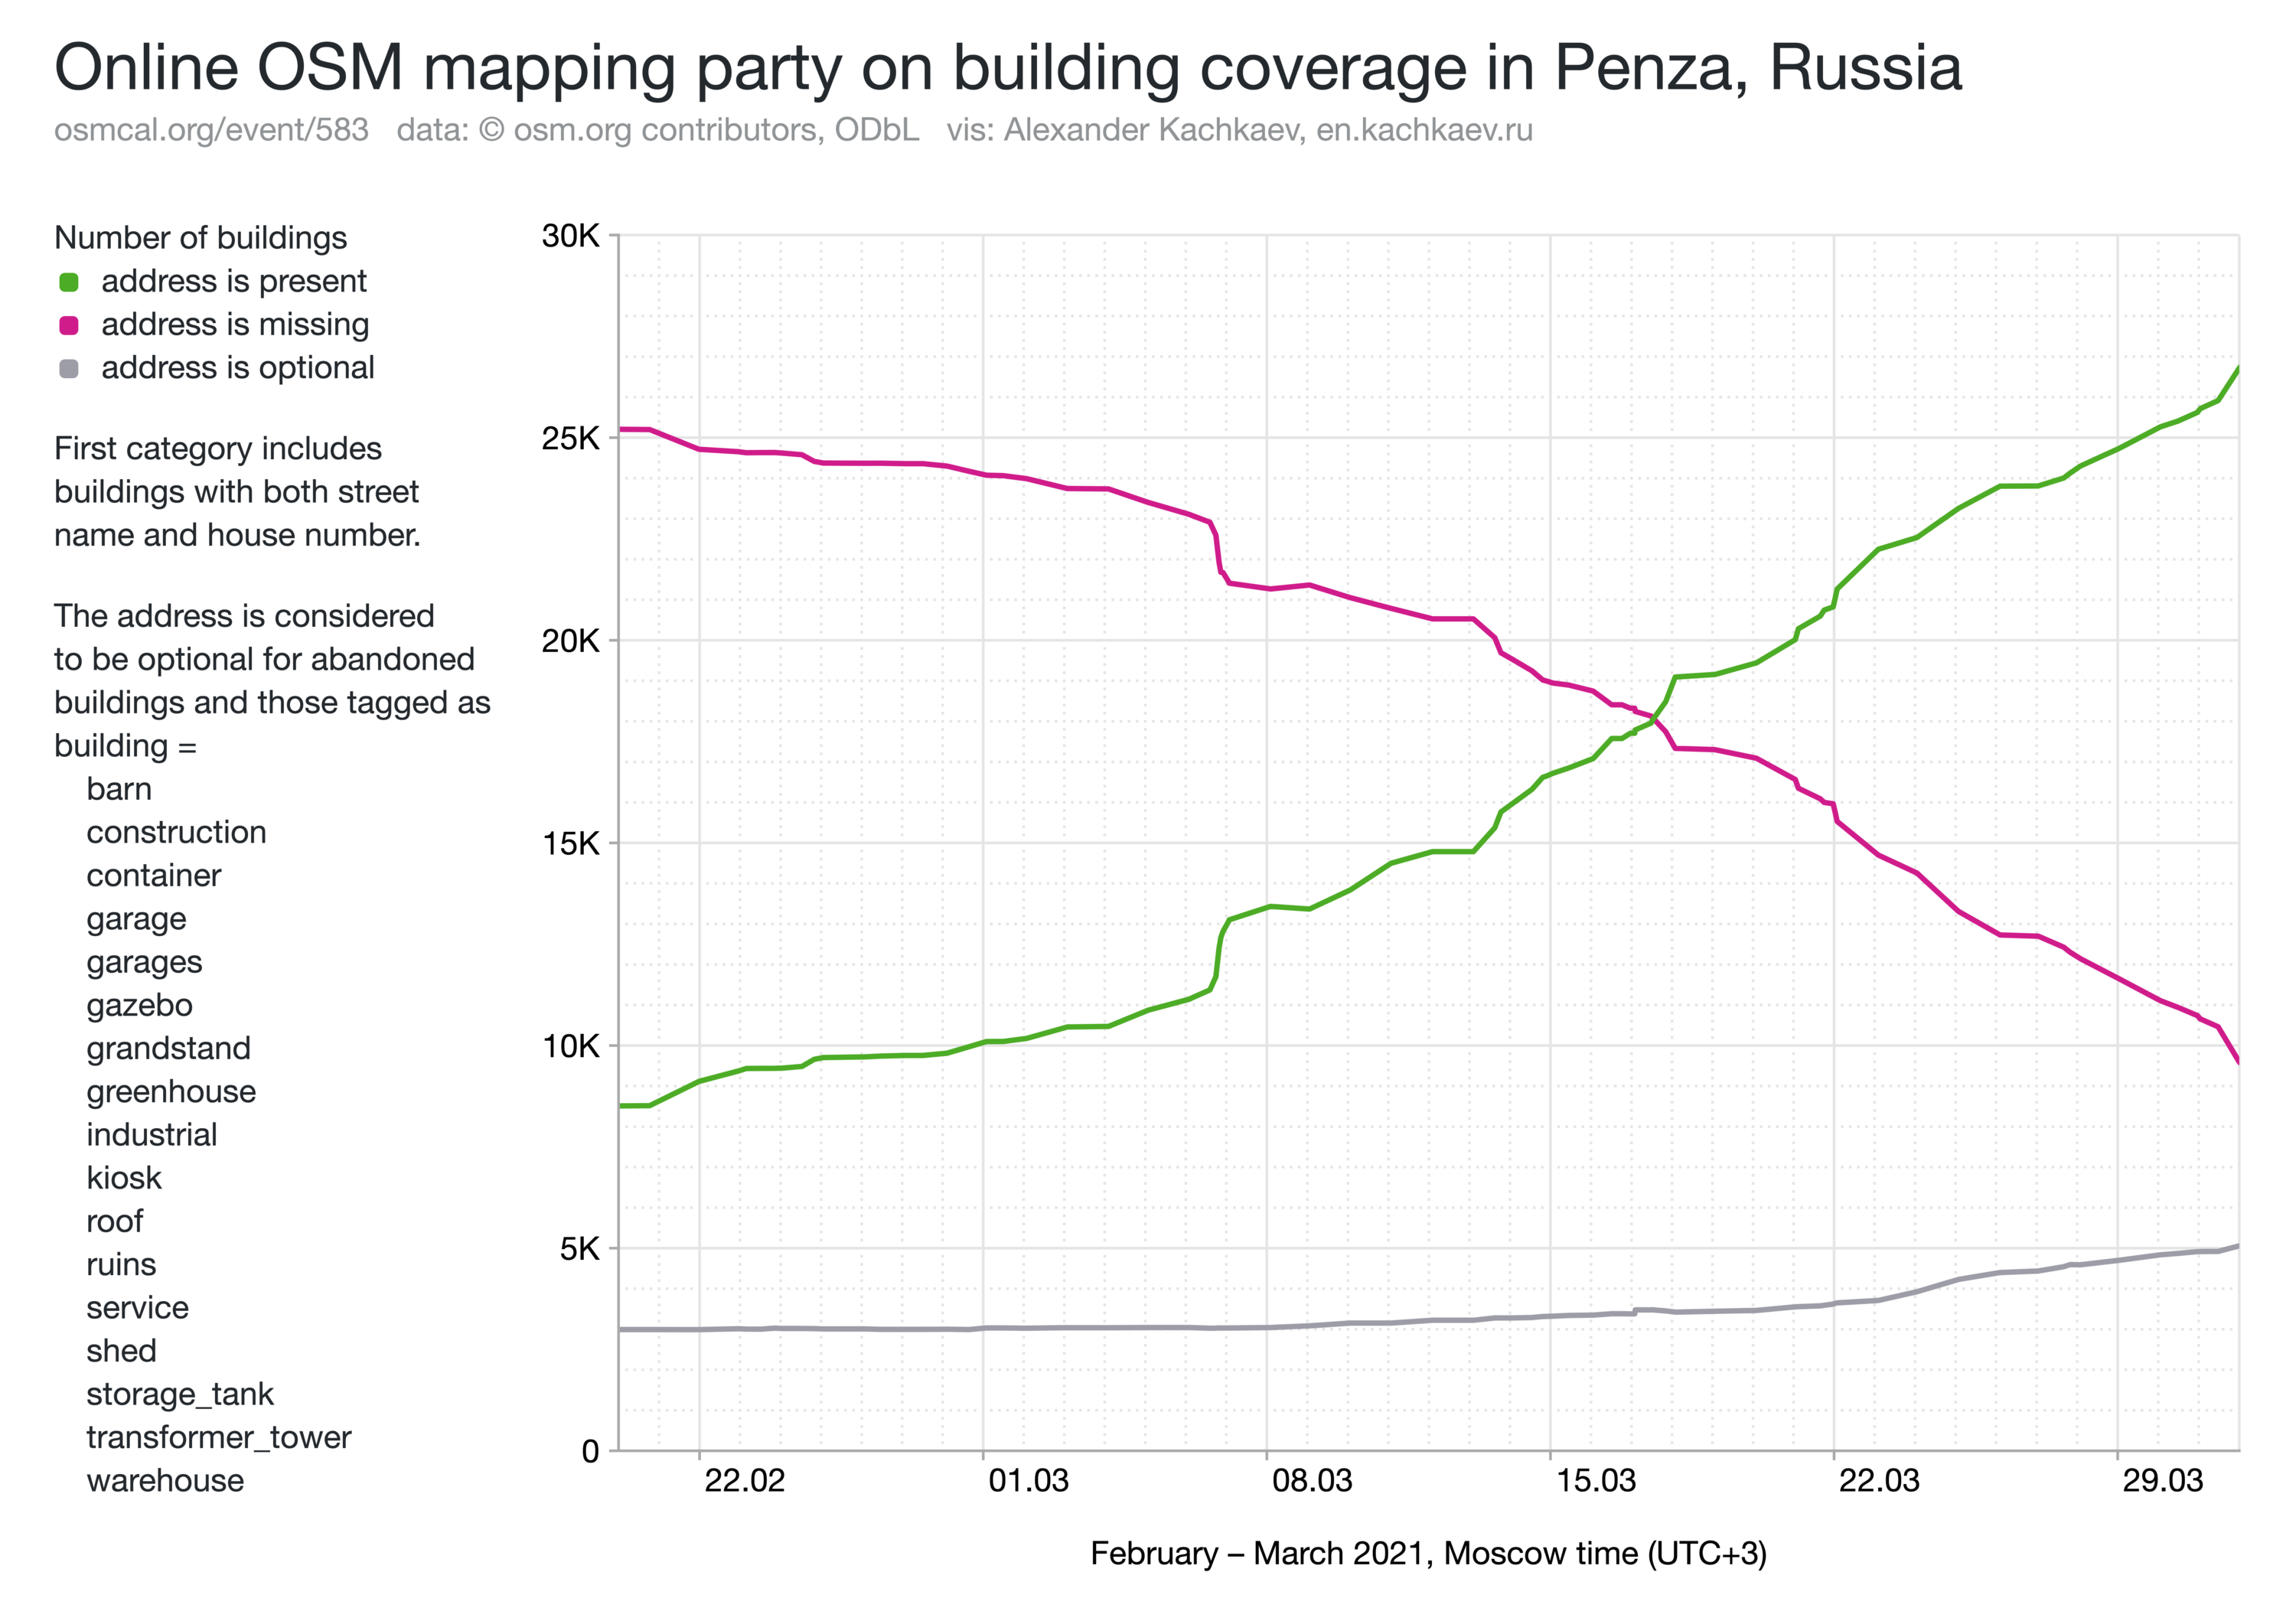
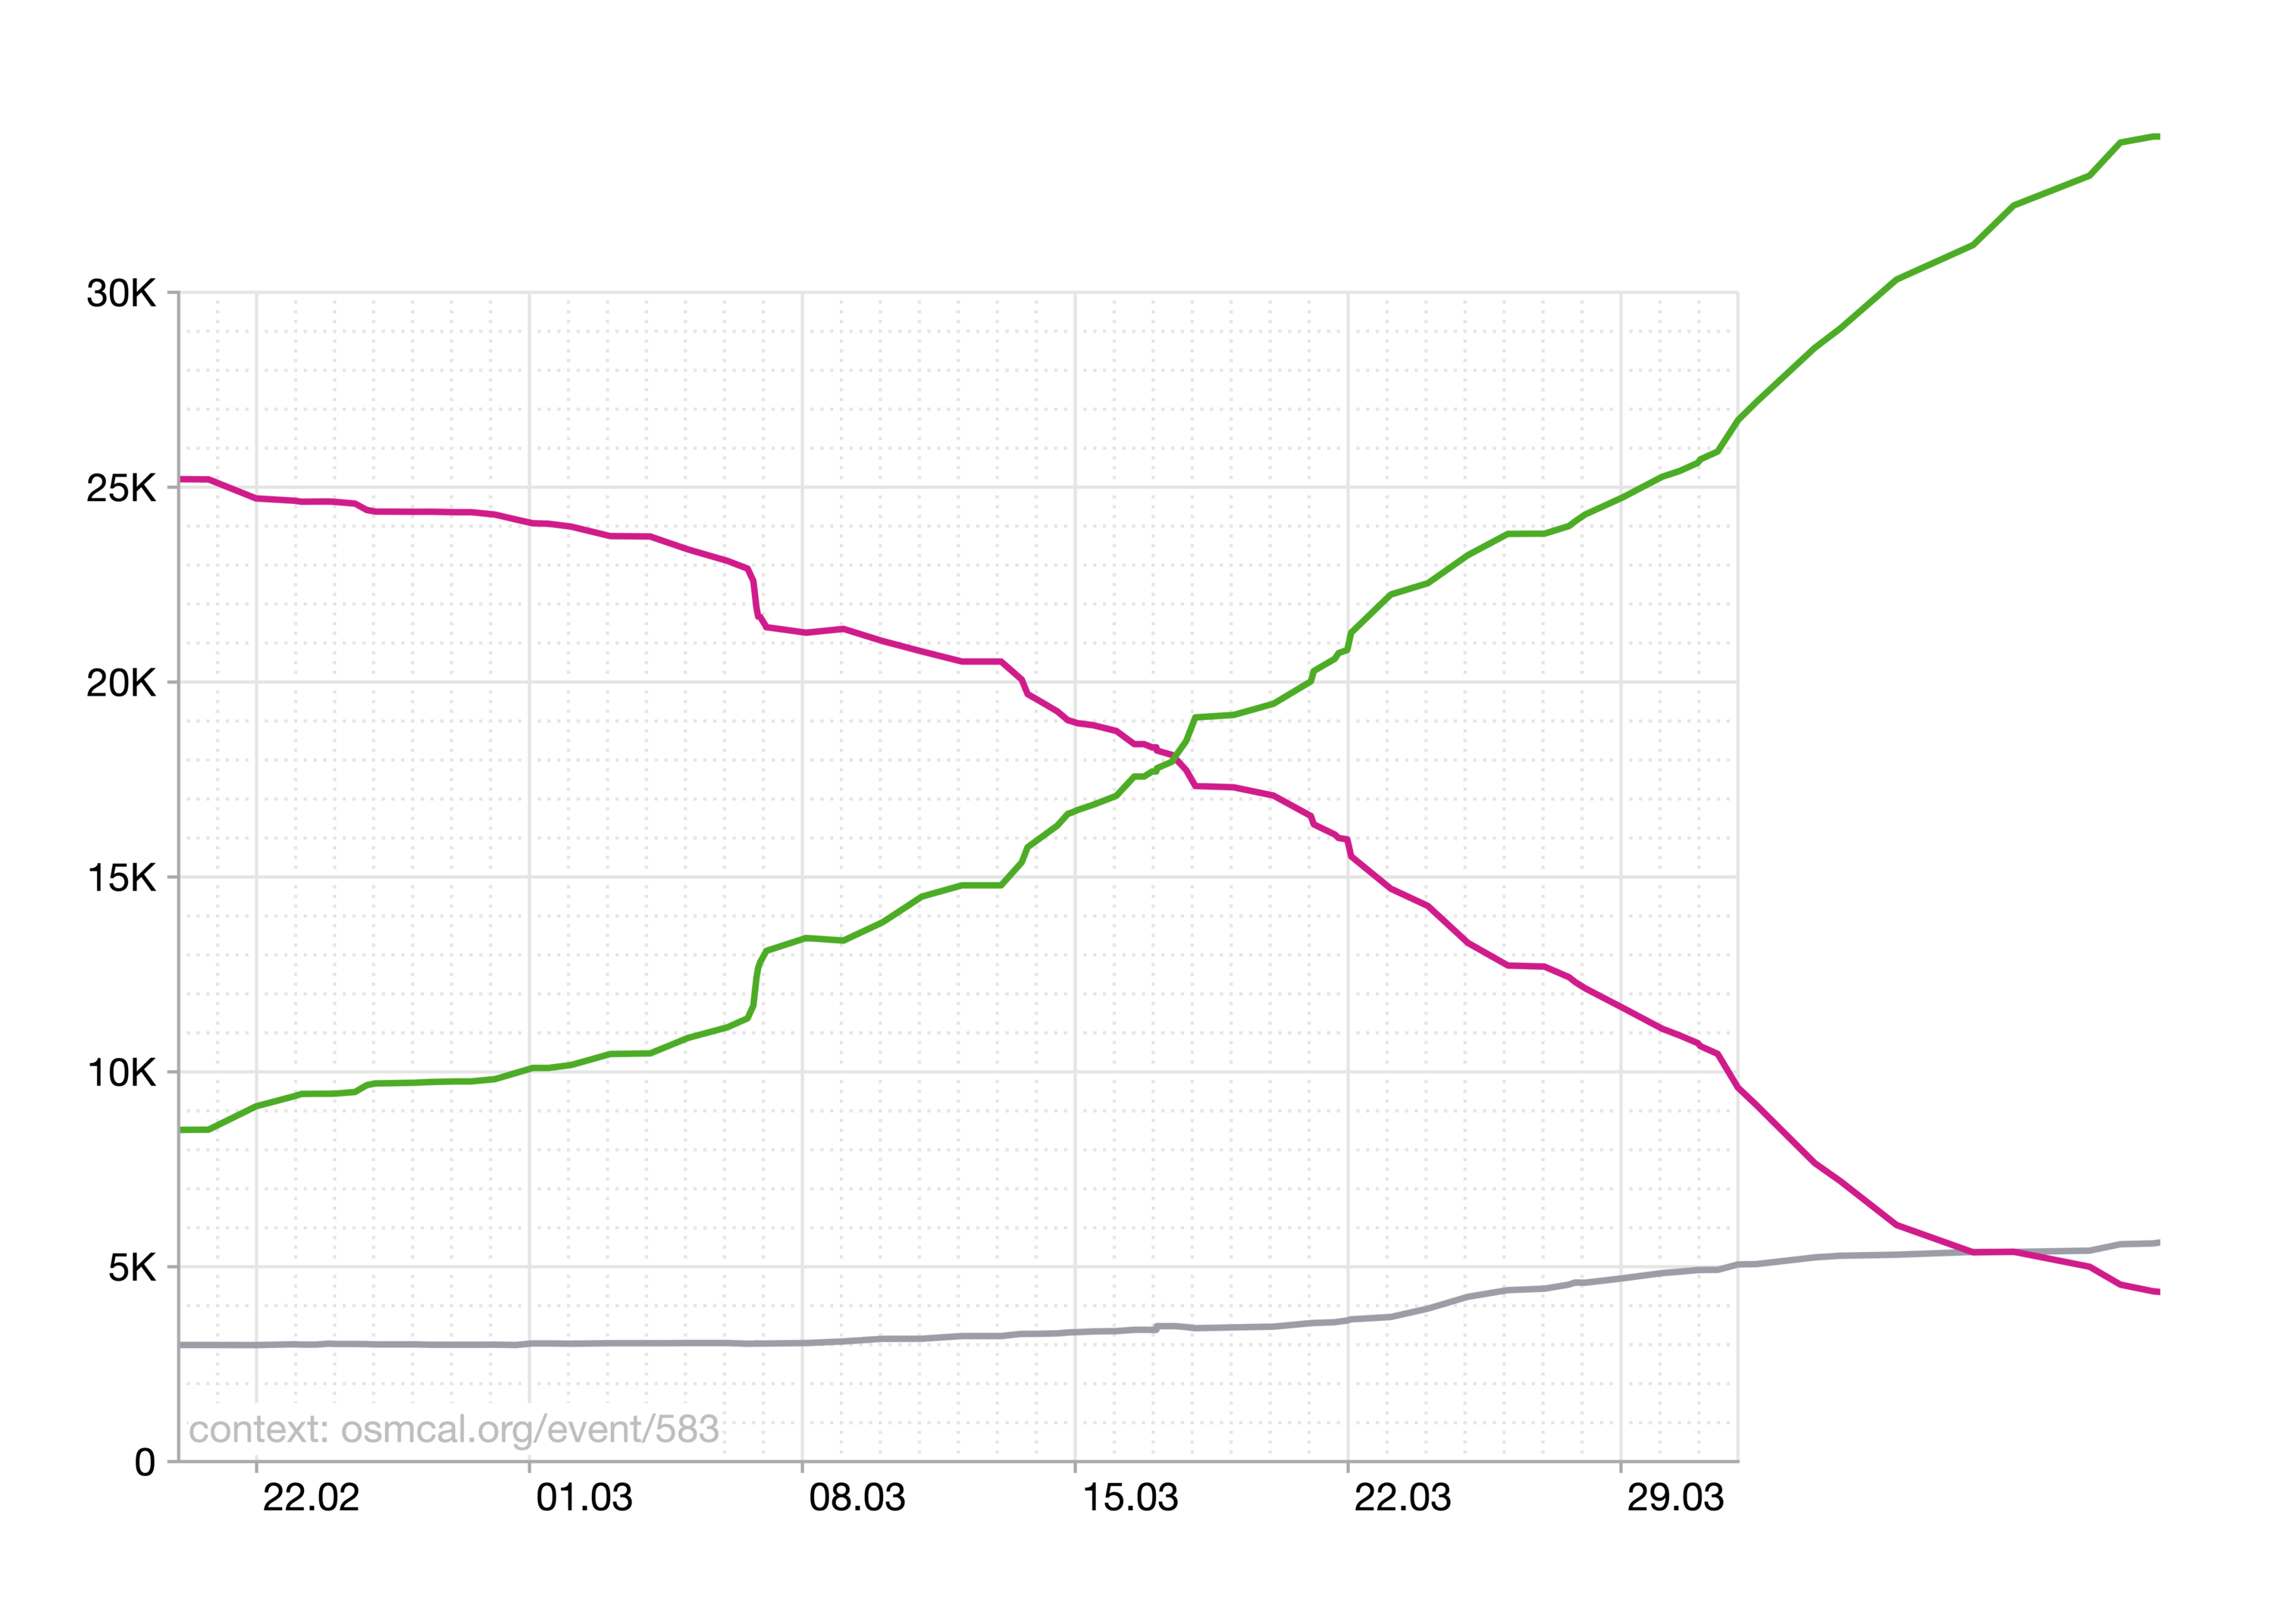
Here is our joined progress over time. Can you guess when I started sharing this chart with the folks every evening? Hint: mid March 😁
Another interesting view is a geo diff. Black fill represents changes of building shapes or the addition of address tags. The more dark sports you see in a neighbourhood, the greater it has been affected by our mapping efforts.
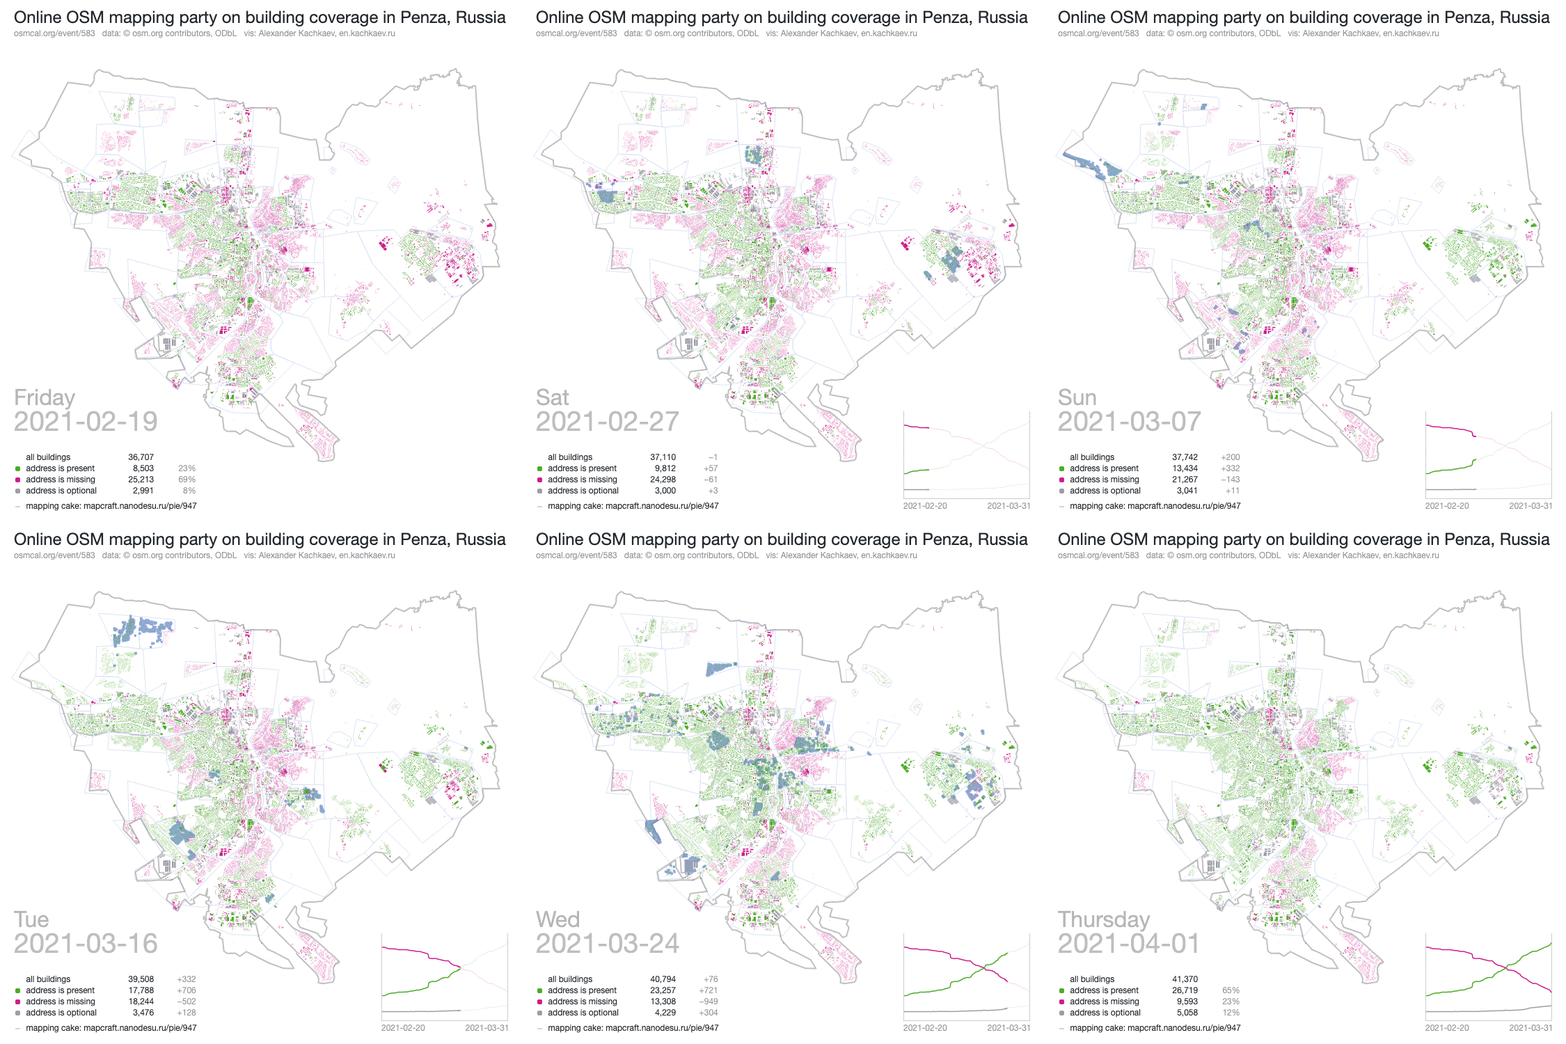
Static vises are good, but an animation is better. This one spans over 42 dates and renders over 1.5M building outlines in total.
The mapping party was officially over on Wednesday, 31 March and I expected the activity to drop shortly afterwards. Glad to admit that I was very wrong! 😅
In just over 10 days since the mapping party end date, Penza and its suburbs look as green as never before 💚
By the way, have you noticed that the place I am from is shaped like a heart symbol? 😁
A couple of links to wrap up:
-
🗓 Our event in the OSM calendar
https://osmcal.org/event/583 -
💻 Source code for the vises
https://github.com/kachkaev/mapping-party-vises
I presented the data with Next.js, React.js, TypeScript and visx and then exported screenshots with Node.js and Puppeteer.
Update: See also a timelapse video of edits: webm on osm wiki. The interactive version was made by @bezdna.

Discussion
Comment from SGorskiy on 12 April 2021 at 10:56
В Сибири и зауралье много городов не прорисованных.
Comment from YoViajo on 23 April 2021 at 13:47
Great initiative ! I like the visualizations of progress.