
The Parkland Walk unstyled map printout
Posted by Harry Wood on 6 July 2022 in English. Last updated on 7 July 2022.Next week we’re having an OSMLondon pub meet-up for the first time in a while. Or at least I am. People don’t seem to like setting themselves as “attending” on osmcal.org, but I don’t think I’ll be alone in the pub. Looking forward to it anyway!
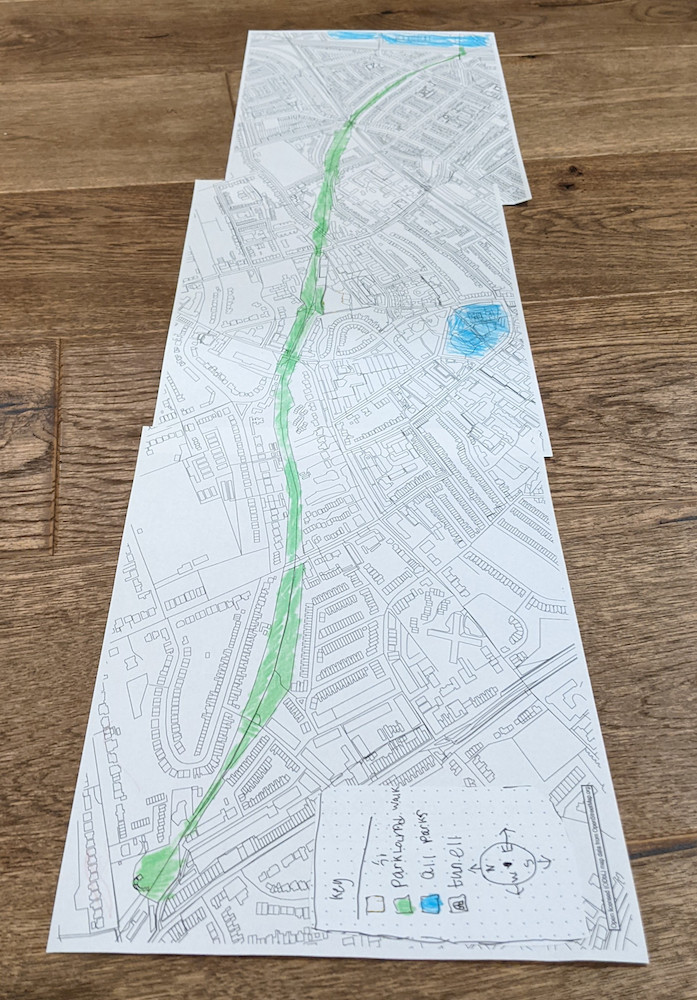
Today I wanted to print out a map of “Parkland Walk”, a local nature trail (and former railway). This was a project for/with my 6 year old son, which I spent a bit longer on than I should have today. In his class they’re doing various activities related to Parkland Walk. I thought it would be fun to give him a big map in style which he could colour in.
The nice thing about a style for colouring in, is that it can be no style at all! Just nice thin lines for every “way” from the OpenStreetMap data was all I needed. I knew that would give him lots of intricate little building shapes and an outline of the Parkland Walk area itself. I thought I’d try send vectors to print to get these lines looking nice and sharp, rather than my old crude technique of screenshotting JOSM wireframe view, and inverting the colours.
So I wanted a simple way to go from an OSM file to SVG. In the end I did it as follows:
- Download the area in JOSM
- Delete some trailing “tails” off the edge of the bbox.
- Delete some unwanted way clutter: admin boundaries and underground features.
- Save as… and set the file name extension to geojson.
- Open mapshaper.org in a browser
- Drag the geojson file on there and “Import” with default settings.
- Export and select SVG. default settings.
- Open the resulting SVG in inkscape
- Select the black background polygons
- Go to the “Fill” styling options and set fill to none (“x”)
- Go to the “Stroke paint” options and take it off none onto black colour.
- Go to File->Document properties and set the page size to A4
- Resize the whole image to be much bigger fitting to the A4 page as desired.
- For my case I wanted three different pages to stick together, so I also sized and moved the image to give me the framing I wanted, then moved it again for each page one-at-a-time.
- While resizing I also stretched the image vertically a bit to crudely compensate for losing projection information.
- After making it all bigger, the line widths are relatively thinner which looks a lot better (unless you resize line widths too), but you may want to set the “stroke paint” line widths thinner still.
- Add a little OpenStreetMap credit text in the corner.
- Send to print! (Or save as PDF)
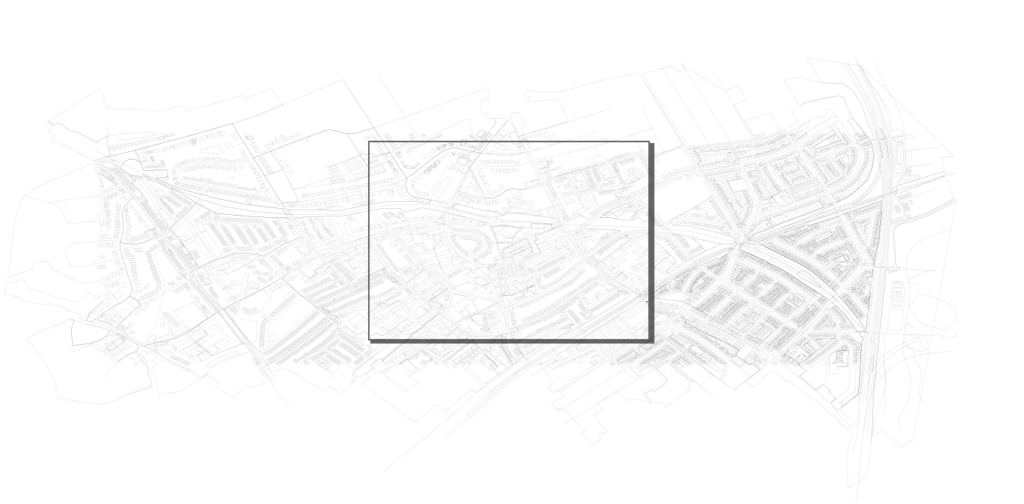
Here’s how it looked in inkscape at the end:
I tend to think in terms of SVG when it comes to vector printing, maybe because I enjoy being able to preview and post-edit things in inkscape. But perhaps I should learn to do these things in QGIS (and print direct from QGIS). Certainly seeing things like 30 day map challenge it became more clear to me that people do produce finalised polished map output directly in QGIS (or ArcGIS etc). And I see it has a clever print layout options. Admittedly I’ve only ever used QGIS for fuddling around and converting from shapefiles and maybe doing geo operations (calculating buffers etc).
I have used Maperative to create styled SVG in the past, and I would recommend it. Excellent SVG output with useful object groupings once you get it into inkscape. But is .NET stuff a bit messy to install on mac?
As mentioned, I’d decided I didn’t need any styling, and so installing either QGIS or Maperative seemed like overkill, but actually I did start looking at those basic lines for roads, and started thinking these could be more fun as areas to be coloured in (introduce a bit of styling).
Also the “simple conversion to SVG” wasn’t as simple as I’d hoped. Quite a few steps in my list above, buts that’s not counting all the experiments and dead ends I hit. I hadn’t used mapshaper before, but followed this answer to arrive at that. I did also follow the instructions to install and use osmtogeojson before realising that JOSM can simply save to geojson! So that’s something which turned out to be pleasingly easy. Could JOSM make that more obvious? A file type picker? A separate “Export as…” menu option? Also should JOSM be writing projection information into geojson? Or what option should I have used within mapshaper to specify projections? …Or could JOSM just save as SVG? Casual feature request :-)
There’s a quite a few different ways to create an SVG map from OpenStreetMap. I remember working on building that wiki list a long time ago, and I see it has been extended since. Please do edit if it’s missing any good options.
Anyway once the six year old got home, his first challenge was to stick the three sheets together, lining things up properly. After that I thought he’d launch into colouring in all the little buildings in a rainbow of different colours, but he’s been learning about maps and so he immediately said “We need a key” and went on to choose a few specific things he wanted to colour in (and add to the key). So it kept him entertained for half an hour. It kept me entertained quite a lot longer than that!
If you’d like to help keep me entertained… come to the pub with me! We’ll be in the Jack Horner on Tottenham Court Road next Tuesday evening. All the details.
Discussion