OpenStreetMap

rtnf's Diary

Recent diary entries

Analyzing OSM's Tile Logs

Posted by rtnf on 2 June 2023 in English (English).

So, I stumbled across this logs (https://planet.openstreetmap.org/tile_logs/)

Let’s (mass) download it, starting from June 26, 2022 until today.

Here’s the content of each csv files : domain name, unknown number, and another unknown number.

Then, process all those downloaded files. Let’s merge all the statistics for each domain name into one single JSON file.

Finally, let’s sort all those domain name based on their occurrences.

Here’s the final result (https://gist.github.com/altilunium/1dd0a8de3852a27fc025bd3a5f07e5ed) :

“341” means that this domain exists in at least 341 OSM’s daily log tile files, from June 6, 2022, until today (June 2, 2023).


Update :

Here’s the same statistics, but for apps (https://gist.github.com/altilunium/7d0b02cb3a248b4c457f3ac31731217c)

Finally, filter that statistics, only for Indonesian apps :

  • Government ministry and agency
    • kemdikbud.go.id : The Ministry of Education, Culture, Research, and Technology
    • atrbpn.go.id : Ministry of Agrarian Affairs and Spatial Planning
    • bmkg.go.id : Meteorology, Climatology, and Geophysical Agency
    • kemenkopukm.go.id : Ministry of Cooperatives & Small and Medium Enterprises
    • kemendagri.go.id : Ministry of Home Affairs
    • esdm.go.id : Ministry of Energy and Mineral Resources
    • pu.go.id : Ministry of Public Works and Public Housing
    • bkkbn.go.id : National Population and Family Planning Board
    • dephub.go.id : Ministry of Transportation
  • Local Government
    • bandung.go.id : Bandung (City)
    • banjarkab.go.id : Banjar (Regency)
    • ntbprov.go.id : West Nusa Tenggara (Province)
    • jabarprov.go.id : West Java (Province)
    • makassarkota.go.id : Makassar (City)
    • tenggulangbaru.id : Tenggulang Baru (Village)
    • palembang.go.id : Palembang (City)
    • kotabogor.go.id : Bogor (City)
    • banjarbarukota.go.id : Banjarbaru (City)
    • malangkota.go.id : Malang (City)
  • Company
    • telkom.co.id : State-owned telecommunication company
    • pertamina.com : State-owned oil and gas company
    • gps.id : GPS tracker company
    • wahana.com : Delivery services company
  • Subsystems
    • com.atlas.eturjawali.dirty : e-Turjawali, Indonesian Traffic Police’s management & monitoring system
    • ppdb-disdikgarut.id : School Admission System - Garut
    • ppdbpekanbaru.id : School Admission System - Pekanbaru
    • sikadirklhk.id : Sistem Rekam Kehadiran ASN Terintegrasi (SIKADIR) - Attendance Recording System - Ministry of Environment and Forestry
    • cctv.malangkota.go.id : Public CCTV - Malang
    • bhumi.atrbpn.go.id : Cadastral Maps - Ministry of Agrarian Affairs and Spatial Planning
    • sekolah.data.kemdikbud.go.id : National School Database - The Ministry of Education, Culture, Research, and Technology
    • juanda.jatim.bmkg.go.id : Weather Stations - Meteorology, Climatology, and Geophysical Agency
    • com.telkomsel.telkomselcm : MyTelkomsel, mobile network operator app.
    • com.bkppdklaten.saenaga/ : Sistem Informasi Presensi Elektronik Abdi Satya Nagara (Saenaga) - Klaten Regency (Attendance Recording System)
    • absensi.estamina : Endless Sistem Manajemen Kinerja Aparatur (e-STAMINA) - Probolinggo Regency (Attendance Recording System)
    • prasasti.mojokerto : Presensi ASN Berbasis Teknologi Informasi (PRASASTI) - Mojokerto Regency (Attendance Recording System)
    • absensi.jemberbaru : Layanan Pegawai Elektronik (LPE) - Jember Regency (Attendance Recording System)
    • sipreti.malangkota.com : Sistem Informasi Presensi Terkini (SIPRETI) - Malang City (Attendance Recording System)
    • kmob.jabarprov.go.id : Kinerja Mobile - West Java Province (Attendance Recording System)

So, I want to contribute a public transportation route that I know to OSM. It’s a little bit hard, but it’s completely doable by using JOSM. Done.

Next? I want to see all the available bus route that already exist on OSM.

So, I made this : altilunium.github.io/bisangkot

It’s pretty much straightforward. Download the route by using Overpass API, convert the downloaded OSM data into the geojson format, display it by using leaflet, then add a little interactivity control, such as “hover to display the route’s name” and “click to focus the route”.

For this one, I queried the Java island only. You can query other region by using this script. Just change the bbox settings on line 32. Then, convert the downloaded OSM data into the geojson format by using this python script that I made.

The conversion is pretty much straightforward, except this “jitter” function.

You know, a single road may contain several route. This condition could confuse Leaflet js, causing the misfirings of onClick and onMouseover event. So, to fix this problem, I try to separate each route as a single geojson line. Every route that crosses a same road will be moved slightly to random direction and random distance from the original coordinate. This simple trick somewhat solved the problem quite well.

Okary. Now, what next? Maybe, encourage more people to add new public transportation route data, I think. Improve both the data quality and quantity. Or perhaps, let’s make a route finder apps (how to reach point A to point B by using public transportation).

Self-hosted vector tiles.

Posted by rtnf on 26 January 2023 in English (English).

Inspired by this video, i want to make my own self-hosted vector tiles.

First, prepare several geojson file by using JOSM. Each geojson file will serve as a “layer”. We can specify the style for each layer. I made three layer (mainroad, suburb, jalan_rest), with this specification

  • mainroad : highway= (secondary | primary | trunk | tertiary)
  • suburb : place=suburb
  • jalan_rest : highway= (* && not secondary && not primary && not trunk && not tertiary)

Use JOSM, create overpass query, save as .geojson, repeat.

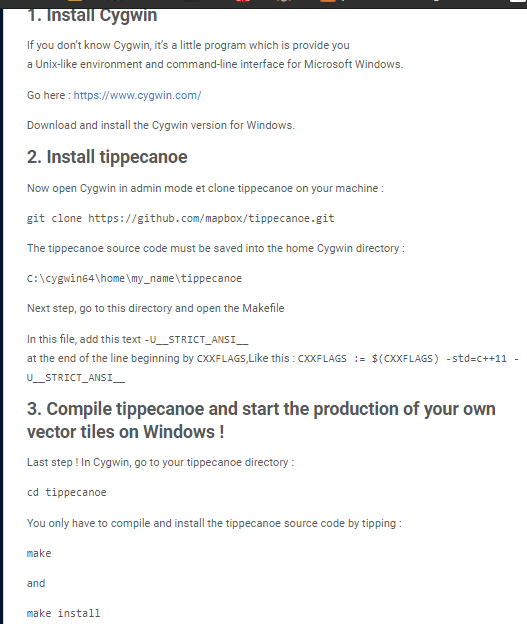
Second, convert these geojson file to mbtile format by using tippecanoe. Installing tippecanoe on MacOS / Linux is pretty straightforward. But, installing on Windows needs a quick-hack. I followed this guide , it works.

Then combine all those geojson file into one mbtile file by using tippecanoe.

Then, convert that mbtile file to pmtile by using go-pmtiles

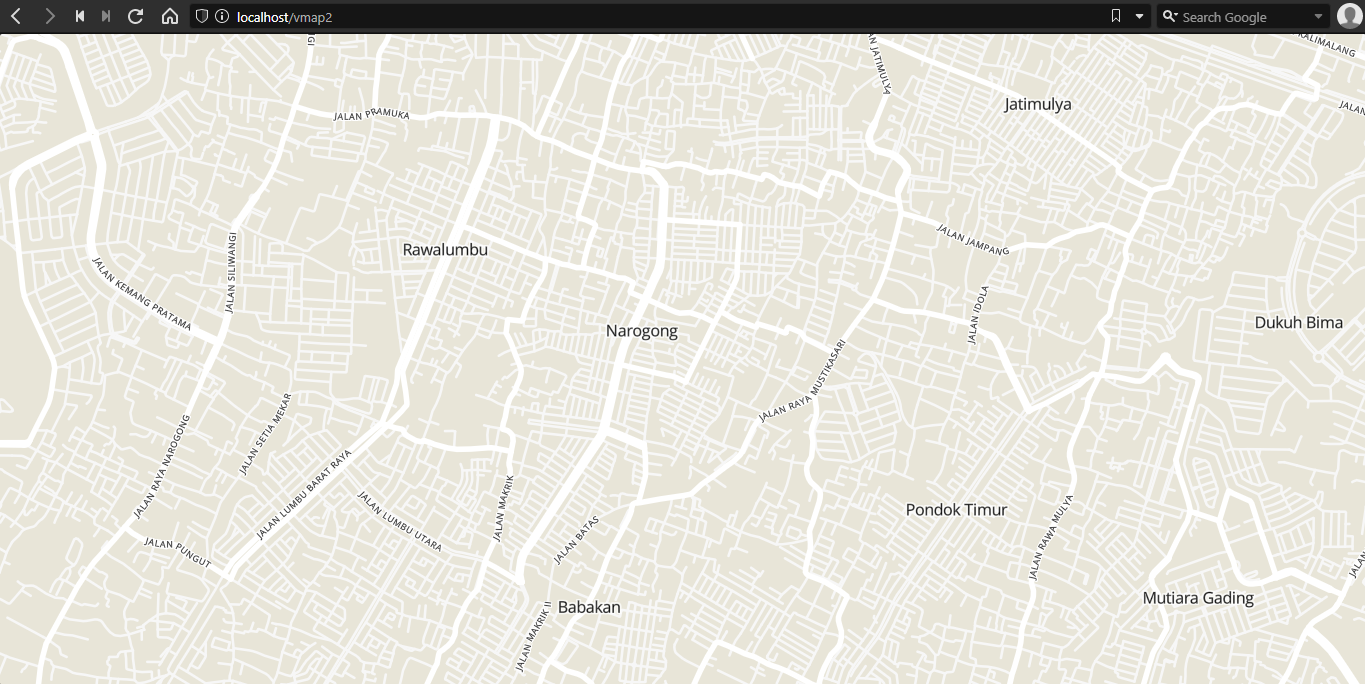
Now, let’s display that mbtile and do some styling.

Index.html, first, let’s import maplibre-gl and pmtiles javascript library.

<script src='maplibre-gl.js'></script>
<link href='maplibre-gl.css' rel='stylesheet' />
<script src="pmtiles-2.5.0.js"></script>

Then, define the map

let protocol = new pmtiles.Protocol();
        maplibregl.addProtocol("pmtiles",protocol.tile);
        console.log(maplibregl)
        var map = new maplibregl.Map({
            container: 'map',
            style: 'styles/maptiler-basic.json',
            center: [106.99811303126697,-6.295502009348816],
            zoom: 11
        });

The rest of the configurations are stored on that “maptiler-basic.json”.

Let’s configure the pmtiles file

"sources": {
    "openmaptiles": {
      "type": "vector",
      "url": "pmtiles://bks2.pmtiles"
    }
  }

Then, configure the fonts file

 "glyphs": "fonts-gh-pages/{fontstack}/{range}.pbf"

Finally, configure the actual map style. Match the “layer” from tippecanoe’s output to “source-layer” tag.

Mainroad layer style :

{
      "id": "road_major_motorway",
      "type": "line",
      "source": "openmaptiles",
      "source-layer": "mainroad",
      "layout": {"line-cap": "round", "line-join": "round"},
      "paint": {
        "line-color": "hsl(0, 0%, 100%)",
        "line-offset": 0,
        "line-width": {"base": 1.4, "stops": [[8, 1], [16, 10]]}
      }
    }

Suburb layer style

{
      "id": "place_label_city",
      "type": "symbol",
      "source": "openmaptiles",
      "source-layer": "suburb",
      "maxzoom": 16,
      "layout": {
        "text-field": "{name}",
        "text-font": ["Open Sans Regular"],
        "text-max-width": 10,
        "text-size": {"stops": [[3, 12], [8, 16]]}
      },
      "paint": {
        "text-color": "hsl(0, 0%, 0%)",
        "text-halo-blur": 0,
        "text-halo-color": "hsla(0, 0%, 100%, 0.75)",
        "text-halo-width": 2
      }
    }

Jalan-rest layer style

{
      "id": "road_minor",
      "type": "line",
      "source": "openmaptiles",
      "source-layer": "jalan_rest",
      "minzoom": 13,
      "layout": {"line-cap": "round", "line-join": "round"},
      "paint": {
        "line-color": "hsl(0, 0%, 97%)",
        "line-width": {"base": 1.55, "stops": [[4, 0.25], [20, 30]]}
      }
    }

Road label configuration

 {
      "id": "road_major_label",
      "type": "symbol",
      "source": "openmaptiles",
      "source-layer": "mainroad",
      "minzoom": 13,
      "layout": {
        "symbol-placement": "line",
        "text-field": "{name}",
        "text-font": ["Open Sans Regular"],
        "text-letter-spacing": 0.1,
        "text-rotation-alignment": "map",
        "text-size": {"base": 1.4, "stops": [[10, 8], [20, 14]]},
        "text-transform": "uppercase",
        "visibility": "visible"
      },
      "paint": {
        "text-color": "#000",
        "text-halo-color": "hsl(0, 0%, 100%)",
        "text-halo-width": 2
      }
    },
    {
      "id": "road_minor_label",
      "type": "symbol",
      "source": "openmaptiles",
      "source-layer": "jalan_rest",
      "minzoom": 13,
      "layout": {
        "symbol-placement": "line",
        "text-field": "{name}",
        "text-font": ["Open Sans Regular"],
        "text-letter-spacing": 0.1,
        "text-rotation-alignment": "map",
        "text-size": {"base": 1.4, "stops": [[10, 8], [20, 14]]},
        "text-transform": "uppercase",
        "visibility": "visible"
      },
      "paint": {
        "text-color": "#000",
        "text-halo-color": "hsl(0, 0%, 100%)",
        "text-halo-width": 2
      }
    }

Done!

OSMSG : A security concerns

Posted by rtnf on 21 January 2023 in English (English).

So, I just stumbled across this tool, “OpenStreetMap Stats Generator”.

This python tool can automatically download and process current planet file and generate the statistics. Cool.

osmsg [-h] [--start_date START_DATE] [--end_date END_DATE] --username USERNAME --password PASSWORD
             [--timezone {Nepal,UTC}] [--name NAME] [--tags TAGS [TAGS ...]] [--rows ROWS] --url URL [--extract_last_week]
             [--extract_last_day] [--extract_last_month] [--extract_last_year] [--exclude_date_in_name]
             [--format {csv,json,excel,image,text} [{csv,json,excel,image,text} ...]] [--read_from_metadata READ_FROM_METADATA]

But I have some concerns.

Why it needs my OSM username and password? Can I trust this tool? What if this tool store my OSM credentials on 3rd party database or something? Not to mention that, we have to type our password manually in the console, in visible plain text (which is, could be stored too on console’s history).

So I decided to dig the source code to find some clue.

def auth(username, password):
    print("Authenticating...")
    try:
        cookies = verify_me_osm(username, password)
    except Exception as ex:
        raise ValueError("OSM Authentication Failed")

    print("Authenticated !")
    return cookies

Alright, now where the cookies go?

if "geofabrik" in args.url:
        cookies = auth(args.username, args.password)
if "geofabrik" in url:
            cookies_fmt = {}
            test = cookies.split("=")
            # name, value = line.strip().split("=")
            cookies_fmt[test[0]] = f'{test[1]}=="'
            response = requests.get(url, cookies=cookies_fmt)
        else:
            response = requests.get(url)

Okay, Geofabric. Does Geofabric really need our OSM credentials or something?

I found some clue here ;

Files which are accessible on our public download server without any login do not contain sensitive data about the OpenStreetMap contributors. The user, uid and changeset fields are missing in these files since May 3, 2018. You can download files with full metadata from a different download server which requires log-in with your OpenStreetMap account. Files from the this non-public download server contain data which is subject to EU data protection regulations. These regulations apply world-wide.

In short, not all Geofabrik planet files require an OSM credential. If we don’t give our OSM credentials, we still can download planet files without personal data of the OSM contributors. But somehow, this python tool forces us to give our OSM credential whenever a geofabrik url is supplied.

Meanwhile, Geofabrik itself provides a safe and proper way to transfer our OSM authorization to 3rd party. That is : (1) redirect to the official openstreetmap.org page, (2) click “grant access”, (3) redirected back to 3rd party page. This way, 3rd party tool don’t know (and don’t store) our valued OSM username and password.

In short, this python tool might risk your OSM account because it doesn’t implement a security best practices to transfer OSM authorization to 3rd party. Even if this tool doesn’t actually store your OSM password (we might need more investigation regarding this accusation), your password is still visible and recorded to your own console history, in plaintext format.

osmimgur : See tagged imgur images on OSM

Posted by rtnf on 19 January 2023 in English (English). Last updated on 20 January 2023.

First, download all OSM objects that contain the substring “imgur” inside the “image:” tag. I use Overpass API on JOSM.

[out:xml][timeout:90];
(
  nwr[~"image"~"https://i.imgur.*"];
);
(._;>;);
out meta;

Then, export the downloaded OSM objects as GeoJSON file for further processing.

Next, for the sake of simplicity, filter everything except OSM point node. Also trim all of the OSM tag except the image to minimize the GeoJSON filesize.

import json
f = open('imgur.json',encoding='utf-8')
data = json.load(f)
allobj = data['features']
newdata = {}
newdata['type'] = "FeatureCollection"
newdata['generator'] = "rtnf"
newdata['features'] = []

for i in allobj:
	if i['geometry']['type'] == "Point":
		prop = i['properties']
		for j in prop:
			if "image" in j:
				#print(prop[j])
				newy = {}
				newy['type'] = "Feature"
				newy['properties'] = {}
				newy['properties']['image'] = prop[j]
				newy['geometry'] = i['geometry']
				newdata['features'].append(newy)
print(json.dumps(newdata))

Finally, show this preprocessed geojson file by using Leaflet frontend. Since the dataset is quite massive, use MarkerCluster plugin. I tried it before without this plugin, and my browser was crashed.

var map = L.map('mapid',{ preferCanvas:true, zoomControl: false }).setView({lat: -6.2, lng:  107.0},1)

// Basemap
L.tileLayer(
  'https://tile.tracestrack.com/_/{z}/{x}/{y}.png', {
    maxZoom: 18,
    attribution: 'Data: © <a href="https://www.openstreetmap.org/copyright">OpenStreetMap contributors</a>
  }).addTo(map);

// Marker cluster
var markers = L.markerClusterGroup();
markers.addLayer(L.geoJSON(a, {
    onEachFeature: onEachFeature
}));
map.addLayer(markers)

// Pop-up on click
function onEachFeature(feature, layer) {
    if (feature.properties && feature.properties.image) {
        layer.bindPopup("<img src='"+feature.properties.image+"'><br><a target='_blank' href='"+feature.properties.image+"'>Image license</a>");
    }
}

Installing MapLibre GS Native on Android

Posted by rtnf on 7 January 2023 in English (English). Last updated on 16 January 2023.

Back then, my laptop was a potato, so i can’t afford to run Android Studio decently. That’s why i never touched Android Development at all back then.

But now, I got core i5 + SSD. Let’s try Android Development once again, all from scratch.

Download and install :

  • Download android-studio-2021.3.1.17-windows.exe (912.92 MB)
  • Install. But it downloads several additional packages. Wait, then finished.
  • Open. Create new project. But it downloads, yet again, several additional packages. Wait, then it finally finished. In the end, my Android Studio downloaded additional 2.1 GB data.

Now, for starter, let’s make a map app by using MapLibre GL Native.

Why MapLibre? I stumbled across “Overpass Ultra” , a fork of OverpassTurbo that claimed better performance than OverpassTurbo since it used “MapLibre GL” (GPU-accelerated vector rendering library) instead of Leaflet (which is used by Overpass Turbo). I simply want to test their claim.


Okay, let’s read the installation guide on MapLibre’s github page.

First, let’s add Maven Central repository. It’s a “central server” that stores libraries, packages, and everything else. Just like Python’s “pip” or Linux’s “apt” or Node’s “npm”, it’s a convenient public service to make developer life’s way much better.

Open “Gradle Scripts -> build.gradle (Project : )”. Here’s what I got after opening that file :

plugins {
    id 'com.android.application' version '7.3.1' apply false
    id 'com.android.library' version '7.3.1' apply false
    id 'org.jetbrains.kotlin.android' version '1.7.20' apply false
}

Now, let’s modify it like this :

plugins {
    id 'com.android.application' version '7.3.1' apply false
    id 'com.android.library' version '7.3.1' apply false
    id 'org.jetbrains.kotlin.android' version '1.7.20' apply false
}
allprojects {
    repositories {
        mavenCentral()
        gradlePluginPortal()
        google()
    }
}

While MapGL Native is located at mavenCentral, I added additional gradlePluginPortal (for Gradle-related dependencies) and google (for any official google dependencies).

Then, let’s sync. But unfortunately, it failed. “Build was configured to prefer settings repositories over project repositories”. Oh no.

Let’s copy-and-paste this error message right to Google Search. Suddenly, it solved! Many thanks to YCuiCui’s answer on StackOverflow. All I had to do is just open the settings.gradle, and delete the whole dependencyResolutionManagement block.


Alright, by the way, what is a “Gradle” anyway?

Put it simply, it’s a build tool. Back then, compiling an app solely by using command-line hackery was really tedious and hard. Something something like javac ClassName.java -> java ClassName. The complexities are increased exponentially if our apps consisted of tons of source code files. By using build tool, everything can be easier, in the automated way.

Hans Dockter created Gradle in 2008. Then in 2013, Google selected Gradle as default build tool for Android. Here’s an excerpt of his interview regarding the history of gradle :

As I started using Groovy as a technology for my initial build system, I thought it would be good idea to attend the first ever Groovy and Grails Exchange. There I met Steven Devijer, the co-founder of Grails, who was also doing some work on an internal build tool for his client. We both got very excited about pushing a new build system forward.

Gradle was, always has been, and always will be our idea for a more efficient continuous delivery tool.

Google’s involvement with the new Gradle-based Android build system was a dramatic accelerant for the community. We’ve made more progress in the last year than I anticipated we’d make in five.

We decided to use Groovy as the language of build.gradle files. But 90% of Gradle is written in Java.


Okay, let’s back to installing MapLibre. After we registered the repository’s location (mavenCentral, Gradle and Google), we should register the MapLibre library itself. Let’s open Gradle Scripts -> build.gradle (Module: ) , and add this line inside the dependencies bracket.

dependencies {
        ...
        implementation 'org.maplibre.gl:android-sdk:<version>'
        ...
    }

Umm. Well.. Version? What version? MapLibre’s official documentation on Github doesn’t say anything about which version is it. Aaa. Help.

At first, I guessed that it’s probably android-sdk version. I see the build.gradle (module) file, and there’re several sdk versions over there. Compile sdk (32), min sdk (21) and target sdk (32). I tried all of them, but i failed.

Then, I guessed once more. It’s probably maplibre’s version right? Now where i can see the latest maplibre’s version? I can’t see it on MapLibre’s github page. Now, let’s see in Maven Central website. Search “maplibre”. Got it! “org.maplibre.gl:android-sdk:9.6.0” (latest version). So, it’s 9.6.0 afterall.

I put “9.6.0” on that placeholder, and finally it works. Sync success

To be continued on the next part

While editing this week’s edition of WeeklyOSM, I discovered that OSHDB version 1.0 has been released. So, I decided to test it by myself.

Set the bbox around Bekasi, Indonesia. Then set the filter to (key=highway, value=blank).

Then, I see the download button. Apparently, we can download the detailed CSV data.

So, it seems that the first highway edit happened around August 12, 2008.

Now I’m really curious, who is this OSM editor that contributed to the first highway ever around my city?


After digging the API documentation, I found a solution.

Step 1 : Get the data

Run this python script. It will generate a json file.

import requests
URL = 'https://api.ohsome.org/v1/elementsFullHistory/geometry'
data = {"bboxes": "106.9216919,-6.4162955,107.1153259,-6.0982253", "time": "2008-01-01,2016-01-01", "filter": "highway=*"}
response = requests.post(URL, data=data)
print(response.text)

Note : It’s hard to manually construct the bbox. So, i use the JOSM editor to calculate the bbox for me.

Step 2 : Process the data

This code will sort the retrieved OSM objects (that json file from step 1) according to their creation date. Then it will output a nice markdown table, with links to OSMLab’s OSM Deep History, for further inspection.

import json
from datetime import datetime
from dateutil.parser import parse

f = open('bekasi.json')
data = json.load(f)
allobj = []

for i in data['features']:
	obj = {}
	fromT = parse(i['properties']['@validFrom'])
	obj['from'] = fromT
	obj['id'] = i['properties']['@osmId']
	allobj.append(obj)

allobj = sorted(allobj, key=lambda d: d['from'])
print("Created | OSM ID")
print("-|-")
for i in allobj:
	oid = str(i['id'])
	print(str(i['from'])+ " | "+"["+oid+"](https://osmlab.github.io/osm-deep-history/#/"+oid+")")

Here’s the result :

Minor Revision

Then I suddenly realized that, why I start the query from “2008-01-01”? Can we go even further? What happens if I set the start date to 2000, for example?

{
  "timestamp" : "2022-11-30T06:03:43.184642",
  "status" : 404,
  "message" : "The given time parameter is not completely within the timeframe (2007-10-08T00:00:00Z to 2022-11-20T21:00Z) of the underlying osh-data.",
  "requestUrl" : "https://api.ohsome.org/v1/elementsFullHistory/geometry"
}

Apparently, 2007-10-08 is the maximum limit. So, I recalculated the data, based around this limit. Here’s the revision.


So, what is the first OSM highway edit around my city? I still don’t know. This statistics showed that OSM edit has already begun since 2005, but this API’s maximum limit is around 2007.

JOSM : Update Java

Posted by rtnf on 11 November 2022 in English (English). Last updated on 14 November 2022.

You are running version 1.8.0_351 of Java. JOSM will soon stop working this version. We highly recommend you to update to Java 17.0.5 Would you like to update now?

Whoa. Scary.

I immediately opened my Java updater, update the java, then relaunch the JOSM.

But it’s failed. The message is still shown. What’s wrong?

Then I clicked the “update Java” button on the JOSM’s warning message. But I got redirected to definitely-not-Java website.

Whoa. What’s wrong?


Well, actually I already know the context behind all of this. Due to recent Java’s license change, JOSM might be incompatible to the official Java release. That’s why JOSM redirected me to Azul Open JDK instead of the official Java site.

Still, it’s quite confusing, even for me who understand the context.


Okay, now I downloaded Azul Open JDK. Extracted it. But unfortunately, there is no installer at all. Uargh. Another headache.

Okay, so I got java.exe inside “bin” folder. So I just have to run the josm-tested.jar against this brand new java.exe. That means I’m gonna need some command prompt hackery here and there.

Create a new shortcut, “type the new location of the item”, then :

%comspec% /k C:\Users\LENOVO\Downloads\zulu17.38.21-ca-fx-jre17.0.5-win_x64\bin\java.exe -jar C:\Users\LENOVO\Downloads\zulu17.38.21-ca-fx-jre17.0.5-win_x64\bin\josm-tested.jar

Finally I got a working JOSM windows shortcut. No more nagging “pls update” warning notification. Yey!


Update from the comment section : There’s actually a (windows) installer. Choose “msi” instead of “zip” on the download page.

TIGER, OSM US & MapRoulette

Posted by rtnf on 6 September 2022 in English (English).

TIGER

The US Census Bureau’s Topologically Integrated Geographic Encoding and Referencing (TIGER) system. The Census Bureau maintains the TIGER database to assist in its various mandated programs, including the decennial US Census. Because the TIGER database is built with public funding, it is by law in the public domain. TIGER contains the locations of nearly every street, highway, railroad, body of water and legal boundary in the US. It is built from a combination of original US Geological Survey and Census Bureau maps, updated with data collected by Census Bureau staff while in the field.

Bulk Import

“I noticed that someone is importing TIGER line data. Should I keep making changes to the map or should I wait for the TIGER data to show up?”

“The reality is that people have been told for years not to map too much in the US because the TIGER upload will obviate the need for your work. That has kept mappers away.”

The TIGER data has long been a tempting target for OSM. Being in the public domain, its use is not restricted by licensing. And it is available electronically, in vector format, so if a suitable conversion utility were available, it could be converted automatically to OSM’s format. A bulk import of TIGER data was attempted in 2005, but the initial trials failed to produce quality results and the work was abandoned.

In the spring of 2007, Brandon Martin-Anderson and Dave Hansen undertook a brand new effort, hunting down bugs in the previous conversion and import code, and starting fresh. Martin-Anderson had written TIGER parsing code before, and with some help from other OSM developers worked it into a TIGER-to-OSM conversion script.

Attribute Mapping

The time-consuming part, he says, was mapping attributes from one form to the other. “People have a lot to say about how various TIGER tags are converted to OSM tags, whether an A-class TIGER road is residential-class OSM road, et cetera. I spent a great deal more time working out the tag conversion with other members of the community than writing software.”

Conversion

Once all involved were happy with the attribute mapping, Hansen downloaded the entire TIGER data set from the Census Bureau Web site in county-sized chunks, and ran the conversion script on his home computer. The resulting OSM-compatible data set consisted of 379,836,373 objects.

Upload

Converting the data took several days of constant work, but it still needed to be uploaded to the live OSM server. In a postmortem of the attempted 2005 import, Hansen discovered that some of that effort’s problems were the result of trying to import the converted data directly into the database. For reliability, Hansen initially began uploading the newly converted data through JOSM, the client-side application typically used for annotating and uploading GPS traces. This ensured that the TIGER data went through the same API as any other OSM input, averting the breakage associated with the 2005 attempt. It was safer than attempting to bypass the API and alter the database directly.

But, this import method was agonizingly slow.

“I’ve been very painfully uploading the TIGER-generated data through JOSM. At the rate, I’m going it will probably take 5 or 10 years to upload the entire US. I’m uploading one or two counties a day and there are 3,234 counties in the country.” - Dave Hansen, OSM-dev mailing list, August 28, 2007

Eventually, the OSM team devised a better plan. Hansen transferred the already converted data files to a development machine on the same rack as the OSM map server, and admin Tom Hughes dedicated three of the map server’s 12 import daemons solely to the bulk upload.

This improved data import started in early September. Running night and day, seven days a week, the TIGER import should be completed in May or June of 2008. A public web page keeps track of the stats, including the current throughput, percentage of the TIGER data imported, and a list of completed counties.

Although the improved TIGER import is far faster than the old, there is still a long time to wait before it finishes. Hansen came up with a way to make the wait less painful. He began by sorting the counties in the upload queue by population, so the most populated areas go first. Plus, he takes requests. If you want your county imported next, email Hansen and he will bump them up in the queue.

But time is not the only important factor. Shortly after starting the TIGER import, it became clear that the database machine itself would run out of disk space within a matter of weeks. Hughes added additional storage capacity on September 27 and says he is prepared for more complications to crop up along the way.

Quadtiles

One such example is the size of the database index. The team had known for a long time that the existing index was inefficient. The database indexed all of its entries by their latitude and longitude, requiring the lookup of thousands of double-precision floating point values for any given geographic area. Once the TIGER import began, the number of indices shot up dramatically. Luckily, a solution was already in the works. The database switched over to a new index by using quadtiles, dividing the globe into discrete tiles and putting far less strain on the server, resulting in greatly shortened database lookup times.

Quadtiles recursively split each quadrant of the map into four subquadrants, allowing for better space efficiency by only subdividing those quadrants that require more detail. A quadrant containing only ocean and therefore no roads, for example, would not require subdivision, whereas a metropolitan city center would. The quadtile keys are shorter (32 bits as opposed to 16 bytes for the old lat/long indices). Because of quadtiles’ hierarchical nature, geographically close nodes are adjacent in the database index, which improves cache performance.

MapRoulette

The TIGER data set’s successful import does not mean that the work is finished. Users who have collected their own GPS logs in areas covered by the TIGER maps and uploaded the resulting data report sporadic problems with TIGER’s information. Problems include misalignment of roads, missing features, and occasional confusion on features such as cul-de-sacs. Since the TIGER map data was produced from aerial photography, such problems are bound to occur.

An enormous clean up and improvement effort was needed, while the US OSM community was quite small in 2012 (<100 daily active mappers). Something was needed to organize the work. So the idea of MapRoulete was born : a tool to work on small, randomly assigned tasks. The aims were to make a huge mapping effort feel more doable by breaking it up in small tasks and make repetitive mapping more fun.

MapRoulette, the open source web-based micro-tasking platform for OSM, was first announced at State of the Map US in 2012 as a tool to solve the many errors introduced by the import of TIGER road data in the United States. After a successful and quick cleanup of over 60.000 common problems found in the TIGER data, it was clear that the idea of a micro-tasking tool was worth developing further.

MapRoulette proved to be a great way to focus the community on a mapping goal. Now anyone can create challenges on MapRoulette. It’s useful for mapping parties where you want a smaller goal.

References :

  1. Nathan Willis (October 11, 2007) “OpenStreetMap project imports US government maps” linux.com
  2. Nathan Willis (January 23, 2008) “OpenStreetMap project completes import of United States TIGER data” linux.com
  3. Martijn van Exel (August 19, 2022) “10 years of MapRoulette” State of The Map 2022 - Firenze
Location: Perum Bojong Menteng, Bojong Menteng, Kota Bekasi, West Java, 17117, Indonesia

On taggings and stylings

Posted by rtnf on 5 September 2022 in English (English).

There are many local, region-specific, map features that went unrendered on OSM’s default map tile. Most of them even still undocumented on OSM Wiki. Mappers, not finding suitable tag to identify them, trying to encode this information inside some generic tags, like name:* or description:*

Proposing (and defending) new tagging scheme on OSM Wiki is hard and painful. Even if we are successful in doing that, there is still a long way ahead until it finally rendered on OSM’s default map tile.

In short, casual mappers dont see any point in mapping, if their contributions didn’t show up at all on the maps. They collect the data in the hope that this information would be useful to someone out there. Even the time lag between data upload and tile update + re-render is quite frustrating to some mappers.

So, what’s the solution? First, make it easier for anyone to create their own map style. For tags that is still not rendered on OSM default map tile, they can design their own style for that tags. Second, use vector tile instead of raster tile, so the tile update will cost less time.

While stumbling across EWG’s minutes, i found these passages :

  1. Facilitate a framework to use localized styles for osm-carto: e.g. a Polish variant of the style could show parcel lockers on zoom levels only showing parts of Poland, without showing parcel lockers elsewehere and so on.
  2. Offer universal vector tiles, i.e. vector tiles that everywhere contain all OSM data in that tile. This should relieve the technical burden such that people with design focus easier can design new styles.
  3. Write a good tutorial of cartography. If more mappers get capable of designing a style for the cartographic point of view then there should be more and more diverse styles.

I hope they really prioritize this move.


Epilogue : I’m still experimenting the first idea by using Tileserver GL but some reason, there is an unsolved critical bug. I’m gonna throw in the towel, for now.

Location: Blok A, Babakan, Bojong Rawalumbu, Kota Bekasi, West Java, 17117, Indonesia

OSM_PANTAU : OpenStreetMap Recent Change Monitoring System

Posted by rtnf on 4 September 2022 in English (English). Last updated on 5 September 2022.

https://github.com/altilunium/osm_pantau

Color-coded by freshness. More fresh the edits, more red the circle. So we can focus on the very recent changes.

Documentation : https://altilunium.my.id/p/osm_pantau

Now I can conveniently monitor recent changes around my neighborhood.