OpenStreetMap

lxbarth's Diary

Recent diary entries

Growing our community through networks

Posted by lxbarth on 11 October 2015 in English. Last updated on 17 October 2015.

Elections to the OpenStreetMap US board of directors are on and I’m running again. With your vote we’ll grow OpenStreetMap in the US. Read more on how we can accomplish this below and join OpenStreetMap US until October 18th to cast your vote.

I am proud of the work we’ve done with OpenStreetMap US and now is the time to grow our community further by tapping into the huge networks that have started to adopt OpenStreetMap like education, civic hacking and government. Growing our community will bring in more diversity and new energy to make an even better map.

I’ve served on the OpenStreetMap US board of directors for three years and I can’t wait to jump into another one. In the next year I want to work with everyone on the board and the community to strap on the rocket boosters and reach more people by connecting us with networks who’ve already started using OpenStreetMap.

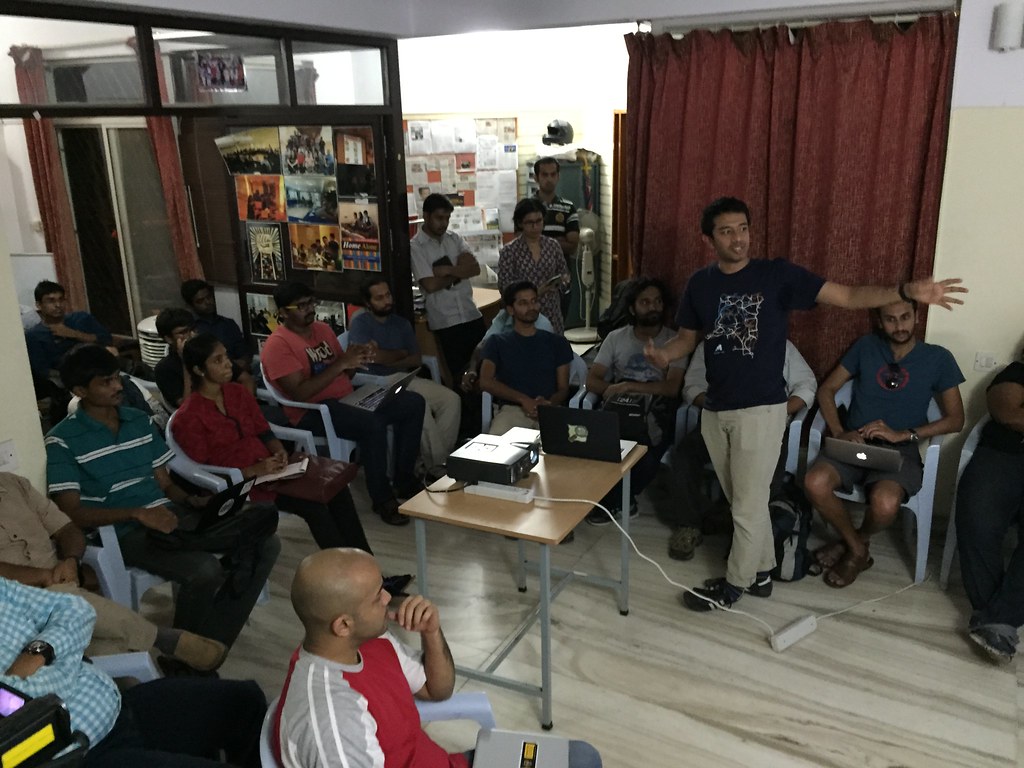
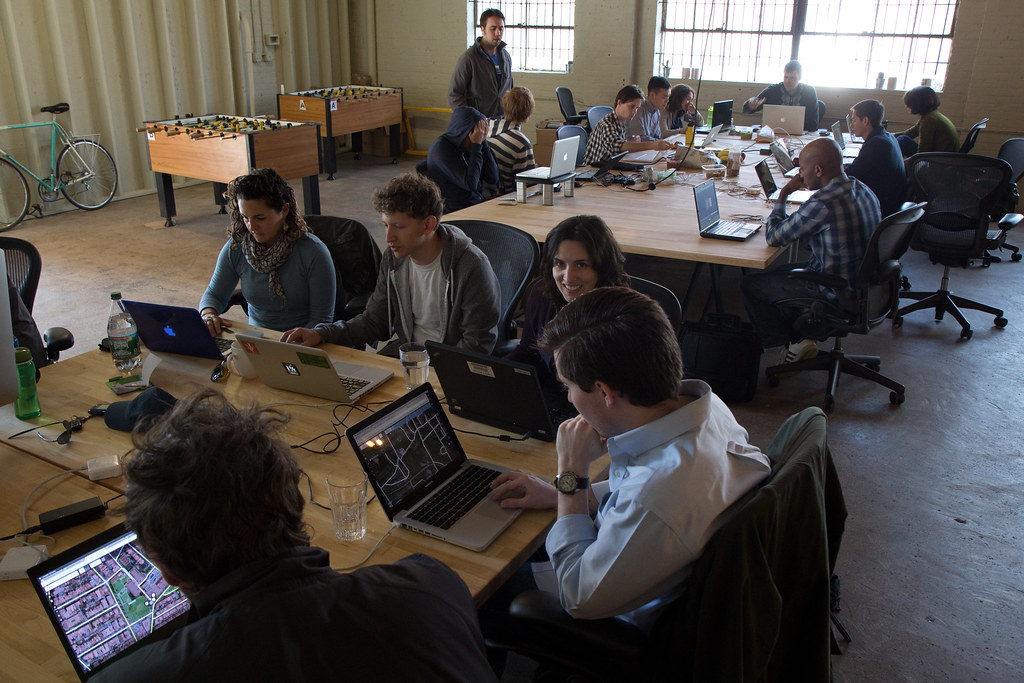
At my work at Mapbox we use and contribute to OpenStreetMap extensively. I am helping build a team that so far has made a quarter million edits to the map, we work in the open and we are key contributors to open source tools for mapping like the web editor iD and the QA tool To-Fix. The beauty and power of OpenStreetMap is it’s providing this one space for everyone to collaborate resulting in a map of amazing quality and coverage available entirely openly. That’s what drives my passion for this community, OpenStreetMap US, my work and for my personal contributions to the map.

Ten years of work by OpenStreetMap contributors in the continental United States. Full view.

In my three years on the board of directors we have focused on making our flag ship event State of the Map US the gathering place for everyone in OpenStreetMap culminating with this year’s conference at the United Nations with over 800 participants up from 220 three years earlier. In the same time we have increased female participation from 15.5 % to 30 % (still ways to go!). We have run quarterly nation-wide mapathons inviting local communities to get together and map their cities.

We strengthened our ability to fund raise allowing us to raise $240,000 total in 2015 where we raised $30,000 just three years ago. We delivered a consistent quality conference, we polished design and communication, we retained a book keeper to ensure sound financials long-term (our board is up for election every year!) and we are in the process of applying for 501 c 3 status, allowing for tax free donations.

We’ve accomplished all of this as a board putting team work first with the help of an amazing community. Just at the last State of the Map US, in addition to the board, we had over 10 volunteers involved in planning and 50 volunteers helping at the event.

And this is just the beginning. While some of these numbers are impressive and the seeds we have planted are developing, the people we haven’t reached yet are still in the majority. Institutions gather information that should live in OpenStreetMap but doesn’t. There are maps that would be better with OpenStreetMap but they’re built on something else. There are people who would be amazing mappers but they haven’t heard yet about the project.

To build a better map for everyone we need to do two things: connect OpenStreetMap to the problems people are trying to solve and do it at scale. We need to tap into existing networks where OpenStreetMap can play a valuable role and help them bring mapping to their members. At our conferences we’ve already seen the start of this. Specifically, we’ve had increased engagement by actors from education, civic hacking and local government who all maintain strong nation-wide networks down to the local level that we should use to bring OpenStreetMap to people.

In the next year I want to work with everyone on the board and the community to strap on the rocket boosters and reach more people by connecting us with networks who’ve already started using OpenStreetMap. We should do this by both strengthening our local communities for local outreach and actively building relationships with national networks. We need to make using and contributing to OpenStreetMap incredibly straightforward and actionable in very specific contexts. This will involve training programs, mini grants, mapping events, bringing OpenStreetMap to other conferences and more measures we yet need to discover.

Join and vote!

I hope I have your vote for this endeavour at this year’s OpenStreetMap US elections and I’d like to invite you to join in building these networks. If you have ideas on what’s needed to build a better map and a better community, I would love to hear from you here on the comment thread or just drop me an email.

If you’re not a member yet - you can sign up before October 18th and still vote!

The annual OpenStreetMap conference is coming up next week June 6–8 in New York City — over on medium I wrote up the topics I will be paying attention to.

You can still register for the event until June 1st: http://stateofthemap.us/

Hope to see you in New York City!

Location: United Nations, Manhattan, New York County, New York, United States

Our partners at the United Nations shared in today’s blog post on OpenStreetMap.us what excites them about hosting this years’ State of the Map US:

“Many of the benefits that OpenStreetMap offers are issues that are close to the heart of the United Nations: to empower nations and individual citizens, to facilitate economic progress and to create a level playing field where all have access to accurate and up-to-date information. OpenStreetMap is already being used by the UN in disaster management and emergency response and there are many more fields where it could provide great value.”

I would love to see you at the conference http://stateofthemap.us/

Location: United Nations, Manhattan, New York County, New York, United States

Mapping with Mexico's new open data

Posted by lxbarth on 13 February 2015 in English.

The Mexican statistical institute INEGI opened their data last November, terms are now compatible with OpenStreetMap. My colleague Rub21 has rendered out a first layer for mapping - take a look at our blog.

Mapear con los nuevos datos abiertos de México

En Noviembre el Instituto de Estadística y Geografía de México (INEGI) abrió sus datos. Los nuevos términos son compatibles con OpenStreetMap.

Mi colega Rub21 acaba de crear una capa para mapear - échale una mirada en nuestro blog.

Red Nacional de Carreteras de INEGI

Location: 06080, Mexico

The energy at the first OpenStreetMap class in Ayacucho, Peru was amazing. We had about 40+ students come out to learn how to map. This is all part of our effort to build local community in this city of 150,000 in the Andes where Development Seed, (the company that launched Mapbox) was founded and where today we have a growing team of OpenStreetMap data analysts.

Read more about our goals for Ayacucho on our blog in English and on Ruben’s diary in Spanish.

OpenStreetMap class at the University of Ayacucho.

Location: Urbanización Cercado, Ayacucho, Province of Huamanga, Ayacucho, 05001, Peru

Bengaluru ♥ OpenStreetMap

Posted by lxbarth on 23 November 2014 in English.

I had a fantastic week in Bengaluru the amazing tech hub in India’s south with Shiv and Eric connecting with startups, NGOs, data geeks and geo community. We were part of an OpenStreetMap Geo BLR meetup and the #osmegeoweek mapping party and the turnout for both events was great. We had fun rigging rickshaws with Mapillary and we met inspiring mappers like PlaneMad and NGOs like Kalike mapping rural areas on OpenStreetMap.

Watch India, the map is growing fast! Good places to connect are the India mailing list, the Datameet Google group and in Bengaluru specifically, the GeoBLR meetup group

Geohacker presenting how the Moabi project uses OpenStreetMap software to track forest health in the Democratic Republic of Congo.

Great crowd at the GeoBLR meetup hosted at the Centre for Internet and Society.

Getting hands on with OpenStreetMap tools.

Intros at the OpenStreetMap mapping party.

Rickshaw mapping with Mapillary - here’s the track.

Location: Sampangiram Nagar Ward, East Zone, Bengaluru, Bangalore North, Bengaluru Urban District, Karnataka, 560042, India

OpenStreetMap this week in Bengaluru

Posted by lxbarth on 17 November 2014 in English.

If you’re in Bengaluru this week, here are two events you shouldn’t miss:

I will be at both events with my colleagues Shiv and Eric - looking forward to catching up!

On Lazar Road heading towards Coxtown Circle, Bengaluru

Location: Lazar Layout, Bengaluru, Bangalore North, Bengaluru Urban, Karnataka, 560084, India

Attendees of State of the Map in Buenos Aires this weekend may have noticed how Buenos Aires’ villas de miseria - poor precarious neighborhoods - are well mapped on OpenStreetMap.

It’s a great example of how OpenStreetMap enables citizens to just create the map they need: The initiative Caminos de la Villa holds government accountable for public services in low income neighborhoods. The problem was, when the program started, Buenos Aires’ villas weren’t on any digital map. So the teams behind Caminos, the Argentinan technology non-profit Wingu and the social justice group ACIJ rallied a group of locals and put five villas with a total of 27,000 families on the map.

Over the course of 6 months they spent a total of three weeks tracing and surveying the five villas. The result is 638 ways and 102 points of interest added. This was tremendously useful work done in an incredibly short amount of time.

Villa 21-24 / Zavaleta in Buenos Aires before and after the Caminos de la Villa mapping initiative. Source: OpenStreetMap contributors, Asociación Civil por la Igualdad y la Justicia (ACIJ)

Villa 21-24 / Zavaleta is Buenos Aires’ biggest villa with over 40,000 inhabitants. (Mapbox / Digital Globe imagery).

Caminos de la Villa holds government accountable for public services - with OpenStreetMap.

Location: Villa 21-24, Barracas, Buenos Aires, Comuna 4, Autonomous City of Buenos Aires, Argentina

The trouble with the ODbL - summarized

Posted by lxbarth on 28 October 2014 in English.

Kevin Pomfret from the Centre of Spatial Law just published The ODbL and OpenStreetMap: Analysis and Use Cases a white paper reviewing pain points in the ODbL - OpenStreetMap’s current license.

2.5 billion OpenStreetMap nodes!

The paper provides a comprehensive review of issues broached in talks at State of the Map US (More Open, OpenStreetMap Data in Production) and State of the Map EU (The State of the License) and discussions thereafter. It offers an assessment of legal risks and includes a series of case studies focusing on legitimate use cases of OpenStreetMap that are currently impeded or complicated by the ODbL. At both State of the Map conferences I have heard requests from the Licensing Working Group, the OpenStreetMap Foundation board and others for a more solid summary of problems and actual real world use cases that are impeded by the license. This is why over here at Mapbox we have supported the Centre of Spatial Law to compile this white paper.

Here’s an overview of issues identified by the paper in order of appearance in the ODbL license:

  1. License does not cover contents - the ODbL covers the database, but not its contents. OpenStreetMap does not make clear under what conditions the actual contents of the OpenStreetMap database are available.
  2. Rights of contributors is uncertain - neither the ODbL nor the Contributor Terms protect a licensee from third party intellectual property claims. Note that a third party here is not limited to contributors, but would also include parties whose data has been imported to OpenStreetMap.
  3. Uncertain if and to what extent “share-alike” applies - the delineation between Produced Work and Derived Database is fuzzy and the crucial concept of Substantial is entirely undefined. This makes the extent to which share-alike applies to data that is combined with OpenStreetMap data guesswork.
  4. Uncertainty as to which jurisdiction’s law applies - the ODbL states it will be governed by the laws of the relevant jurisdiction in which the License terms are sought to be enforced. - the global nature of OpenStreetMap together with (1) makes it unpredictable as to in which jurisdictions to expect claims.
  5. Lack of a cure period for a breach - there’s no grace period to make amends. If you’re in breach of the license you have to stop using it right away.
  6. Unclear governance - there is no authority to ask for definitive clarifications around the license. When posing questions on related mailing lists or the OpenStreetMap Foundation the standing practice is to defer to license interpretation and non-existing case law.

The paper’s case studies illustrate how potential OpenStreetMap users don’t use OpenStreetMap at all - or not to the extent they could - due to the problems outlined above. This is a crucial issue - we’re not a community of givers on the one side and takers on the other, there’s a large overlap between data users and data contributors and the more we can get OpenStreetMap used in the real world, the more exposure we have to potential contributors, the more contributors we’ll have.

Here are some of the case studies:

Yale University does not use OpenStreetMap in research under HIPAA or similar privacy regimens because of concerns that ODbL’s share alike provisions could force researchers to open sensitive data - for instance when geocoding research data with OpenStreetMap data. This example highlights the issues with share alike (3) but also with governance (6). Some of the concerns expressed by Yale may be based on a conservative reading of the ODbL, but the absence of license governance in OpenStreetMap (6) and the understandable desire to avoid any risk of violating federal law rule out OpenStreetMap as an option where it should be a prime candidate.

As the Wikimedia Foundation is exploring opportunities to integrate tighter with OpenStreetMap they are running into incompatibilities between Wikipedia’s CC-BY-SA license, Wikidata’s CC0 license and the OpenStreetMap’s ODbL. It should be a no brainer that OpenStreetMap and Wikipedia should work as close as possible with each other for the benefit of both projects. Maybe a good real world use case we can get all moving on?

Foursquare is not using OpenStreetMap for reverse geocoding where they could due to concerns about share-alike extending to Foursquare data. Foursquare has been an awesome engine for driving people to become contributors and they show willingness to contribute data but can’t commit if the extent of the commitment is not clear. This is a great example of where we’re loosing out on contributions with a license that tries to take it all. To hear it directly from the source, listen to Dave Blackman’s talk at State of the Map US.

The National Park Service is working on standing up their own OpenStreetMap like service where they could otherwise use OpenStreetMap directly to power Park Service maps. This is due to the fact that OpenStreetMap’s share alike provisions are not compatible with the National Park Service’s policy to keep their data in the public domain.

What next?

For a full read of the white paper, head over to the Centre for Spatial Law blog.

The annual open data conference AbreLatam / Condatos last week in Mexico City gathered for the first time the Latin American OpenStreetMap community. The OpenStreetMap track Conmapas connected people who’ve been working alongside in Latin America virtually for sometimes more than five years, and also drew in a huge crowd of city planners, activists, hackers, and map lovers who came to learn everything about OpenStreetMap.

This was a highly timely event in a year with heightened activity in Latin America’s OpenStreetMap community and just a month from the annual OpenStreetMap conference State of the Map this year to take place in Buenos Aires from November 7th - 9th.

Here are some highlights of the event:

The morning was all talks and a panel about the growth of OpenStreetMap. We spent the afternoon with workshops and hacking on maps, editing OpenStreetMap, map making and opening data. You can read up on the full #conmapas program on the conference web site.

Mati Karwil and Aure Moser presented Bikestorming, an initiative to make cities world wide more bike friendly by providing more information about existing bike infrastructure using OpenStreetMap.

Thiago Santos described how he unlocked many dozens of PDFs from the Brazilian statistical institute IBGE. Here he’s bribing attendees with chocolate to come out for his afternoon workshop to open Mexican INEGI data for OpenStreetMap. Without need as it turned out :)

Mayeli Sánchez Martínez from Proyecto Poder presented her work tracking extractive industry activities together with the Geoinquietos group.

Humberto Yances from Colombia with the Humantarian OpenStreetMap Team and the web service provider Náritas explained how he uses and contributes to OpenStreetMap both for the social good and as a private business.

Isaac Pérez-Serrano and Daniel Perez Tello from the Laboratorio para la Ciudad in Mexico City presented the lab’s upcoming participatory mapping initiatives.

Pierre Béland from the Humanitarian OpenStreetMap team made a call to map before disasters strike.

Marcelo Aliaga from OpenStreetMap Chile and then Chilean presidency walked through how OpenStreetMap became big in Chile and how the initiatives of the Chilean OpenStreetMap chapter.

Paul Goodman from the Mapbox team gave a walk through of mapping with drones.

See a full map of our three drone mapping missions in Mexico City

I loved the presentations at the open mapping panel together with Pierre Beland (Humanitarian OpenStreetMap Team), Gerardo Esperza (INEGI), Ives Rocha (Centro de Promoção de Saúde), about the benefits of OpenStreetMap for community mapping and government. Highlight: Gerardo Esperza from INEGI reiterated their data was available for OpenStreetMap. Now let’s work on using that data!

At Conmapas core OpenStreetMap contributors from Latin America met each other for the first time in real life. Attendees from Argentina, Brazil, Colombia, Mexico, Nicaragua devised ways of working closer with each other. Concrete outcome: a new, much needed coordination channel for Latin America and many ideas on how to build stronger networks in Latin America.

To be continued

This Latin American network is just getting started. Join in and continue the conversation at State of the Map in Argentina.

Thank you

A big, big thank you to everyone who made this possible: Jorge Soto, Ania Calderón, Alejandra Ruiz and Rodolfo Wilhelmy of the Mexican presidency. Without the support of the Mexican presidency in terms of logistics and funding, this event would not have been possible. In addition to the presidency, Gabriella Gomez Mont, Stalin Muñoz, Jaime Quintanar, Lupita Gonzales of the Laboratorio para la ciudad were of amazing help coordinating locations for flying mapping drones in Mexico City. And last but not least, a huge thank you to all speakers for putting together an amazing program. Here’s to more!

Photos: Vitor George, Humberto Yances, Paul Goodman, Eric Gundersen.

Location: 03310, Mexico

Vote today. OpenStreetMap US elections are open now. You can vote until October 12th. If you are an OpenStreetMap US member, you have a ballot in your inbox. If you’re not you can become one in minutes and still vote.

I’m running for re-election to the the OpenStreetMap US board to expand OpenStreetMap US as a convening organization for everyone.

Over my past two years on the board, we have doubled the size of the State of the Map US conference, expanded its appeal to non-traditional audiences, increased diversity with scholarships and a distinct cross-audience appeal, and supported over 70 mapathon events that you all have helped organize.

OpenStreetMap is about the combination of the community: individual mappers and businesses and the humanitarian community and governments. We will succeed even more if we make an even more open community for everyone to collaborate. Working with Martijn, John, Jim, Kathleen, Mele, and Ian has been incredibly rewarding and I’d like to continue this into a third year.

To create a better map, we need to continue to expand OpenStreetMap beyond its current limits to communities we’re not talking to yet. We need to bring OpenStreetMap to a broader set of industries, organizations, and communities. This is also the key for creating more diversity in terms of gender, global presence and ethnicity. To become more diverse as a community we have to grow in numbers.

The key tool to accomplish these goals is the annual State of the Map US conference. I am looking forward to further hone this conference as a space for everyone to come together and share their vision for OpenStreetMap and for newcomers to become part of the community. OpenStreetMap is about bringing the community together and bringing new people into the community. This includes a continued international appeal. We are playing an important role to bring international community members to the US to meet with them and to discuss core OpenStreetMap improvements but also help grow OpenStreetMap internationally.

Lastly, I don’t want to finish my note without this appeal: If you care about OpenStreetMap you should run. Never think that to be on the board of OpenStreetMap you need to fill some sort of profile. Whether you’re an individual mapper, whether you’re a teacher or business person or use OpenStreetMap at your nonprofit, whether you’re famous on the mailing lists or whether you just opened your first OpenStreetMap account last week. Put your hat in the ring and help OpenStreetMap grow in the US and beyond!

I would love your vote on October 4th. To participate, all you need to do is become a member. You can do so now, in just a minute. Find a full list of all candidates on the OpenStreetMap Wiki.

The Mapbox OpenStreetMap Data Team Guidelines

Posted by lxbarth on 19 September 2014 in English. Last updated on 13 October 2014.

Earlier this week Danny and Richman joined our growing data team. Alongside Ruben, Edith and Luis they will help us here at Mapbox contribute even more and better improvements to OpenStreetMap. With our data team up to five full-time members, we can redouble efforts on projects like tracing all of San Francisco’s buildings, fixing massive amounts of TIGER misalignments and importing 1 million New York City buildings. This is a huge step up in our ability to contribute data and give back directly to the community. To make this work, we’re creating public guidelines that ensure our involvement is positive for OpenStreetMap as a community and as a map.

Updates to TIGER roads in US by Mapbox data team

In addition to the rules that apply to everyone in the community, here are the guidelines we want to reiterate and add for ourselves:

  1. We listen to community. We are looking for your feedback on how to make a better map. Get in touch with any of our data team members. For general feedback drop aaronlidman or me a line.
  2. Quality is paramount. We hold ourselves to the highest mapping standards as documented on the Wiki or as established as common practice in the community.
  3. Local knowledge first. Where in any doubt, the locally surveyed information prevails over remote updates.
  4. We disclose all ongoing mapping efforts on the OpenStreetMap Wiki.
  5. All full time data team members will be listed OpenStreetMap Wiki and identified on their user profiles.
  6. Where possible we use public tools for coordinating work, allowing anyone in the community to participate.

You can find these guides on our Wiki page. Let me know what you think of them, and what we could do better.

Here’s to making the best map in the world!

As of June, New York City buildings and addresses have been fully imported to OpenStreetMap. While we are tackling remaining cleanup tasks I wanted to share a full recap of the effort. I am very happy with the overall result. There are lessons to be learned here from what went well but also where we could have done better - read on for the details.

More than 20 people - volunteers and members of the Mapbox team - spent more than 1,500 hours writing proposals, discussing, programming, uploading, processing and reviewing. Between September 2013 and June 2014 we imported 1 million buildings and over 900,000 addresses. We fixed over 5,000 unrelated map issues along the way.

Here are screenshots of the resulting work:

Building coverage on Manhattan island, the southern tip of the Bronx to the northwest and Wards island to the right.

====

JFK airport buildings in Queens, bordering on the Hamilton Beach neighborhood to the left and South Ozone Park to the north.

====

Coverage around Battery Park and Wall Street in Manhattan. This is an area that already had many buildings. We filled in the gaps and replaced buildings where the New York City data set was clearly better.

====

We imported over 900,000 addresses. Here is an example of the Park Slope neighborhood in Brooklyn.

====

Buildings contain height information and render nicely as seen here on this example of downtown Brooklyn on Fmap.

====

The import covers all of New York City’s five boroughs

====

Overview

This is a full writeup sharing my experience with the New York City import in the hope that there is one or the other valuable lesson, good idea, or line of code for you to walk away with. Note that this post is very specific to the work in New York City. If you’re planning to do an import, make sure to check out the Import Guidelines for a more universal checklist of how to go about imports.

If you’re looking for the 30 seconds version, I’d summarize my take aways like this:

  • Importing is a lot of work, make sure you have the time to commit.
  • Be prepared to continuously improve your conversion scripts and already uploaded data throughout the import.
  • Importing is a skill. It looks easy at first, but everyone involved uploading will need proper support, advanced knowledge of mapping practices and data validation by peers.
  • Involve community where possible, clear and frequent communication is clutch.
  • Invest in your tools

Read on for the deep dive.

OpenStreetMap as a collaboration space for citizens and government

Using New York City’s data for OpenStreetMap became possible thanks to the then-mayor Michael Bloomberg’s open data policy. Local Law 11 of 2012, releases all New York City government data “without any registration requirement, license requirement or restrictions on their use” (23-502 d). This effectively puts the data in the public domain, making it compatible with OpenStreetMap’s contributor terms.

Both, address point data and building data fall under this law and are available for download on New York City’s open data web site:

The way we used this data in OpenStreetMap is an illustration of how Bloomberg’s plan to stimulate the economy with open data is starting to pay off. This data in OpenStreetMap is now benefiting everyone using OpenStreetMap and this includes the New York City based startup Foursquare which is using OpenStreetMap data on its Mapbox powered maps.

But the relationship between OpenStreetMap and New York City should be ideally a two way street. How can the creator and maintainer of the building and address datasets - New York City’s GIS department - benefit directly from their work being imported in OpenStreetMap? The vision of edits in OpenStreetMap directly helping improve a crucial government dataset is very promising. OpenStreetMap is a unique data collaboration platform while datasets like building or address catalogs are incredibly hard to maintain - even for a large municipal government like New York’s. How can government become a part of OpenStreetMap?

OpenStreetMap’s share alike license means that OpenStreetMap data can’t be taken over directly into New York City public domain datasets but we can use OpenStreetMap to find out where changes happened. We set up a daily change feed flagging modifications to buildings and addresses to subscribers. Here’s a copy of a change notification email how New York City GIS receives it every day:

Daily change notifications from OpenStreetMap, flagging building and address changes to New York City government.

The notification contains a list of relevant changesets from the previous day with a link to each modified building and address. We are right now assessing the utility of these emails. Another way of leveraging OpenStreetMap as a change signal would be to periodically extract all building and address data and identify all changes in a certain time frame at once.

All code powering the change feed is available as open source on Github. If you’d like to receive the New York City change feed notifications, please let me know. Happy to subscribe you.

Import procedure

To import New York City data we had to convert it to OpenStreetMap format first and cut it into byte size chunks so we could review and import it manually, piece by piece. Once it was imported, a different person than the original importer would validate the data. This means reviewing it for errors and cleaning it up where needed.

Selecting a task on the tasking manager, opening existing OpenStreetMap data and opening importing data in JOSM.

Each participant would set up their workspace according to documentation we provided on Github. In the same document we laid out the actual import procedure. Some of the key items of the import procedure were:

  • Use a separate import account
  • Run full JOSM validation, fix all conflicts with existing data
  • But also fix all existing unrelated issues in area
  • Spot check data - for instance, do street names line up?
  • Merge POIs where appropriate
  • In case of duplicate data, keep the best data if there is a clear difference. In case of any doubt, keep the local data.
  • Add a note where a local mapper could solve a problem

As we imported, we ran into a series of recurring issues that we shared in a common issues guide - a useful resource for training new mappers and agreeing on fixes for unclear situations.

Community import or not?

From the beginning, the import was planned as a community import. There is no standing definition of this practice, but the rough idea is that uploads to the map would be done predominantly by members of local community familiar with the areas uploaded. Once started into the import, we quickly ran into a series of issues.

For Mapbox data team members participating in the import full time it was very easy to outpace local volunteers by a huge factor. In addition, I underestimated the complexity of the actual review and upload work. While not hard, there was a certain learning curve which meant that every new individual joining required significant training and support to get started - which meant plain and simple time that someone had to spend. Add to this that the individual time commitment is huge. I estimate we spent about 1,500 hours among everyone involved - and this is on the conservative side. Assuming 20 people work on the import, each one of them would look at 75 hours on this project. Very few people spend this much time on OpenStreetMap in a year.

The pace of uploads turned out to be key friction point. At the same time a series of data quality issues arose. This is why a couple of months into the import the loosely formed group around the project including community members and myself decided to pause the import and when we restarted a month later, slow it down and stop billing it as a community import. This would allow everyone to participate better and it would set expectations straight as to who was doing the uploading work. I think this adjustment was a good one. Overall it took us 10 months to get the job done - longer than I thought but still a pace that I was comfortable with to commit help finish the job. In the end a vast majority of uploads, validations and programmatic updates were done by the Mapbox team and I’m glad we had the opportunity to contribute.

Still, community involvement was clutch. The incredible input everyone gave, the many reviews, advice and personal time people invested was crucial to make this import a success. Everyone weighing in has helped make the resulting map better.

Sh** happens

We dealt with data corruption and conversion script bugs all using Github issues. Over the course of the import, we opened and closed 120 issues flagging suspicious data found in data reviews and sometimes working through protracted problems with New York City’s head of GIS directly chiming in and helping interpret data correctly.

Some of the issues we discovered required updates to data we already imported. Once we were into the import even a couple of days, updating existing data manually quickly wasn’t an option anymore. This is where automated edits came in, updating OpenStreetMap data programmatically. We captured all scripts for automated edits in the same code repository as the data conversion scripts. Some examples of programmatic updates are:

  • We fixed wrong tagging on school buildings where we tagged amenity=school instead of building=school.
  • We added ordinal suffixes like “th” in “4th”.
  • We expanded abbreviations we had overlooked like “Ft” to “Fort”.

We prepared this import well and we had good peer reviews on the imports list running up to the first uploads. We could head off many issues before we started importing. But in the end, the amount of issues we encountered after we started was still an unpleasant surprise. Having gained a lot more experience with this import I am sure the next time we can avoid a series of pitfalls - but the need for being able to programmatically update data after it’s been uploaded is crucial for a successful import. You simply cannot plan for all eventualities and you need to be prepared to apply fixes as you go.

From this perspective, the next time I would want us to write data integrity tests from the get go. These tests would assert data quality on data before it is uploaded. This would allow us to be much more agile in updating and refactoring conversion scripts as we go.

Another set of tests would assert data quality of already uploaded data. This would help to identify existing systematic problems and catch data issues due to negligent uploads fast.

So far, we have a rudimentary directory with validation scripts we started to build up during the import. There is a real need across the OpenStreetMap community to further develop and share easy to use tools to test and validate data. What if we could reuse the validators available in JOSM from the command line on arbitrary portions of OpenStreetMap data?

Data processing

To get source data ready for upload, a conversion script would download the data, split it, convert it and store the resulting files in OSM XML format on Amazon S3. We set up a tasking manager job that would expose each file as a task for people to import. To upload a dataset, a mapper would select a task, download OpenStreetMap data and load OSM data. We used the excellent JOSM editor to merge and review data before uploading to OpenStreetMap.

The entire data processing script is captured in a Makefile and can be run from download to upload to Amazon S3 with a single command. In sequence, the processing script would perform the following actions:

  • Download and unpack buildings (polygon data in shapefile format)
  • Download and unpack addresses (point data in shapefile format)
  • Reproject and simplify building geometries
  • Reproject addresses
  • Split buildings and addresses into byte size chunks
  • Merge: Where only a single address is available for a building, merge the address attributes onto the building polygon.
  • Convert: Map attributes to OpenStreetMap tags, convert street name formatting and house number formatting and export in osm format
  • Put to S3

All code is open source under a permissive BSD license - feel free to lift where convenient.

Repeatable conversion

The conversion script is repeatable with a single command and it is organized in stages: Each significant processing step creates files on disk and can be run separately. All that’s needed are the output files of the previous processing stage. Running the entire script would take on the order of several hours on an extra large Amazon EC2 instance. Being able to run steps like the merge stage or the convert stage separately was saving important debugging time. Throughout the import, we wound up reprocessing the data countless times as we fixed issues.

# Download, convert and push to s3
make && ./puts3.sh

# Download and expand all files, reproject
make download

# Chunk address and building files by district
make chunks

# Generate importable .osm files.
# This will populate the osm/ directory with one .osm file per
# NYC election district.
make osm

# Clean up all intermediary files:
make clean

# Put to s3
./puts3.sh

# For testing it's useful to convert just a single district.
# For instance, convert election district 65001:
make merged # Will take a while
python convert.py merged/buildings-addresses-65001.geojson # Very fast

Reprojecting and simplifying

New York City data comes in its own special projection and it is way too detailed for OpenStreetMap, so we reprojected and simplified it using ogr2ogr:

ogr2ogr -simplify 0.2 -t_srs EPSG:4326 -overwrite buildings/buildings.shp buildings/building_0913.shp

Splitting into byte size chunks

We couldn’t upload all data in one go, it had to be cut into byte size chunks for manual review and upload. For splitting up the data we used New York City voting districts. This was an arbitrary choice, it just so happens that New York City voting districts are of a manageable size for manual uploads. There are 5,285 voting districts, the processing script generated an OSM file for manual upload for each one of them. The script chunk.py uses the great Shapely and Fiona libraries for doing this. It is nicely reusable for any task where you need to split up one geospatial dataset by the polygons of another geospatial dataset.

Merging

In OpenStreetMap, addresses tend to be merged onto building polygons where only one address is available for the building. We wanted to follow this convention and thus merged addresses where only one was available onto the corresponding building. The python script merge.py uses Shapely, Fiona and Rtree to do this. The script also converts data into geojson format - which was extremely useful for debugging as we could inspect them in any text editor. Here is an example output file of the merge stage.

Most of our fixes during the import happened on later stages so we could always work off of the merged files, saving about 50% of the total processing time.

Conversion

This is where most of the actual conversion is happening - this is also the part of the script that was the most significant time investment. It captures the full complexity of the conversion and handles hairy problems like house number conversion, street name conversion, cleanly merging geometries, generating multipolygons and more. The script convert.py uses Shapely and lxml for attribute mapping and exporting data in OSM XML format. OSM XML is directly readable by JOSM, so the resulting files of this stage could be opened and directly uploaded to OpenStreetMap with JOSM.

One tricky problem we’re solving on this stage is merging T-intersections. OpenStreetMap’s data model is unique in that it allows for sharing vertices between polygons. In the picture below, you see a typical T intersection. The node with the arrow is supposed to be part of the two ways describing the corner of one building but also part of the ways describing the straight walls of the other building.

It took us a while into the import to notice unmerged T-intersections. What makes this issue vexing is that OpenStreetMap’s native decimal precision is lower than our source data. The result was that data we uploaded to OpenStreetMap looked fine, but once we downloaded it again it came back with truncated precision, moving nodes just far enough to place some within neighboring buildings.

Nodes on T-intersections between buildings need to be part of both buildings.

Our conversion script merges all incidents of T-intersections. This requires truncating decimal point precision to OpenStreetMap’s native 7 positions and buffering - the technique to test not only whether a point sits on a line, but whether a point is in the close vicinity of a line. Read up on appendBuilding() in convert.py for details.

Pushing to S3 and exposing the data in the tasking manager

For exposing tasks to mappers we used the OSM Tasking Manager - a great tool for coordinating mapping tasks among large groups of individuals. We used a patched version that allows for tasks shaped as arbitrary polygons - instead of the usual squares. Each task polygon pointed to the file we’ve made available on s3, and the tasking manager exposed two buttons: one for loading OpenStreetMap data into JOSM, the other one for loading the import data into JOSM. We labeled those buttons “JOSM” and “.osm” which doesn’t make all too much sense, but hey!

Loading data into JOSM from the tasking manager.

Reusing and the elusive import toolchain

Writing these scripts we avoided overthinking the problem. Creating generalized solutions for these functionalities is hard and we simply didn’t have enough data points to do so. Now having gone through this import, I see a couple of opportunities to solidify a toolchain for import:

  • Generalize a command line script for splitting data (like a properly abstracted chunk.py)
  • Generalize a library for converting Simple Features to the OpenStreetMap data model, including XML export
  • Consider using PostGIS - I avoided it intentionally here, but built in spatial operations and indexing is appealing
  • Identify a pattern for reusable validation scripts that can be used to assert data quality before and after uploads

Continuously improving the map

Here is the full time line of the import:

We are not done yet. While all data has been imported to OpenStreetMap, there are final cleanup tasks we are tackling as we speak. Help us further improve the map: if you find a building or address related issue on the New York City map, please let us know by filling an issue on Github. As soon as new data is available from New York City, we will also take a look at updating OpenStreetMap where it makes sense.

Thank you

Huge thanks to all who have helped make this import happen. Through your work reviewing, coding, organizing mapping parties and doing data uploads you have helped make this import better than it would have been without you: Serge Wroclawski, Liz Barry, Eric Brelsford, Toby Murray, Ian Dees, Paul Norman, Frederick Ramm, Chris MacNally, and many others. A special thanks to Colin Reilly from New York City GIS who has helped on many occasions fully understand the source data and find the best decision translating it to OpenStreetMap. A big shout out to my colleagues who’ve put a ton of work into this endeavour: Ruben Lopez, Edith Quispe, Aaaron Lidman, Matt Greene, and Tom Macwright among others. Say hello if you bump into them on the internet, or maybe at one of the next conferences.

Cheers to making the best map in the world.

Location: Manhattan Community Board 3, Manhattan, New York County, New York, United States

Connecting Communities With Improved OpenStreetMap Credits on Mapbox Maps

Posted by lxbarth on 10 May 2014 in English. Last updated on 10 June 2014.

We’re updating attribution for OpenStreetMap-based Mapbox maps thanks to feedback on attribution conventions here on the diary and on mailing lists. The new convention on Mapbox maps is to expand attribution by default: collapsed attribution should only be used when attribution becomes unusually long, or screen space is limited. Expect us to roll out these changes over the next couple of weeks, but here is a preview right away.

The entire goal of the Mapbox team’s work with OpenStreetMap is to help make OpenStreetMap the best map, everywhere in the world. We will only be able to achieve this as a community and with open data. Linking maps back to OpenStreetMap is at the heart of growing OpenStreetMap by helping turn map consumers into map contributors. Our goal with these new attribution conventions is only to further improve the connection of the many million users who view Mapbox maps every day to OpenStreetMap.

Here are the new attribution recommendations for all Mapbox maps that are based on OpenStreetMap data.

Expanded attribution

While collapsed attribution wrapped in an info - ⓘ - symbol, works well on small screens, we are now recommending to expand attribution whereever possible. The full attribution line is “© Mapbox © OpenStreetMap” and next to it we recommend an “Improve this map” link leading a user to editing on OpenStreetMap. Another change is that now “© OpenStreetMap” links directly to http://www.openstreetmap.org/copyright, “© Mapbox” continues to link to http://mapbox.com/about/maps listing the full roster of map data we’re using including OpenStreetMap.

Recommended attribution on Mapbox maps. Click to explore.

Collapsed for small maps

We’re recommending this form of attribution for small slippy maps. Here’s an example:

Recommended attribution on small slippy Mapbox maps. Click to explore.

Use these attributions now

Until these attribution recommendations are rolled out on Mapbox.com, here are links to code snippets that already work today:

Attributing OpenStreetMap

Posted by lxbarth on 30 April 2014 in English. Last updated on 10 May 2014.

Updated attribution recommendations for Mapbox maps: http://www.openstreetmap.org/user/lxbarth/diary/21847

Showing how OpenStreetMap is a living map, and making it easy to start mapping is the first step to turn someone from passively looking at a map into improving the map. It’s part of spreading the word and building our community. At Mapbox we power OpenStreetMap based maps to hundreds of millions of people, and this gives us a unique opportunity to connect them to OpenStreetMap and turn people from being passive map consumers into active map contributors. Driving contributors to OpenStreetMap is a key goal we pursue not only with attribution but also in our aggressive launch communications around prominent new customers.

Our goal is to feature OpenStreetMap to help grow the community - attribution plays a key role in this.

Attributing OpenStreetMap based Mapbox maps

For the web, at Mapbox we recommend the following two variations for attributing OpenStreetMap:

Attribution in collapsible info control

Same attribution as above but expanded

In both cases (c) Mapbox (c) OpenStreetMap links to https://www.mapbox.com/about/maps with a full listing of all sources. Improve this map links to a map feedback page that explains how the map viewed is based on OpenStreetMap and how OpenStreetMap can be improved by anybody. The map feedback page is smart and shows a) the exact map you came from and b) places you into OpenStreetMap exactly where you left the map so you know where to start mapping. It has an option to skip the map-feedback page the next time you click Improve this map and take you directly to OpenStreetMap.

Map feedback page

Maps made of many sources

Mapbox maps are made up from a multitude of sources, here are some of our main sources:

  • OpenStreetMap
  • Digital Globe
  • NASA MODIS, Landsat, SRTM
  • USDA NAIP
  • l’Institut national de l’information géographique et forestière
  • Canadian government
  • The National Land Survey of Finland Topographic Database
  • Norwegian Mapping Authority
  • Ordnance Survey data
  • INEGI
  • Geodatastyrelsen
  • DHM / Terrain
  • The National Dynamic Land Cover Dataset
  • Custom data added to map

This list is only growing as the source composition of our maps gets more complex. So the string (c) Mapbox (c) OpenStreetMap is crediting the map engine and design (Mapbox) and one of the most prominent data provider (OpenStreetMap) but it is also functioning as a placeholder that basically says “Attribution”. This is why we link this string to https://www.mapbox.com/about/maps that contains the full list of all data. For related reasons, I also typically recommend using the collapsible info control over the expanded string on the map as it allows us in the future to add additional attributions into the map as needed without turning people’s maps into NASCARs. This is a good compromise between visibility, legal requirements and the need for screen space to grow.

Mapbox can be used with any kind of map library. So, ultimately we do not have control over a given maps attribution, but if you use Mapbox with our recommended libraries, attribution will show up as explained above, otherwise it is up to the developer to ensure appropriate attribution.

Improvements

We’re working to make this even better, and are planning to improve:

  • More granular attribution based on data actually in use on data (right now it’s one size fits all and we show this attribution as soon as you use any of streets/satellite/terrain data). A lot of Mapbox maps do not use OpenStreetMap but still want to associate proper attribution.
  • Allow third party users to sign into OpenStreetMap with the account they’re using on the map (think of signing into OpenStreetMap with your Foursquare account). We need to make it easier to let communities that start using OpenStreetMap become part of our community. This will have huge network effects. This will also take some work on the OSM.org side.
  • Map feedback also has an option to submit feedback as email, and have our team run point on edits, fully respecting privacy.
  • Share map feedback where it makes sense.

Examples

Here are two typical Mapbox powered maps with attribution (click to explore).

Mapbox Outdoors: OpenStreetMap, Ordnance Survey data, l’Institut national de l’information géographique et forestière, NASA SRTM, The National Dynamic Land Cover Dataset plus more.

InfoAmazonia maps: OpenStreetMap, NASA Modis, Landsat, Digital Globe, IBGE, InfoAmazonia.

This weekend, the quarterly US #editathon takes place in 10 US cities - read all about it on the OpenStreetMap US blog.

The #editathons are not just a great excuse to meet up with other OpenStreetMappers to push on projects, but also an opportunity to learn more about OpenStreetMap. In DC we’ll be hosting the #editathon in the Mapbox garage. It’s going to be great weather so expect some people to go outside and survey too. Read up on the Mapbox blog on how to find the Mapbox garage. Here’s a photo from last year’s event there:

Location: Logan Circle/Shaw, Ward 2, Washington, District of Columbia, United States

Hal Hudson from New Scientist wrote a great article on how OpenStreetMap helps Médicins Sans Frontières (MSF) fight Ebola in Guinea:

Online army helps map Guinea’s Ebola outbreak

He reports:

WHEN doctors working for Médecins Sans Frontières (MSF) arrived in the West African nation of Guinea last month to combat an outbreak of the deadly Ebola haemorrhagic fever, they found themselves working in an information vacuum.

MSF enlisted the help of the Humanitarian OpenStreetMap team (HOT) and within a few days, a huge number of mappers flocked to OpenStreetMap, putting the affected areas on the map. Where existing Bing imagery was not sufficient, Astrium and DigitalGlobe provided fresh takes.

Few days into the crisis Pierre Béland from the Humanitarian OpenStreetMap team shared numbers of this effort on the mailing list:

Even if this crisis is not in all the medias, the contribution from the OSM contributors is fantastic. In 8.5 days, 302 contributors, 1.2 million objects, 114,000 buildings, 5,000 places and 6,100 landuse polygons.

The New Scientist article explains how OpenStreetMap helps fight the virus:

Mathieu Soupart, who leads technical support for MSF operations, says his organisation started using the maps right away to pinpoint where infected people were coming from and work out how the virus, which had killed 95 people in Guinea when New Scientist went to press, is spreading. “Having very detailed maps with most of the buildings is very important, especially when working door to door, house by house,” he says. The maps also let MSF chase down rumours of infection in surrounding hamlets, allowing them to find their way through unfamiliar terrain.

Since the response to the Haiti earthquake we are now seeing time and again how OpenStreetMap is facilitating incredibly mapping of badly needed geo data, helping first line emergency responders do their work.

You can’t do this with any other map but OpenStreetMap.

This type of massive mapping effort is only possible because of OpenStreetMap allowing direct editing of data to anyone and the availability of OpenStreetMap as raw and open data. The former allows anyone to get involved in helping respond to a crisis, the latter gives full power to responding parties over how exactly maps should look like or access to raw data for analysis. No other map offers this level of openness at a global scale.

Join the effort mapping Guinea on the HOT tasking manager or by support MSF in responding to the crisis.

Cross posted to talk list

Effective immediately the Mapbox Satellite option in iD and JOSM is 100% open for tracing in OpenStreetMap, including all our high resolution DigitalGlobe imagery. This is full coverage down to zoom level 19 imagery in the US + Western Europe and world wide to zoom level 17.

To use this imagery select “Mapbox Satellite” from the imagery menu in iD on the web or in JOSM. Mapbox Satellite is open for tracing in OpenStreetMap in general and not tied to a specific editor, so if you would like to add Mapbox Satellite to another OpenStreetMap editor you are welcome to do so.

This is a big affirmation of DigitalGlobe’s commitment to provide imagery for OpenStreetMap (also Bing imagery contains to a very large degree DigitalGlobe material). Props to Kevin Bullock and our friends at DigitalGlobe - it’s fantastic working with good people who see wins of working with OpenStreetMap.

Digital Globe announcement

Editing in Washington DC with the Mapbox Satellite layer

PS - on an existing installation of JOSM you’ll have to refresh your imagery menu like so: http://cl.ly/image/383O2L0t431s