
Updated contributor stats
Posted by SimonPoole on 7 January 2018 in English. Last updated on 13 October 2018.I’ve updated, as every quarter, the statistics on our wiki.
One thing we can see on
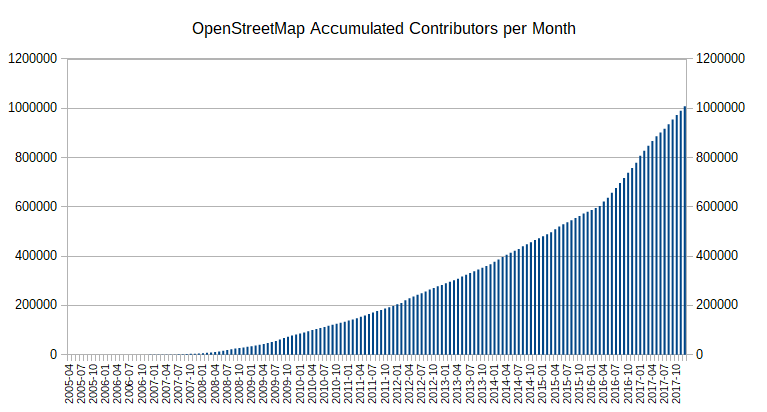
is what looks like growth flattening out.
Splitting out the new contributors from maps.me and other sources gives us the following graph:
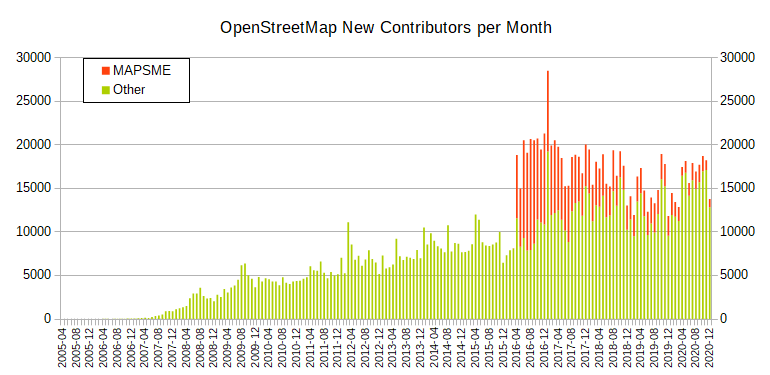
Which seems to show maps.me as a source of new editors declining (and other sources continuing to grow).
If we look at just the maps.me part, it becomes very clear:
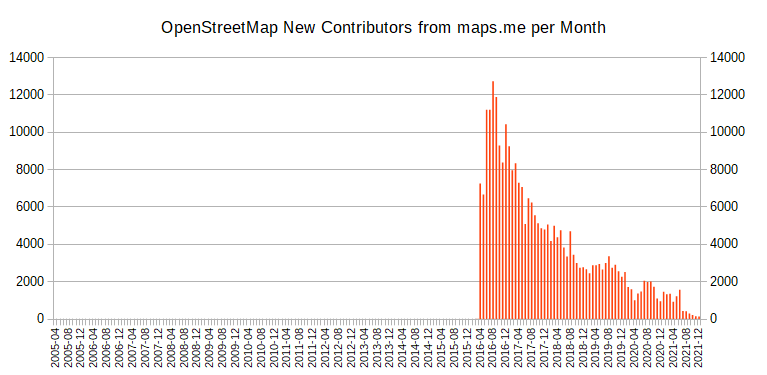
The trend is not really a surprise, maps.me had a large installed base when it first announced the editing feature and that was bound to lead to a burst of people trying it out in the beginning. Even though the rate of new contributors has dropped it is still at a very respectable ~20% of the total.
The overall graph without maps.me looks like:
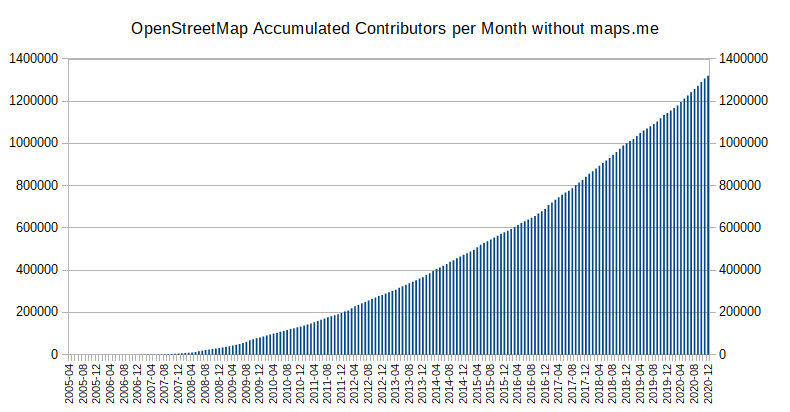
which continues to show a reassuring upward trend.
PS: yes we passed through 1’000’000 actual contributors to our map data on December the 14th, but explaining what that means and why there are numerous different metrics that can be considered that all differ a bit is a complicated thing.
Discussion