OpenStreetMap

MikeN's Diary

Recent diary entries

This is a random collection of thoughts from the last project of mapping a new area for emergency services.

  • In OSM there’s always a desire to work on areas with the largest audience, similar to commercial mapping companies’ ROI analysis. But that project shows that there is also a definite audience for fixing rural / lightly populated areas.
  • Even though the project boundary was defined by a ‘fire district’, the work in OSM was very traditional: just verify roads, add driveways, buildings and addresses to achieve the end result.
  • In 2017, we worked on neighboring Spartanburg county which has open data policies. We reviewed all roads and added buildings and addresses. Now that Amazon is creating all driveways, this effectively allows OSM routing to the doorway in that county also. Amazon is completing the “last mile mapping” for us there!
  • At some point, having a full set of driveways in the task area created a ‘hole’ in Amazon’s daily task list. This is a shot of one day’s driveway changesets in the area - nearly all from Amazon. The circled area is populated just as heavily as the area to the immediate right. Driveway mapping tasks not required in one area Did the Amazon delivery drivers notice a difference as the driveways and road network suddenly reflected reality?
  • A very typical experience when telling someone about OSM is that they will “Nominate” their own address and find that OSM lacks that address, road and/or neighborhood. I had a variation when one of the team looked up their address on Magic Earth: it found the location, but the house number was wrong. I tracked it back and the county’s source data was wrong so I could submit a bug report to the county GIS department.
  • OSM is often just a future concept: create enough data, and someone might find a use for it some day. And so we labor away like monks generating a jillion gigabytes of JSON. The FD project was unusual because someone had an immediate application for the data. Not only that, but now there’s immediate demand to expand the project - other FDs with similar geography would also benefit. If fact the FD noted in our meeting that they had just recently merged with the adjacent fire district to the north and were not familiar with the roads in that area so we have created a task manager task to expand their region of door to door routing.
  • This was my first experience comparing buildings over a time span: the Microsoft building set VS the current set 7 years later. I was surprised by the number of buildings that were no longer present in the later image.
  • In current imagery, I was surprised by the number of buildings now having solar panels VS 2012/2013.
  • Despite a number of MapRoulette TIGER challenges and comparison against state datasets, as well as randomly editing most of the county, I discovered this TIGER hairball which would have ruined navigation(“After” is the one with driveways) - the same area is shown below but the bottom one is on black background which is easier to see on some displays. Map comparison - traditional colors Map comparison - black background

It was a dark and stormy night

Posted by MikeN on 2 February 2020 in English. Last updated on 3 February 2020.

It was a dark and stormy night - no, not THAT dark and stormy night, but still a challenging situation! Imagine an emergency services reponder being tasked with rapidly finding a residence on an active call in an area of:

  • Appalachian Foothills with winding narrow roads
  • Rural dense / light suburban population density
  • Rainy spring / early summer leads to rapid landscape / vegetation growth, quickly obscuring mailbox location.
  • Tree covered and winding shared driveways several Km long - possibly lacking turnoff marking to individual houses. House is often not visible from the road.
  • Unmarked, unreadable, or non-reflective mailbox number markers.

Last year, this situation led the local Slater-Marietta Fire District (FD) to post not just one , but two pleas for people to pay attention to driveway entrance and house markings.

While the local OSM community was importing cell towers in a nearby county, one of the mappers who worked on cell towers at the time noted that driveways would be very useful because of similar problems: the tower might not be visible from the roadway, and no clear marking for the tiny access road would lead to the tower. That statement and seeing the “Amazon driveway project” come to our area gave me a project idea for that fire district: review all roads, create all driveways, and enter all addresses - then have the EMS use a standard OSM navigation app to get turn-by-turn directions to their destination.

A mapping colleague established a working relationship with the county - although they don’t have open data, they gave OSM permission and access to image layers for 6 inch off-leaf aerial imagery and roads and addresses. After opening up separate task manager tasks for roads and buildings , the area was eventually completed and ready for navigation.

BUT - finding apps that route up private driveways and past gates is a challenge. The standard OSM routers on the main page stop at private driveways. The BRouter web client was a useful tool to set up a custom routing profile and confirm that driveway navigation is effective. In apps, my choices were:

  • OSMAnd - excellent because immediate updates from OSM are possible. But the address search on the IOS version was ineffective. I wasn’t yet sure what equipment the local FD would be using, so I didn’t want to count on using OSMAnd.
  • Magic Earth - supports IOS and Android and calculates routes up private driveways. Looked like it would work, but can’t determine the data update rate. Also it’s not clear what the options “OSM Mode” and “Debug Mode” do. There’s an Email contact for support but no user forum.
  • Maps.me - supports IOS and Andoid and routes into private driveways, but data update is several months behind OSM. The data date is clearly shown in the app which is a help. Has ads unless paying to remove them.

A big plus for any of these apps is that the data can be pre-downloaded, and navigation will continue to work in isolated areas without cellular data coverage.

In the end, Magic Earth released a data update in late January and included the new data from the FD. We met with the FD and showed them Magic Earth. They were very enthusiastic about the app and tested it with some past problem addresses. They noted that one house has no driveway: you must know to park at the neighbor’s house and walk on a foot path through the woods to get there. OSM navigation would not be able to find that one! They loaded Magic Earth on the iPads mounted in the trucks. They also had a Windows tablet which we had no navigation solution for.

The fire district monitors their response time, and hopefully it will have a measurable impact over time. They had a number of ideas for other ways to use this data - for example they will enter all the emergency helicopter landing zones (any flat area with at least 100 feet of clearance). The ideal way to use this is to have an app that shows the nearest landing zones, but I don’t know of any such app yet. Of course it would be desirable to minimize the number of different apps they need to learn and to integrate with their current dispatch system.

I recently happened to find another OSM mapper who has mapped road and address details in his rural region and seen a great improvement in average response time using OSMAnd.

And dark and stormy nights aren’t as bad as before!

Location: Marietta, Greenville County, South Carolina, 29683, United States

US Rail Crossing Statistics

Posted by MikeN on 16 August 2017 in English.

Out of curiosity, I pulled some statistics on the US Rail network. This does cross into a bit of Canada and Mexico where the GeoFabrik extract approximated the boundary.

level_crossing	TOTAL	232167
crossing	TOTAL	8231

Rail_Bridge	47232
Rail_Tunnel	16394
Highway_Bridge	70811
Highway_Tunnel	8972

Total Layer Crossings 143409

A bridge or tunnel is counted as a single occurrence no matter how many rail lines are included. Each marked crossing node is counted, so a fully mapped rail yard could contain many crossing nodes.

For a closer look here is a breakdown of the top 20 categories of level_crossing - the first column is the type of ‘highway’, and the second column is the type of ‘railway’ in OSM:

residential	rail	112659
service	rail	29171
tertiary	rail	26789
secondary	rail	16717
unclassified	rail	12732
track	rail	10058
primary	rail	6734
residential	disused	1628
residential	light_rail	1547
residential	tram	1413
trunk	rail	1122
tertiary	light_rail	1114
secondary	light_rail	1059
service	light_rail	676
residential	abandoned	660
primary	light_rail	517
tertiary	tram	493
service	disused	435
tertiary	disused	372
residential	Unknown	371
residential	preserved	353

A type of ‘Unknown’ usually means that a node that joins ‘highway’ to ‘highway’ is marked as type level_crossing for example.

Similarly, here are the top 10 ‘crossing’ types:

footway	rail	2984
footway	light_rail	2083
path	rail	881
cycleway	rail	762
footway	tram	565
path	light_rail	116
cycleway	light_rail	96
footway	miniature	86
footway	preserved	62
residential	rail	56
service	rail	34

Note the presence of ‘residential’ and ‘service’ which are either newly incorrectly marked ‘crossing’s or a rail crossing at the junction of ‘residential’ and ‘path’ for example.

To see the complete breakdown to perform custom category groupings, obtain the raw .CSV files from Rail Crossing Counts

Maproulette Rail Crossings completion

Posted by MikeN on 7 August 2017 in English.

The group of railroad crossing challenges listed in the previous diary entries is now complete. Many people worked on these challenges to make this happen. The tasks seemed to get more difficult as the challenge neared completion, since each task would correct a single crossing at a time.

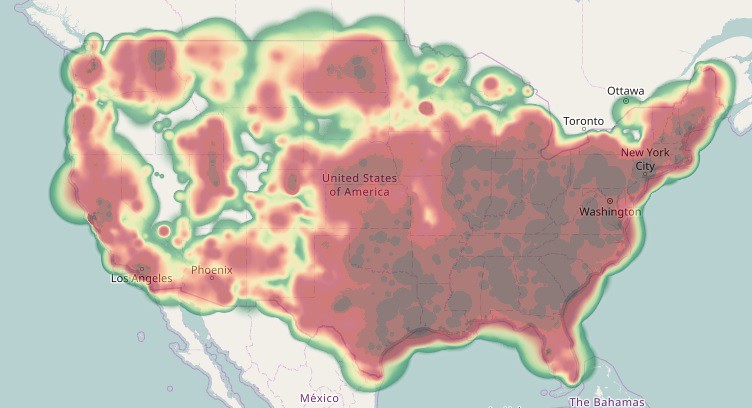
Many of the tasks involved original TIGER highway crossings with poor alignment. I also worked on geometric alignment of the crossing approach roads to match the aerial imagery. Although almost none of these would be cross-checked against GPS traces, Bing imagery is almost always a factor of 10 more precise than the worst of the TIGER data. The resulting edits may have an effect on “TIGER desert analysis” - the study of large untouched areas in the US. Those “TIGER deserts” still exist but would be smaller. My personal contributions heat map now mostly shows areas in the US where there were rail crossings that needed fixing:

US Contributor Heat Map

I have fond memories /nightmares of a task landing in West Virginia or Kentucky, and realizing that the only way I could fix the crossing called out by the task would be to untangle the surrounding 30 miles of rail and roads.

The challenges took a total of 10 months to complete. I attempted to keep the quality of tasks relevant by re-running the analysis every week. Thus any fixes completed outside of MapRoulette or edits of surrounding crossings would automatically be marked complete in MapRoulette.

In the role of the “Monday Morning Quarterback”, (with perfect hindsight) there are things that ideally would be done differently or included in a more detailed task definition page:

  • Separate tasks into additional challenges to reduce the time needed to analyze each one. For example, a ‘duplicate rail crossing nodes’ task would define a work flow even if there is already a visible ‘X’.
  • Create a video tutorial for the most popular editors to show the workflow for all the common tasks and how to fix. Even having screen shots of how to identify most common US bridges and tunnel types would help.
  • I was able to concentrate on tasks marked as Skipped or ‘Too hard’ by querying the API. If the crossing was completely invisible from aerial imagery or alternate aerial imagery such as being under a bridge that might be 3 layers, the final task completion was to remove the task and leave an OSM Fixme or OSM Note. It would be useful to add a preference for those task status types in MapRoulette.
  • Define a helpful sequence of alternate imagery: latest TIGER, NCOneMap (for North Carolina off-leaf imagery), use of SRTM Elevation to detect the difference between a tunnel entrance VS barriers on a decommissioned highway crossing, USGS Large Scale Imagery / NAIP for latest imagery for road realignments.
  • Define a sequence of analysis when encountering a crossing that looks correct: was it recently fixed by someone else, or is the problem difficult to see? (1. Try a node “J”oin in JOSM. 2. Check date of last Crossing node edit - mark as already fixed if corrected in the past week. 3. Check the last edit date of both the highway and railway - mark as already fixed if corrected in the past week. ) The trickiest of these was a bridge - road crossing where all edits were much older than the last OSM synchronization. The problem was a ‘duplicate bridge’, two 2-node ways where one ‘bridge’ had no layer or bridge tag.

As a side note about the internal detail of MapRoulette, it seemed as though the Postgres SQL RANDOM statement was not truly random - as though there was an internal optimization or spatial caching of a previous RANDOM statement. My only evidence of this was that when encountering a 2-track crossing on a task where both level crossing nodes were corrected for the first task, the second crossing task would appear after only a small number of other tasks.

Because OSM is constantly being edited, there are now new unmarked crossings identified. I have not extended the Rail Crossings challenge because many of them come from new construction where there is no imagery to determine whether the crossing should be a level crossing or bridge. I may add these if I can find a way to ensure that just the solvable crossings are identified.

The end result of these challenges is that the Rail-Road network intersections in the US are much more accurate. They could serve as a reference to routing apps that can generate an alert for level crossings. This application has one case that doesn’t fit easily in the OSM tagging convention: busy tram crossings in cities, where there may be many crossing alerts generated over a short distance. Although they are actual rail crossings that would result in serious damage in an accident, continuous alerts are a case of ‘crying wolf’. This was briefly discussed in railway=level_crossing with in-street trams? , but without any definite resolution. For now, the application developer also needs to examine the crossing rail type to screen out tram crossings - probably not an ideal solution.

Update on challenge status:

Crossing Ways Rail-Highway 35.6% complete
Crossing Type Rail-Highway 53.3% complete    Both types of pedestrian crossings are 100% complete.

I’m taking time to do geometric repairs as well. The result will be a reasonably correct road network near rail crossings.

The links to the remaining challenges are:

[Crossing Ways: Highway-Railway, US] http://maproulette.org/map/980

[Crossing Type: Highway-Railway, US] http://maproulette.org/map/990

Progress Report: Railway Crossings challenge for MapRoulette

Posted by MikeN on 18 November 2016 in English. Last updated on 19 November 2016.

As previously mentioned in diary entry http://www.openstreetmap.org/user/MikeN/diary/39782 , the MapRoulette Rail challenge uses topological analysis of the rail network to generate the task list. Many tasks land on a multi-track crossing or include a rail yard, so many tasks correct fix more than 1 crossing per edit session. Also, anyone routinely reviewing an area might correct rail crossings outside of MapRoulette By re-analyzing current OSM data, finished tasks were marked off. Some findings for the last interval:

  • 1221 tasks marked complete in Map Roulette
  • 5468 tasks auto-marked complete after detection as fixed
  • 4.5:1 node correction per task ratio
  • Overall topological rail challenge 16% complete 10925 / 68758 tasks

Because the first MapRoulette tasks are more likely to land on in a ‘busy’ area, future fix rates and node correction to task ratio will probably fall as each task is more likely to point to an isolated crossing.

Many tasks end up making geometric corrections to the rails and surrounding roads.

The links to these challenges are:

[Crossing Ways: Highway-Railway, US] http://maproulette.org/map/980

[Crossing Ways: Pedestrian-Railway, US] http://maproulette.org/map/989

[Crossing Type: Highway-Railway, US] http://maproulette.org/map/990

[Crossing Type: Pedestrian-Railway, US] http://maproulette.org/map/991


There was a moment of panic as the analysis also discovered thousands of new tasks! This had 2 causes:

  • An abandoned rail line / cycle trail was changed to be a railway. I have commented on that changeset asking for more information.
  • A node from changeset http://www.openstreetmap.org/changeset/43738090 was moved across the country near the following changeset http://www.openstreetmap.org/changeset/43738103 in JOSM. From a history examination, I’m not sure if the rail node was attached to Benton Street. Maybe there is a JOSM hotkey that does this. To try to avoid this in the future, I have changed MapRoulette to open JOSM in a new layer.

Railway Crossings challenge for MapRoulette

Posted by MikeN on 30 October 2016 in English.

One class of quality improvements in the US is Railway Crossings. The original TIGER import mostly connected railways to highways or crossed with a duplicate but unconnected road. There was no bridge or crossing information to assist.

It can be useful to have railway crossing information available for navigation. In 2015, MapRoulette defined a challenge to review all railway crossings. The first version of the Railway Crossings challenge at MapRoulette used the points defined by the US Federal Railway Authority. Many of these crossings had already been corrected by map editors during normal QA. The challenge began with 120K crossings to review. This was reduced to some 70K points by the time MapRoulette V2 came out. The partially completed challenge was not migrated because the MapRoulette V2 features were being tested and improved. Although this is not the ideal type of task for MapRoulette, I enjoyed being able to knock out 5 in a row without much effort (unless in KY, PA or WV!) It also is ideal for an armchair challenge - only a few are difficult to make out from the air.

Because I would typically correct nearby crossings when fixing a task (others may have also), I wondered if identifying remaining crossings with a topological analysis would result in fewer false positives, and fewer already-completed tasks to review. So I set up a POSTGIS instance and tried to construct queries that would identify problem crossings. That proved to be too difficult:

  • I couldn’t tell if OSM2PGSQL or Osmosis populate the database with the full OSM topology, including where nodes are shared, and even if so, what would such queries look like.
  • I only had 8G of RAM, and didn’t know how to construct queries for POSTGIS that would handle US-sized data in a reasonable time.

In the end, I wrote a program in C# to analyze railway crossings. I filtered the raw OSM data in Osmosis so that my program only needed to deal with Highway VS Railway. As I looked at some results, I realized that I could also Quality Check pedestrian-railway crossings with the same program, and create another challenge.

As I was looking at the first analysis, I found many bridges without a layer tag. Some would say that bridges imply a nonzero layer, but it is still better to specify. For this challenge however, I excluded all bridges, tunnels, and ways with a layer attribute. My thinking is that those locations do not have a typical railroad crossing, and someone has already done some review there. And there are other OSM QA tools that already address bridges with missing layer tags.

I also exclude these railway types: abandoned, razed, station, disused, dismantled, demolished, adjacent, platform . Although a ‘disused’ railway may cross a road, I saw too many of these with no X painted on the road and could not identify that rails are even present. Often they would require local or RailFan knowledge to be accurate.

When railways intersect a roadway and share a node, I check for a railway=level_crossing node tag. When railways intersect a sidewalk, path, or cycleway, I check for a railway=crossing tag. Many highway crossings are marked as a pedestrian crossing because the mapper’s natural choice is ‘this is a railway crossing’, therefore railway=crossing.

Because the OSM data is the starting reference, no crossings will be flagged where driveways cross a railway, but no driveway exists in OSM.

The links to these challenges are:

[Crossing Ways: Highway-Railway, US] http://maproulette.org/map/980

[Crossing Ways: Pedestrian-Railway, US] http://maproulette.org/map/989

[Crossing Type: Highway-Railway, US] http://maproulette.org/map/990

[Crossing Type: Pedestrian-Railway, US] http://maproulette.org/map/991


Some C# problems I encountered (with the Microsoft .NET library):

“640K of memory ought to be enough for anyone” Out of memory! What?! It turns out that the default build properties are set to “Prefer 32-bit”. Unchecking that option gives a larger memory option. Be sure to do that for both Debug and Release!

Rerun - it gets further, but now “The dimension of the array exceeds the limits of addressing.”

“47995853 nodes ought to be enough for anyone”

The next problem encountered was the discovery that the default hash implementation supports only 47,995,853 objects before giving an out of memory error. Fortunately the error is easy to work around. In the application configuration file, configure the runtime to support very large objects with the gcAllowVeryLargeObjects tag: <configuration> <startup> <supportedRuntime version="v4.0" sku=".NETFramework,Version=v4.6.1"/> </startup> <runtime> <gcAllowVeryLargeObjects enabled="true" /> </runtime> </configuration>