
Sidewalks by length
Posted by Hungerburg on 23 January 2021 in English. Last updated on 29 January 2021.Below python script queries the OHSOME interface for the length of sidewalks mapped by different methods.
[Update: Correct accounting for sidewalk=both]
#!/usr/bin/python3

######### Plot the length of sidewalks mapped in certain regions

import json
import requests
import pandas as pd
import matplotlib.pyplot as plt
import datetime

pd.set_option('max_colwidth', 100) # maximum columnwidth for pandas
TIME_MONTHLY = "2008-01-01/2020-12-31/P1M" # temporal filter

######### Boundaries # http://norbertrenner.de/osm/bbox.html
BBOXES = {
    "US":                "-128.4,24,-57.2,49.7",
    "Poland":            "14.55,49.47,24.04,54.85",
    "Germany":           "5.89,47.17,13.86,54.89",
    "Great Britain":     "-11.7,49.8,2.1,61",
    "World":             "-180,-60,180,80", # took 1:10 min:s
    "East Coast":        "-83.7,23.9,-66.4,47.4",
    "Upper East Coast":  "-78.49,36.97,-70.11,42.94",
    "Not North America": "-25,-50,180,80|-110.6,-55.7,-29.2,24.5",
    "South America":     "-110.6,-55.7,-29.2,24.5",
}
BBOX="South America" # selected boundary

######### Filters
filterSidewalk = 'type:way and (\
(sidewalk=right) or \
(sidewalk=left) \
)'
filterSidewalk2 = 'type:way and (\
(sidewalk=both) \
)'
filterFootway = 'type:way and (\
(footway=sidewalk) \
)'

######### Query and plot
res = requests.post("https://api.ohsome.org/v1/elements/length/ratio",
      data = { 'filter': filterSidewalk, 'filter2': filterFootway,
               'bboxes': BBOXES[BBOX], 'time': TIME_MONTHLY } )
#print(res.text)
print(res.elapsed)
body = res.json()
df = pd.DataFrame(body['ratioResult'])
df.drop(columns=['ratio'], inplace=True)
# length is coming in meters, plot km
df.value = df.value/1000; df.value2 = df.value2/1000
df.timestamp = pd.to_datetime(df.timestamp)
df.set_index('timestamp', inplace=True)
res2 = requests.post("https://api.ohsome.org/v1/elements/length",
       data = { 'filter': filterSidewalk2,
                'bboxes': BBOXES[BBOX], 'time': TIME_MONTHLY } )
#print(res2.text)
print(res2.elapsed)
body2 = res2.json()
df2 = pd.DataFrame(body2['result'])
# length is coming in meters, plot km*2
df2.value = df2.value/500
df2.timestamp = pd.to_datetime(df2.timestamp)
df2.set_index('timestamp', inplace=True)
# plot result
df3 = df.add(df2, fill_value=0)
df3.rename(columns={'value': "Sidewalks", 'value2': "Footways"}, inplace=True)
df3.plot(title="Sidewalks (km) in OpenStreetMap in " + BBOX, figsize=(9.6, 4.8))
plt.show()
The resulting plots show, that there are indeed strong regional preferences:
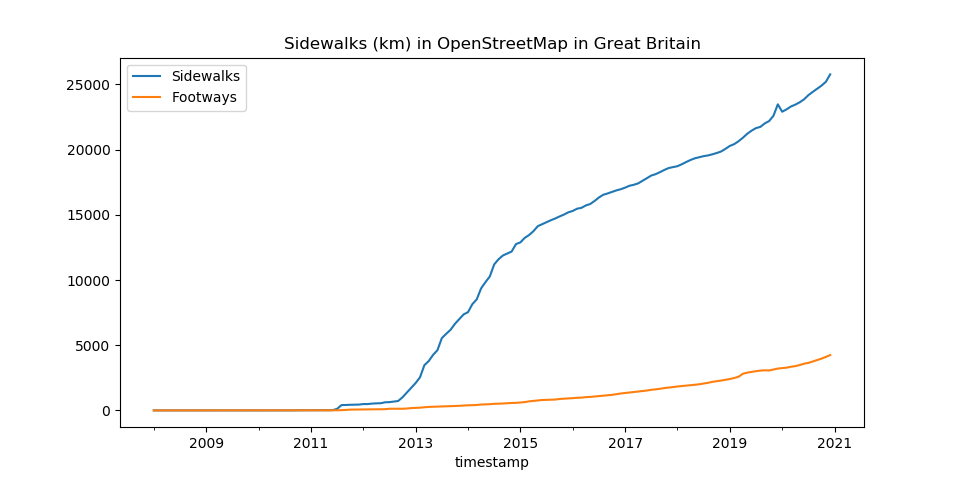
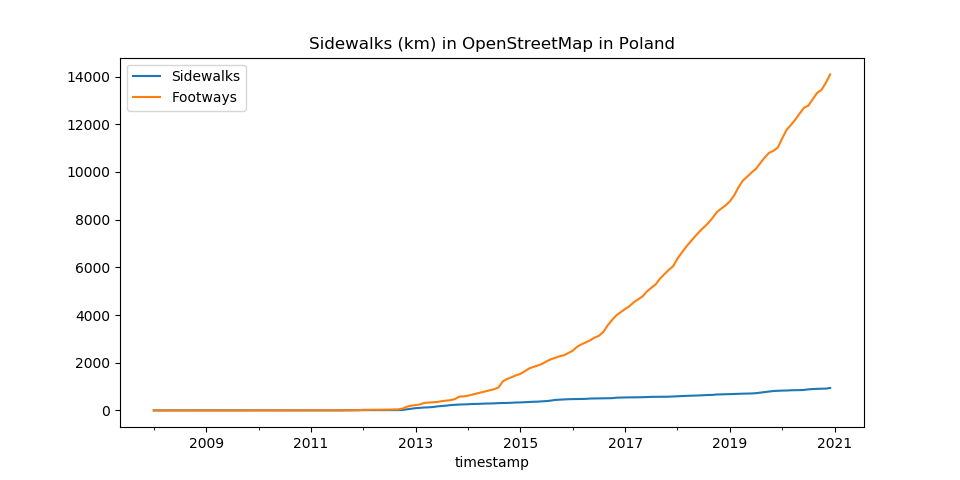
Plots of the US and Eastern Europe look much like Poland; Germany and Western Europe look much like Great Britain. Plots with total number of ways have been created but not uploaded. The curves closely mirror the ones for length, when not accounting for sidewalk=both; their y-scale count slightly crosses the 100k mark, so average “raw” way length in both countries is roughly equal. If there is splitting going on, it affects both countries the same; When correctly accounting for sidewalk=both, average way length is considerably higher in Great Britain.
[Continue reading „Sidewalks by popularity“]
Discussion
Comment from Mateusz Konieczny on 23 January 2021 at 20:42
Thanks for running this! I suspected this effect, but it is nice to have tour opinion confirmed (yes, I am aware about confirmation bias).
It is nice to see completely opposite results, so multiple confounders are much less relevant.
My only comment is for legend: maybe “sidewalks mapped with sidewalk tag” and “sidewalks mapped as a separate way” would be better?
Comment from Mateusz Konieczny on 23 January 2021 at 20:45
(highway=footway) and (footway=sidewalk)
Note that in some cases (combined footway and cycleway) highway=path + footway=sidewalk will be valid (though it is probably very rare)
Comment from Hungerburg on 23 January 2021 at 21:29
Hello Mateusz,
Its been fun to explore what a database like OSM holds :) I was quite surprised to see the results to come out so contrarian. It is too much work to change the legend, think of it as a shorthand, restating the names of the OSM keys, that are used to map the feature.
Regarding path, that is only documented for some weeks, but as you said, surely existed for much longer. I recreated the stats locally and there is no difference at all in Britain and negligible difference in Poland.
Please note, this is the actual length of the features mapped, according to OHSOME down to less than 1% deviation, not some arbitrary number, such as count of OSM entities.
Note, that this also does not count “sidewalk=no”, which some consider humbug, but others consider worthwhile, e.g. developers of pedestrian routers. Some negative sidewalk tags can replace hundreds of positive ones, as, at least in my opinion, most of the sidewalks on the ground in OSM are mapped as “highway=residential” (implicitly that is; much like the developers of the the abstreet game e.g. who would be much better served with highway tagging than with separate ways.)
Comment from Hungerburg on 23 January 2021 at 22:21
PS: I know that you are aware of confirmation bias, because it was you, who introduced the “regional variations” section in the sidewalks article in the Wiki.
PPS: Someone needs to tighten the separate way section in the Wiki, it even contradicts itself. It does not do a good job at advertising the usefulness of this approach.
Comment from Mateusz Konieczny on 25 January 2021 at 07:33
Have you tried to make global analysis (total length of tagged sidewalk worldwide) using each method?
Still would be affected by some distortions, but would be better than taginfo raw usage count.
Comment from Mashin on 25 January 2021 at 14:47
Nice analysis. Thanks for doing that. Can you make it for individual countries and world wide?
Also I think another way how to look at is looking at the number of user that were using that tagging in the past lets say 2 years.
Comment from Hungerburg on 25 January 2021 at 20:56
The story continues here Sidewalks by popularity - I rather not modify this post, as it has discussion and is linked from the Wiki. You can do your own plots from the OHSOME dashboard, but it does not do ratios.