This is a part of a series of diaries sharing our experience on the ongoing LA Building Import into OpenStreetMap.
In the last 2.5 months we started importing building footprints over Los Angeles from open data available in LA county. Discussions about this import started early last year, after several
discussions, planning and trial runs, we finally started the import this April. From its start, the import team agreed that this will be a community managed import. The goal is not only to improve building coverage of OpenStreetMap within the county but also to invite local mappers to actively participate in the whole process.
In this post, I will talk about the tools we built to coordinate this massive import. Many of the processes were based on an earlier buildings and addresses import in New York City with modifications needed due to the difference of data and the context of the local community.
Data sources
3 million buildings in LA County.
The data came from several open data sources provided by the Government of Los Angeles:
- Building geometry (LA City, LA County) - building footprints digitized using high resolution stereo imagery under the
Los Angeles Region Imagery Acquisition Consortium (LARIAC) Program.
- Building type and use - from the Assessor’s parcels database. Each building from has an associated parcel identifier (
AIN), This identifier allowed us to link the type and use of each building.
- Census blocks - this is not directly part of the data to be imported, we simply used the census blocks for dividing the data into manageable chunks.
We combined the building geometry and parcel information using the usual join by attribute GIS operation. This creates a single shapefile of buildings with all the parcel information for each building.
In total, we have >3 million buildings that needs to be checked for quality and a workflow to coordinate a massive community import process.
The Assessor’s parcel data contains detailed usage of each property. We used this data to identify the type of building. To do this, we compared each attribute to taginfo and adopted tags already used by the community. For all other attributes that didn’t have corresponding tags we used the generic building=yes. A CSV was created as a lookup to convert the shapefile attribute to OpenStreetMap key/value pairs.
Like the NYC building import, we scripted the entire process pipeline so that we can execute in a single command. In general, the script performs the following steps:
- Download and extract data in shapefile format.
- Reproject from source spatial referencing system to long/lat WGS-84 (EPSG:4326).
- Split buildings into smaller chunks based on census blocks.
- Convert attributes to OpenStreetMap tags and export as osm format.
- Upload to S3.
This automated process allowed us to easily re-run the conversion if we need to.
For example, when we discovered data issues specific to buildings in Pasadena,
we were able to exclude Pasadena in the next run of the script.
Coordinating the import via the Tasking Manager
To manage the coordination of import by the community, we used a separate instance of the OSM Tasking Manager.
By using the Tasking Manager we can:
- Split the import into smaller TM projects;
- Track the progress of the import and;
- Introduce a two-step process of import and validation.
But the current Tasking Manager does not allow downloading of import data from arbitrary polygons. To make this work,
we implemented a new feature in the Tasking Manager that allows it to:
- Upload a GeoJSON file with a property referencing the source URL of the .osm file,
- When a contributor takes a task, the Extra Instructions section will have download URL for the import data. This URL will automatically download the data into JOSM.
These changes were merged into the main Tasking Manager code so anyone using the latest TM codebase can use this feature as well.
Once we had everything ready, we did a couple of trial runs to evaluate the mapping workflow.
During one of our trial runs, we discovered that since we are using arbitrary polygons instead of the usual square tasks, mappers find it difficult to visualize the edges of the task they are working on.
This can introduce data conflicts especially when the imported data is now merged to the current data within OpenStreetMap. To solve this issue we added a background layer of census block boundaries that is automatically loaded when a user downloads the data.

Downloading data for import.
Automated merging of the split buildings
The trials also encountered cases where a small sliver of building was split from the main building.
Upon further investigation, these buildings are cut by the property lines of the assessor, during the LARIAC mapping.

Split buildings.
Since this came directly from the source data, we have no way of fixing this during the data conversion process.
This required the user to manually merge the split buildings during the importing process.
While combining overlapping buildings in JOSM works, it requires several mouse clicks to merge two buildings.
To make this process faster, we built a plugin in JOSM that merges two buildings and automatically assign the correct tags.

Merge LA buildings in 3 clicks with auto-tools plugin in JOSM.
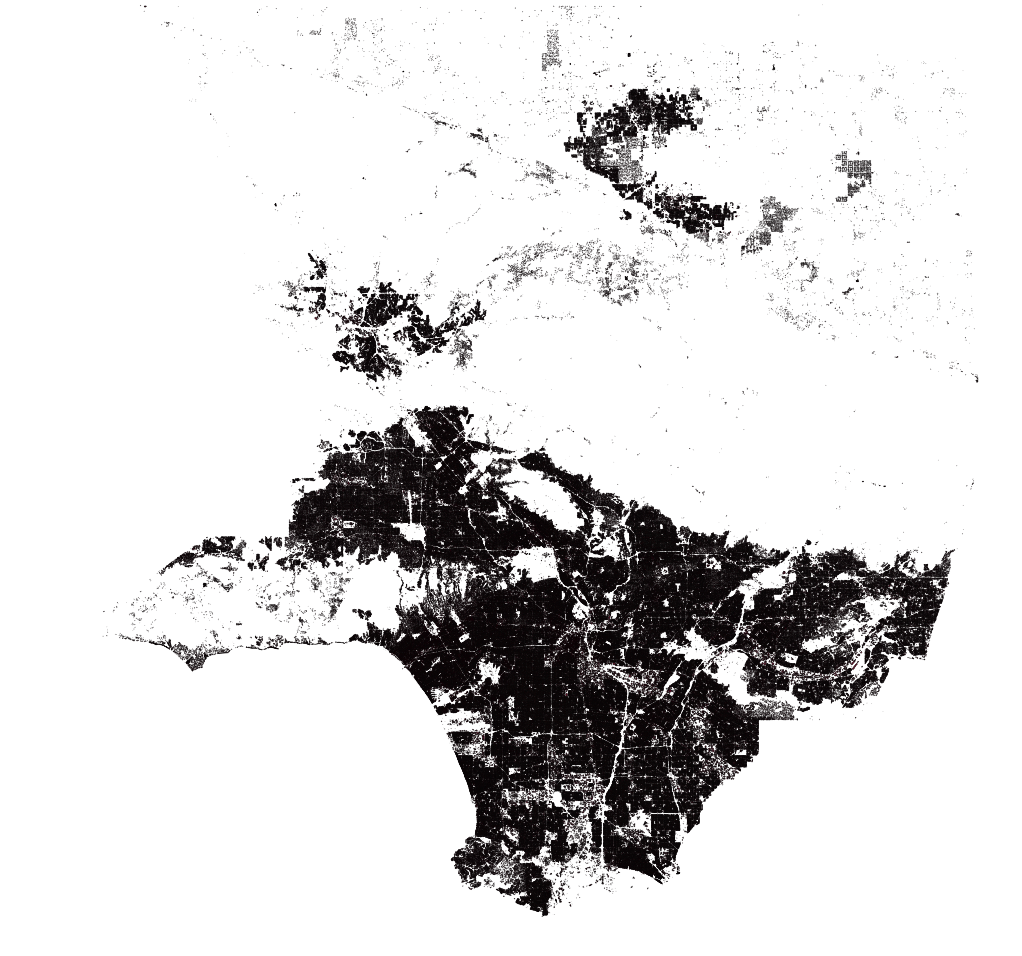
As of this writing, 105 usernames added ~580K buildings. This is more than half for LA City.

500K buildings added. Map by F4map.
As we go along, we continue to improve the workflow and tooling, let us know how we can make this import better!
Head over to labuildingsimport.com/ and grab any task available.
If you’re a local, join our mapathons happening through MaptimeLA.
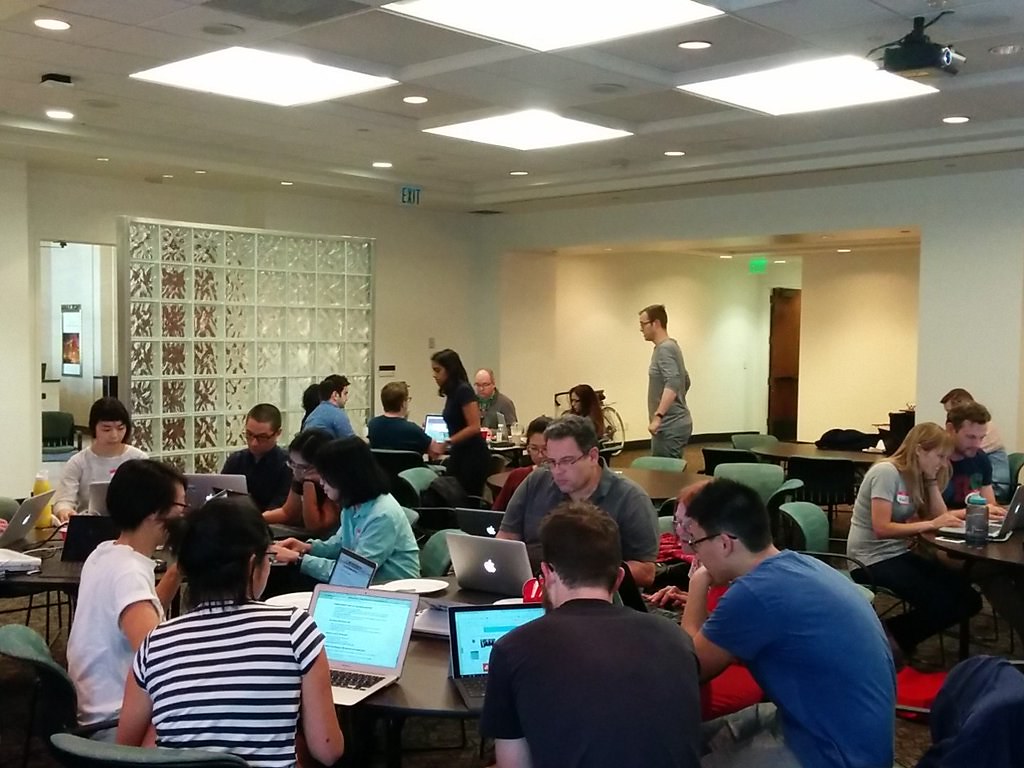
MaptimeLA building import mapathon. Photo by MaptimeLA.
In the next post, we will talk about how we interacted with the mapping community and the response by the local LA mappers on this import.
If you’re in Seattle next month, catch the team at the SOTM-US where we talk more about this import.
More info about the import is available in the following links:
Location:

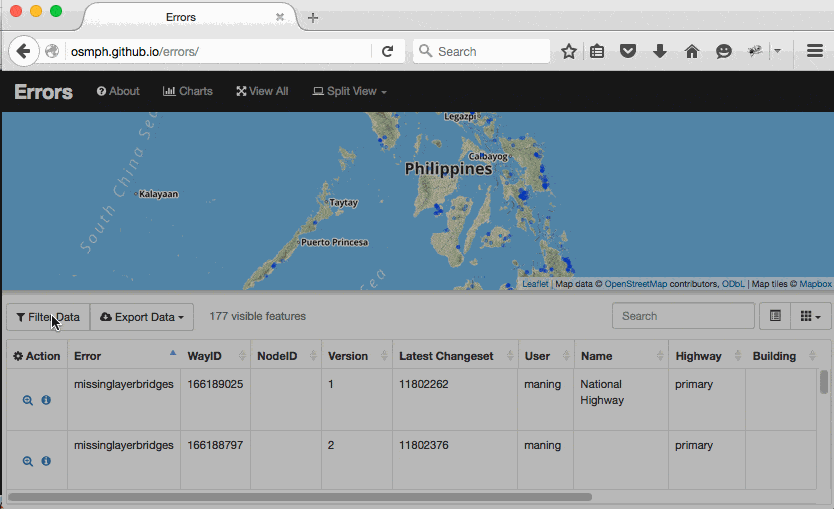
 </br>New mappers in the Philippines in the last couple of days
 </br>My changeset comments