[continued from part 1]
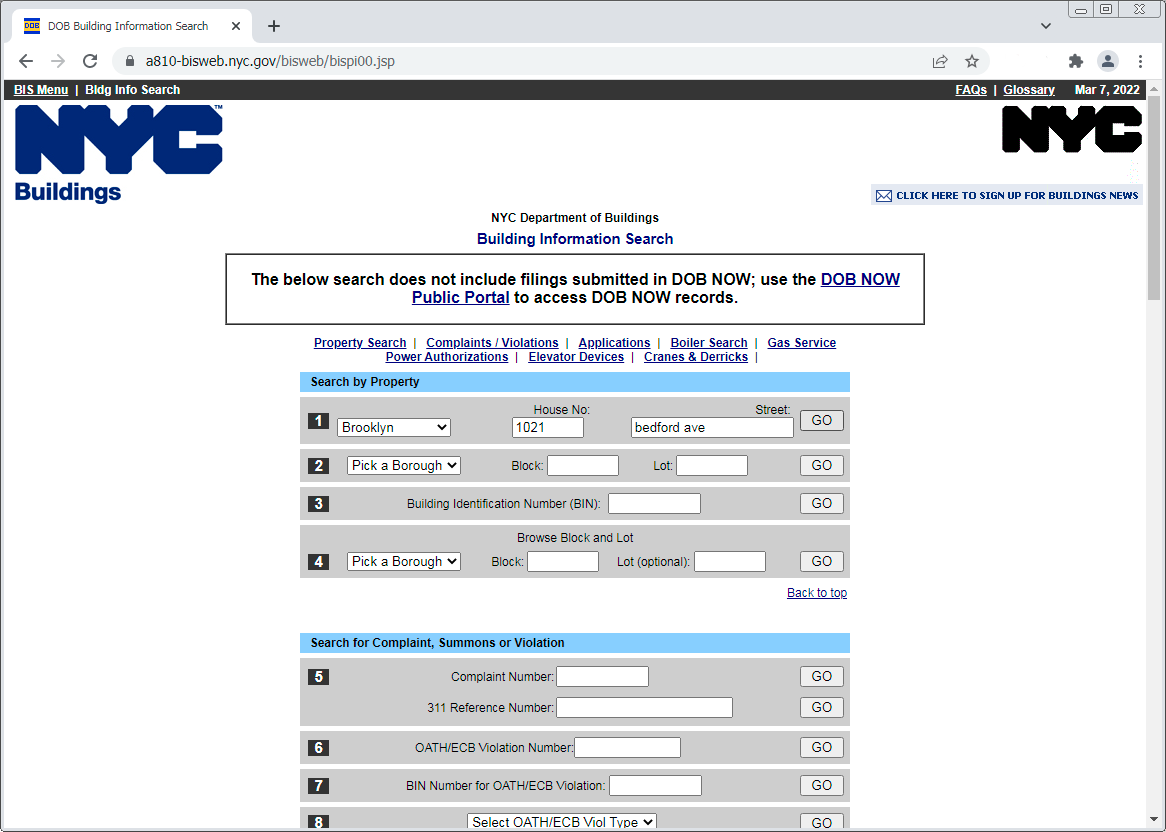
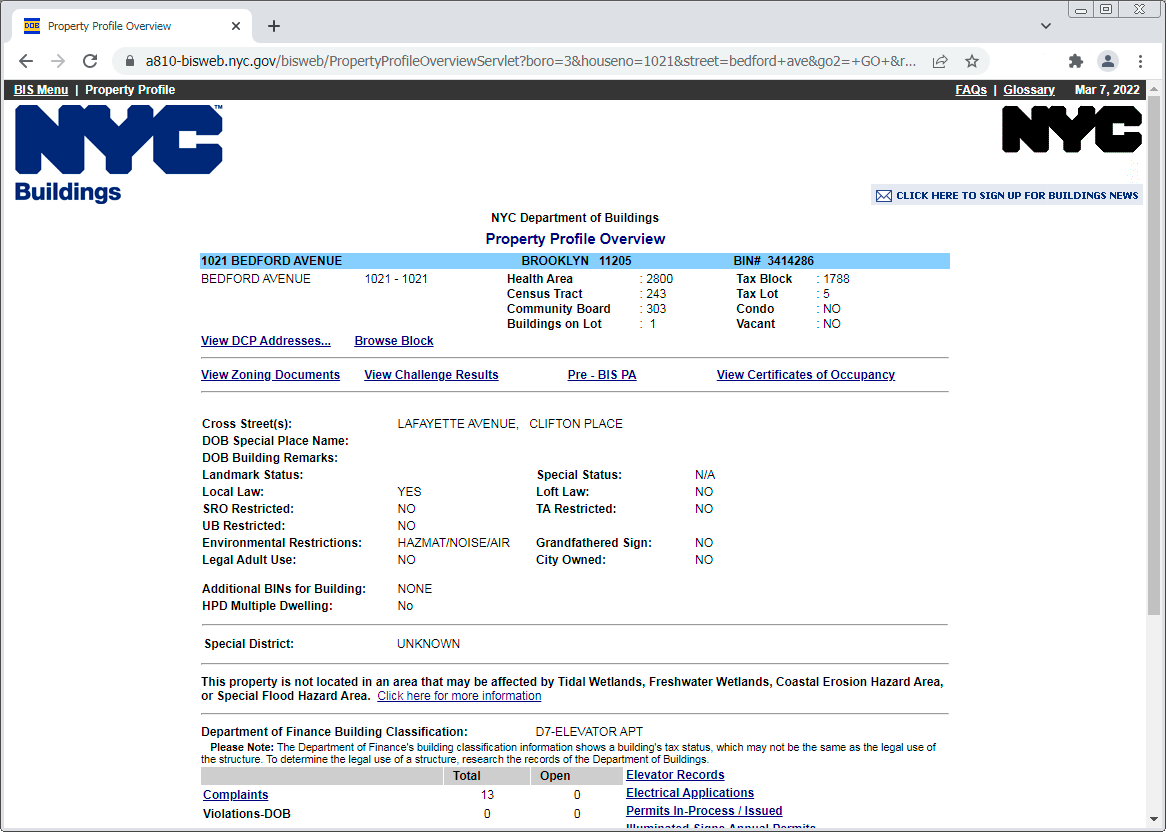
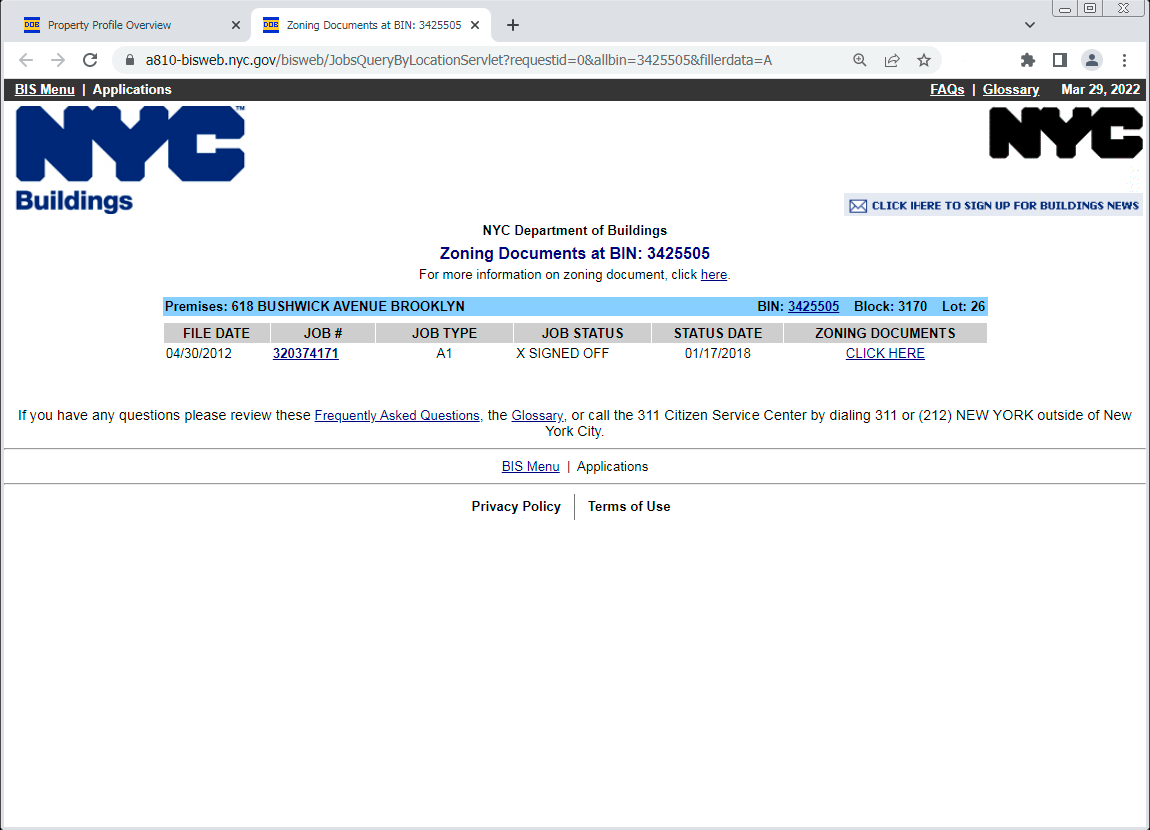
Carrying on with my Brooklyn survey… In the Bushwick neighborhood, I’ve found another new building to map, and a good opportunity to show a little more of NYC’s Building Information Search tool (aka BIS.). Like last time, we’ll start by finding the building’s BIN and height using BIS’s search option 1, with borough Brooklyn, housenumber 618, and street Bushwick Avenue. Here’s the resulting Property Profile Overview page:
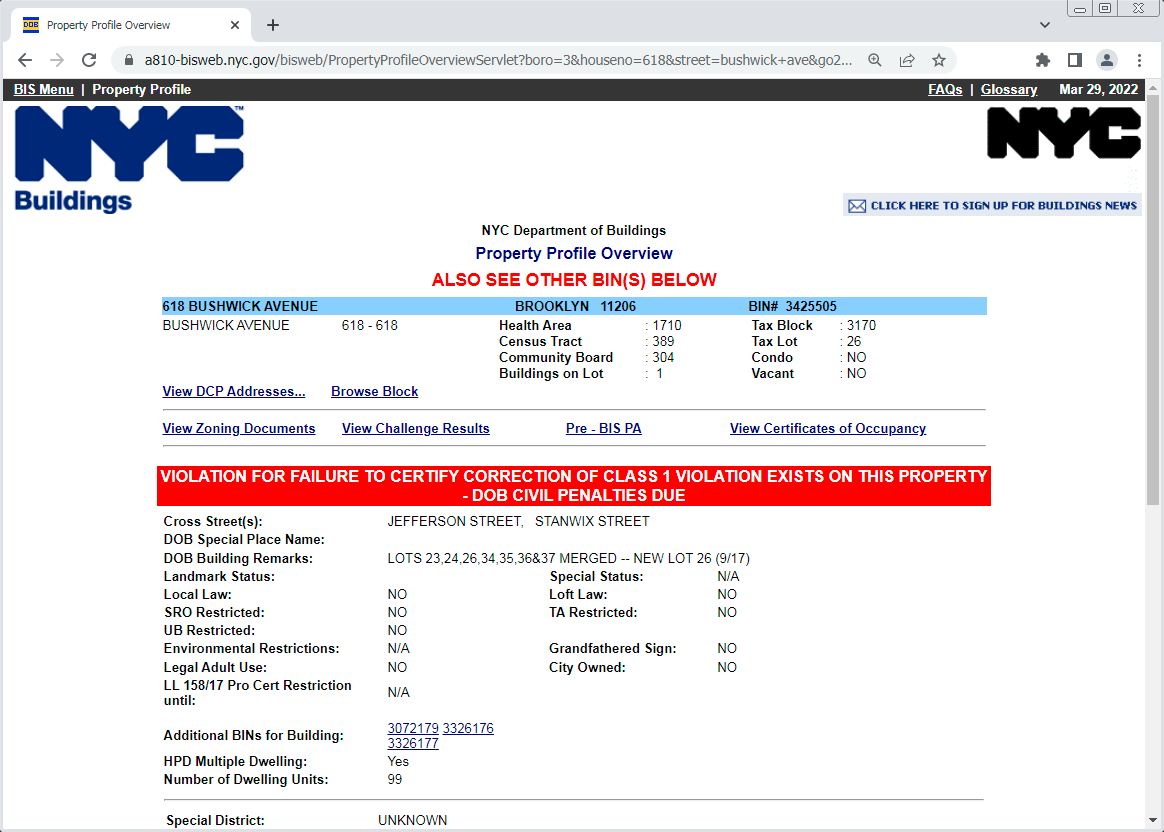
(That exciting red bar means this development is currently in trouble with the Dept of Buildings, but that’s none of my business.) We find the BIN, 3425505. Note the “ALSO SEE OTHER BIN(S) BELOW” message and the “Additional BINs for Building” field – these are older obsolete BINs that this new building has supplanted. The “DOB Building Remarks” note about multiple lots being merged tells the same story, which is a very familiar one in Brooklyn: A large new building has replaced several smaller buildings.
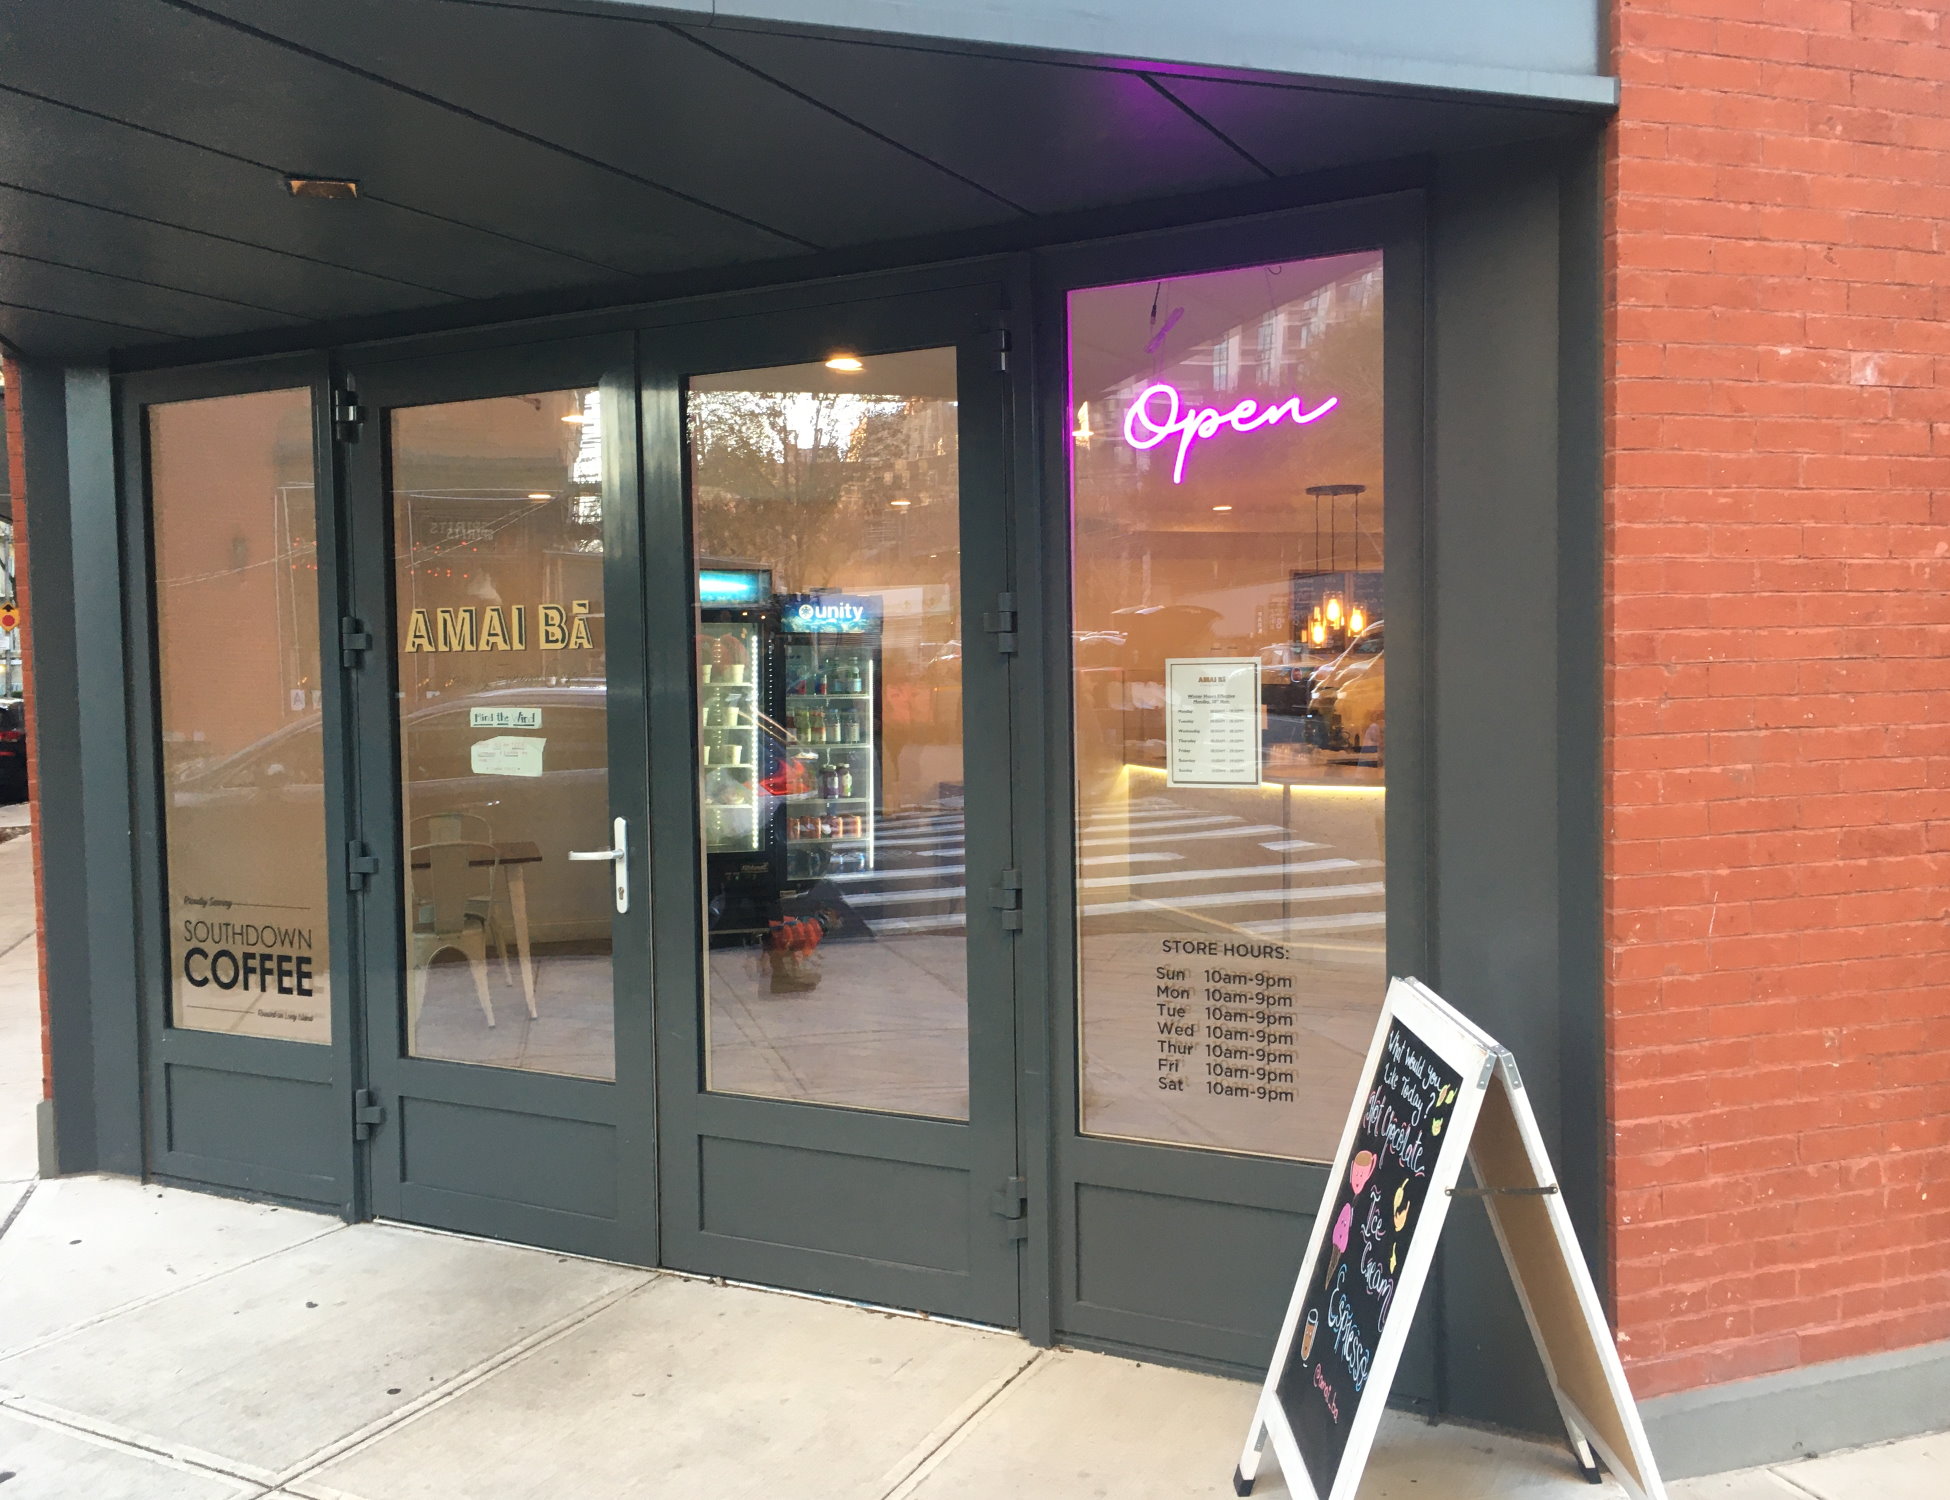
But that story’s not exactly right, in this case. 618 Bushwick Avenue looks like this:
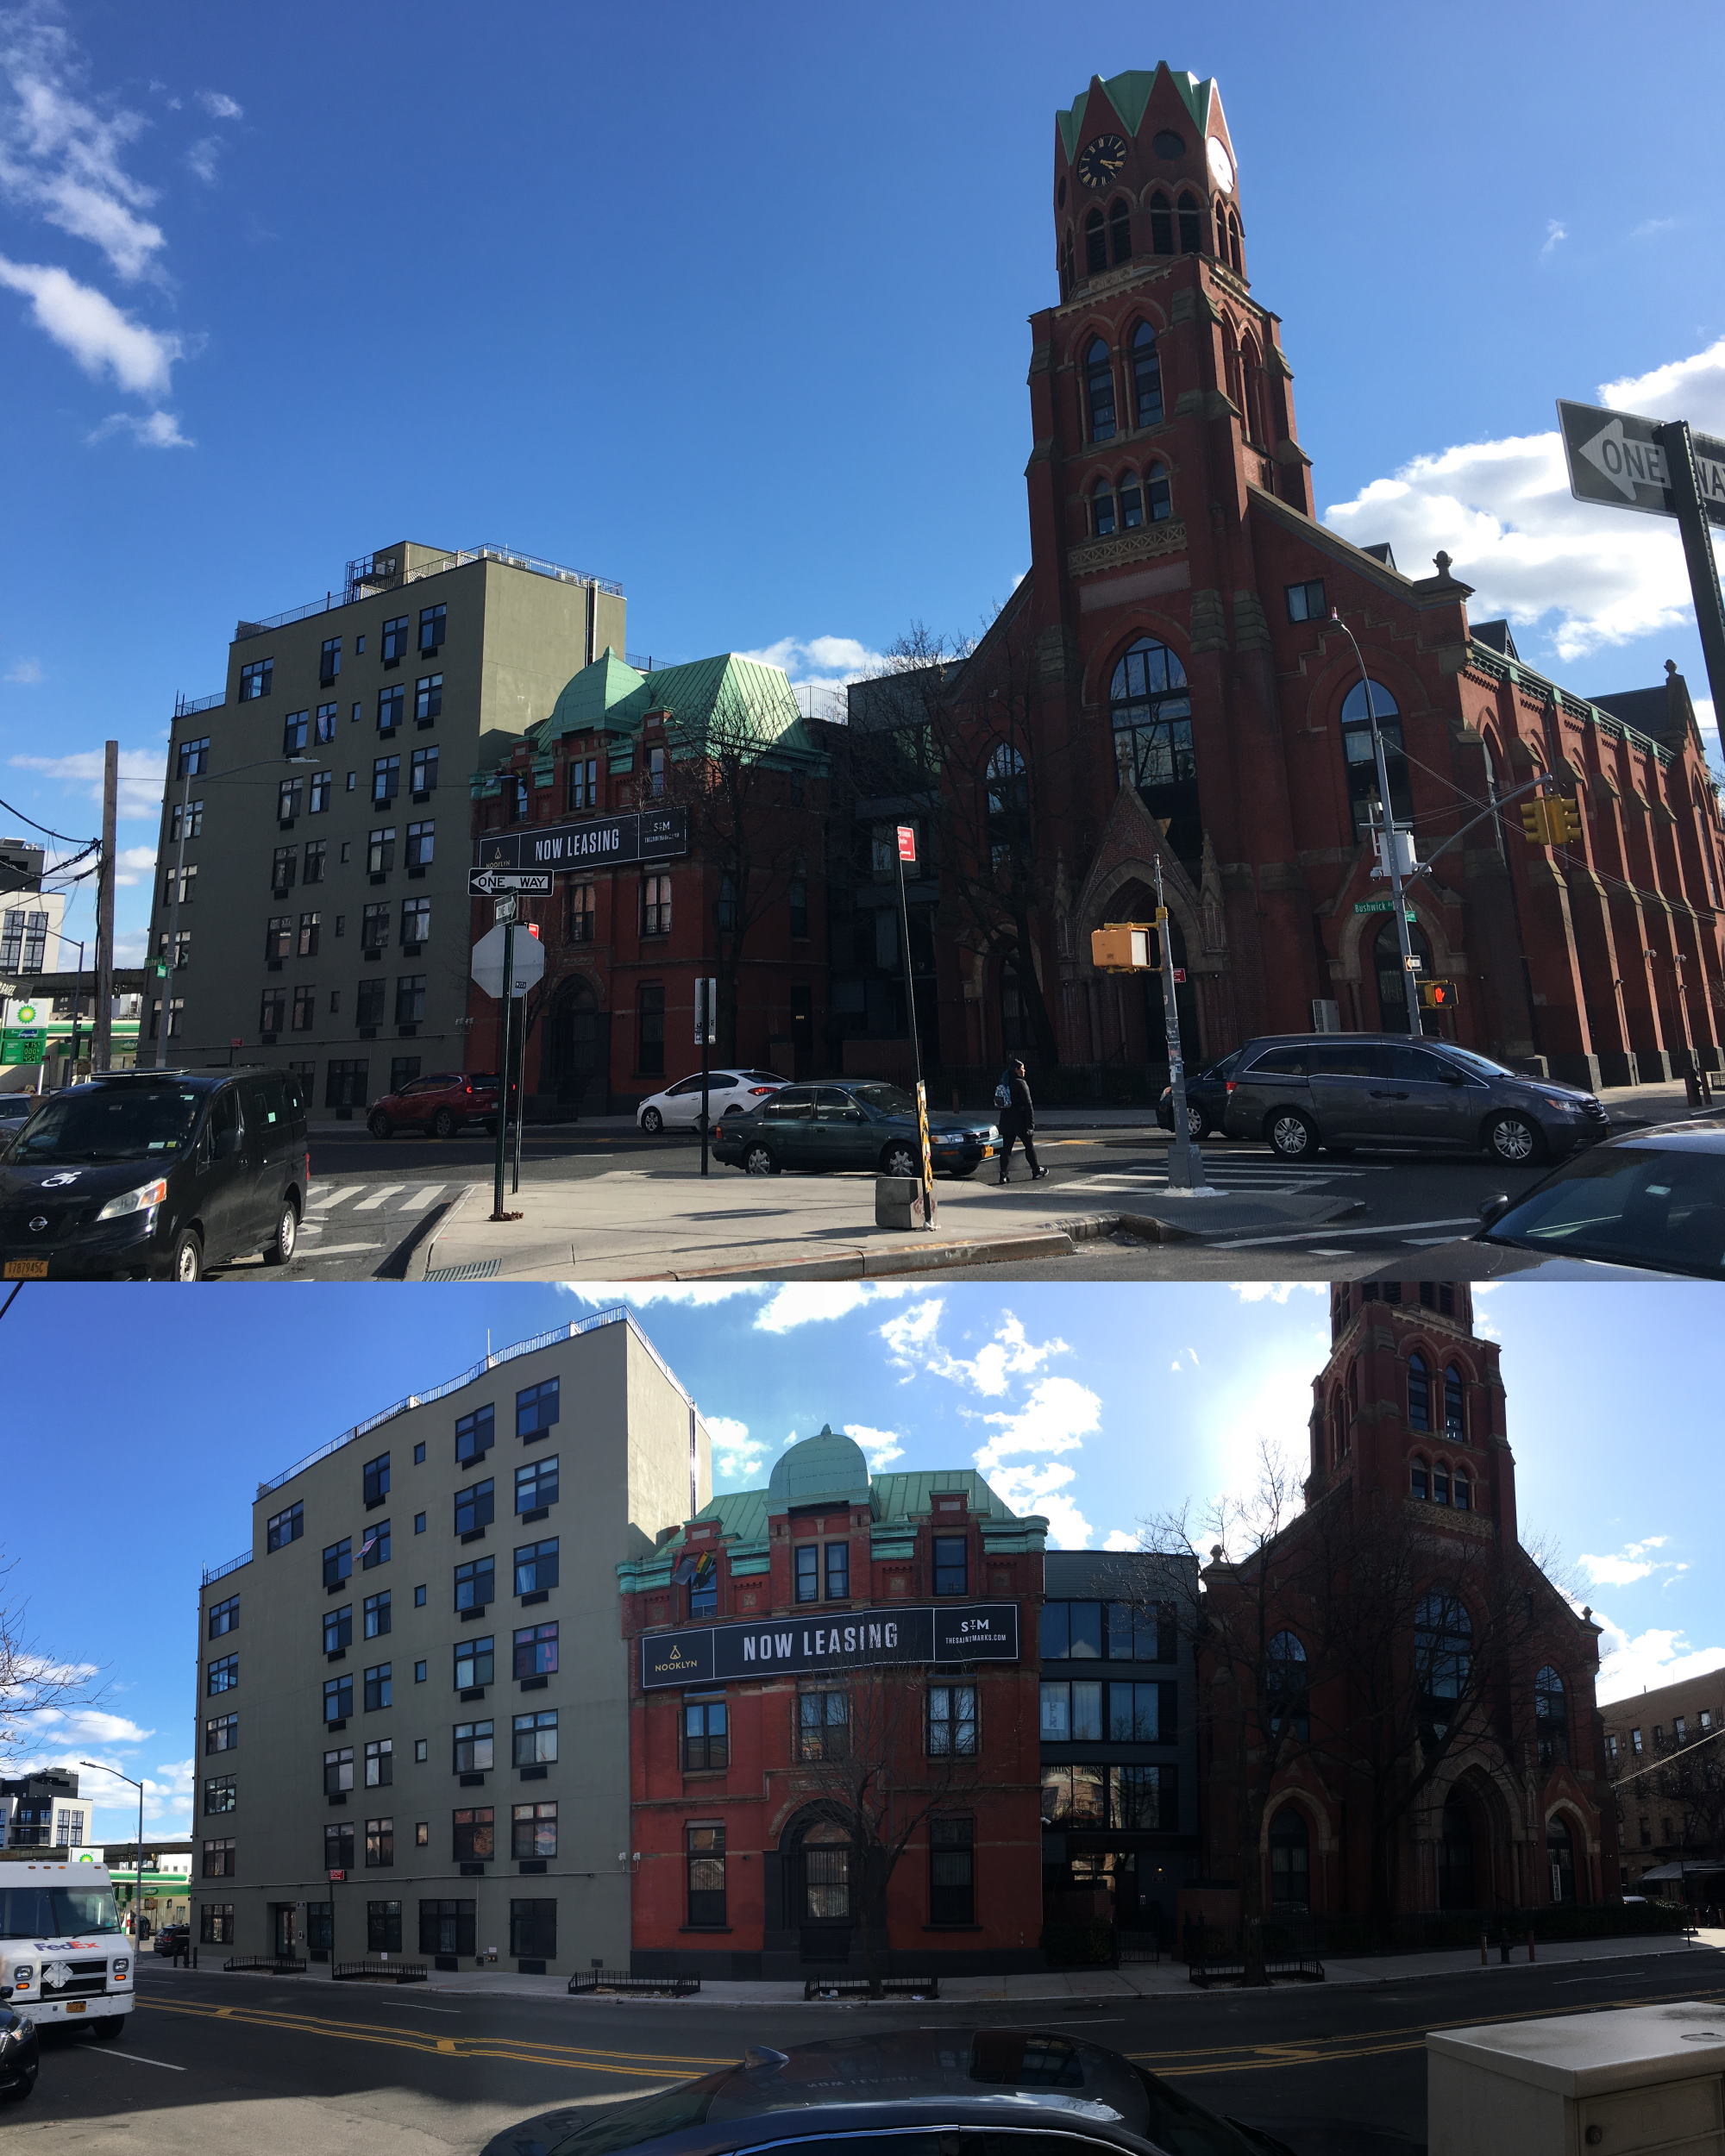
The church on the corner is the old Saint Mark’s Lutheran, and to the left of it, sporting a “Now Leasing” sign, is Saint Mark’s Lutheran School. Long disused, these structures date from the 1890s when Bushwick was a German neighborhood, and the beer-brewing capital of the East Coast. (Some history and photos can be found at the NYC Chapter of The American Guild of Organists site, a great resource for church building lore.)
On either side of the school building is new construction. But all of this, per both city records and on-the-ground reality, is now one building! The previously-freestanding church and school have not been demolished but instead stitched together along with the new blocky corner on the left, and joined into a single residential building with a single address and BIN. So we’ll find the height (of the church, the tallest part) and map this all as one building footprint.
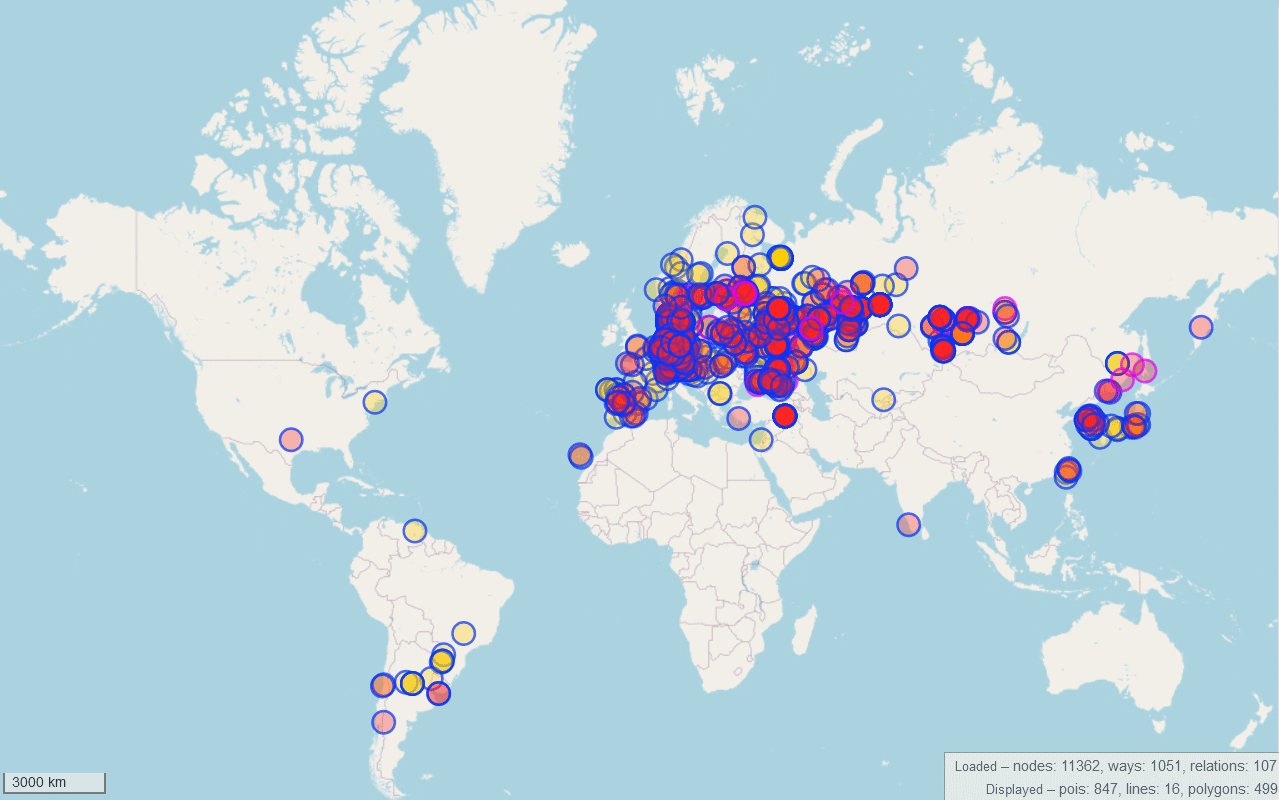
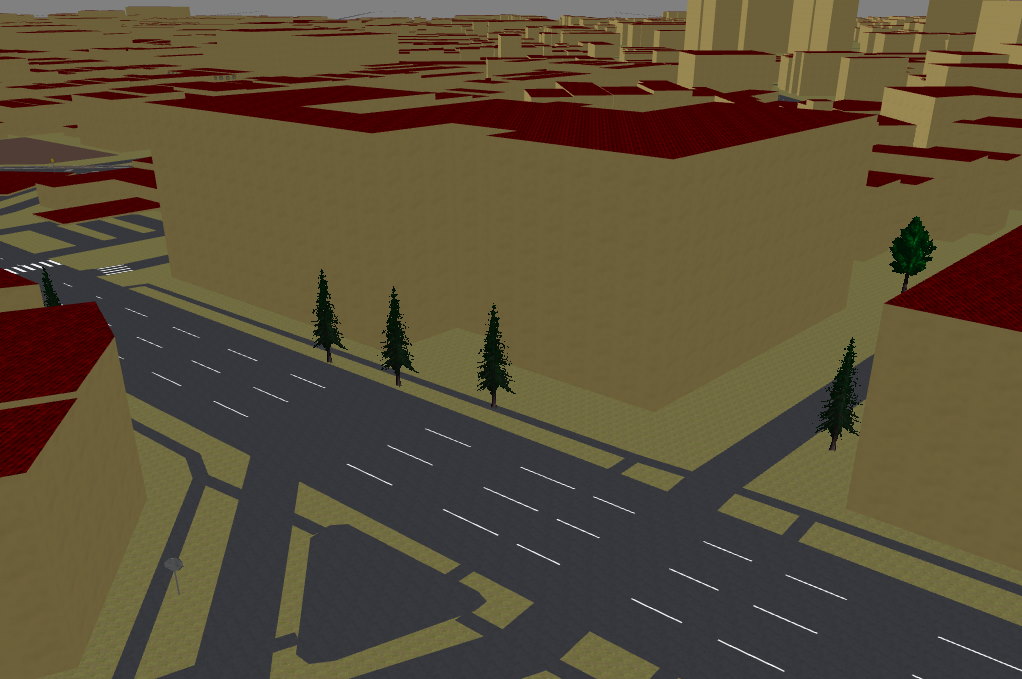
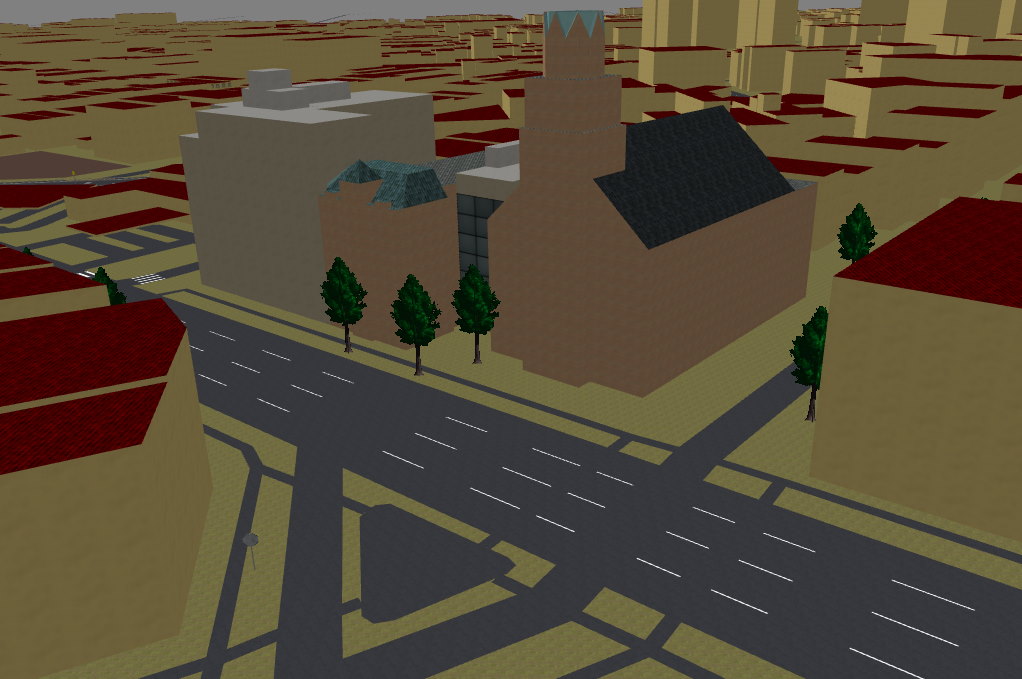
The downside is that there’s potential confusion for those navigating using an OSM-based map. If the map shows a single building where your eyes see four, you might think you’re in the wrong place. This can be even more disorienting if you’re using a 3D map render that shows building heights – you’ll see tall vertical walls with little resemblance to the actual premises, as in this OSM2world rendering:
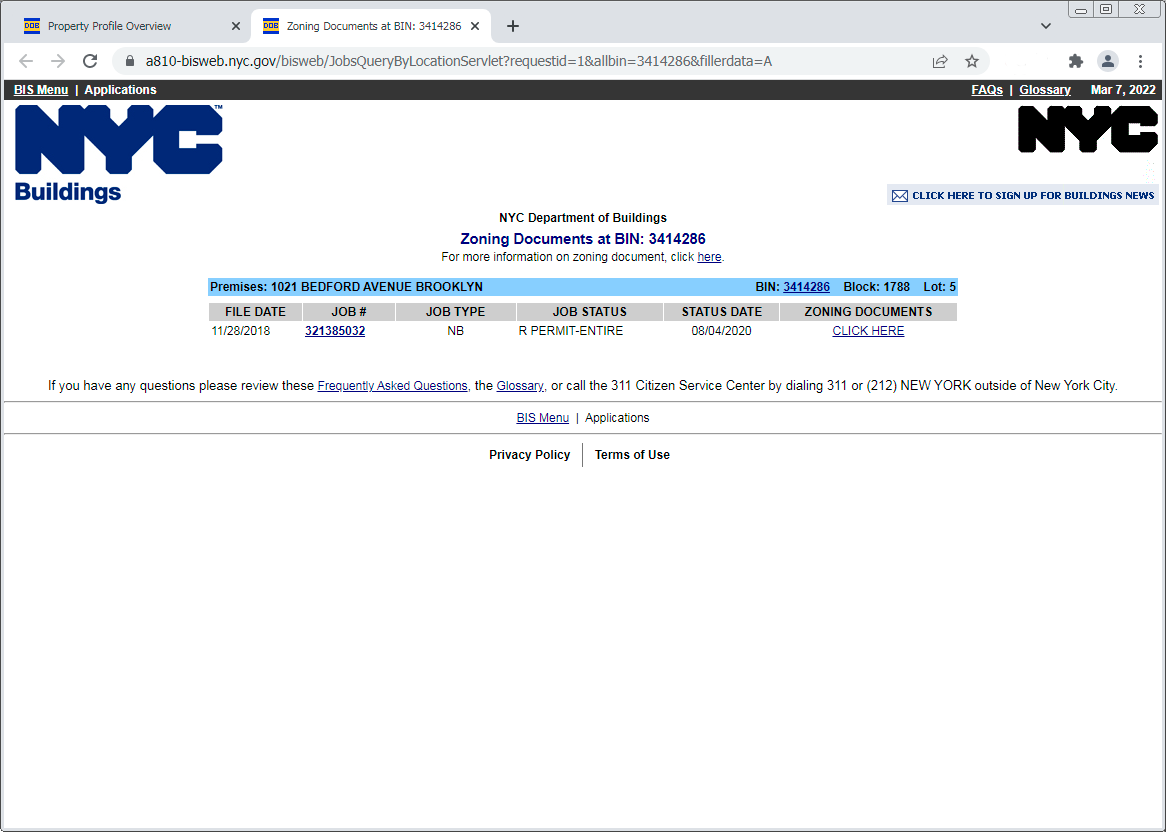
So in addition to the BIN and height, I’ll add some 3D details to this building. Hopefully then, given a sufficiently sophisticated render, the picture will jibe better with reality. Let’s head back to the Property Profile Overview page to see how the public zoning diagrams can help this process. As in Part 1, open the View Zoning Documents link in a new tab:
Again, as before, open the job 320374171 link in a new tab to load the Application Details page. But this time we’ll also open the actual zoning documents from the CLICK HERE link, in yet another new tab, to further investigate details of the building.
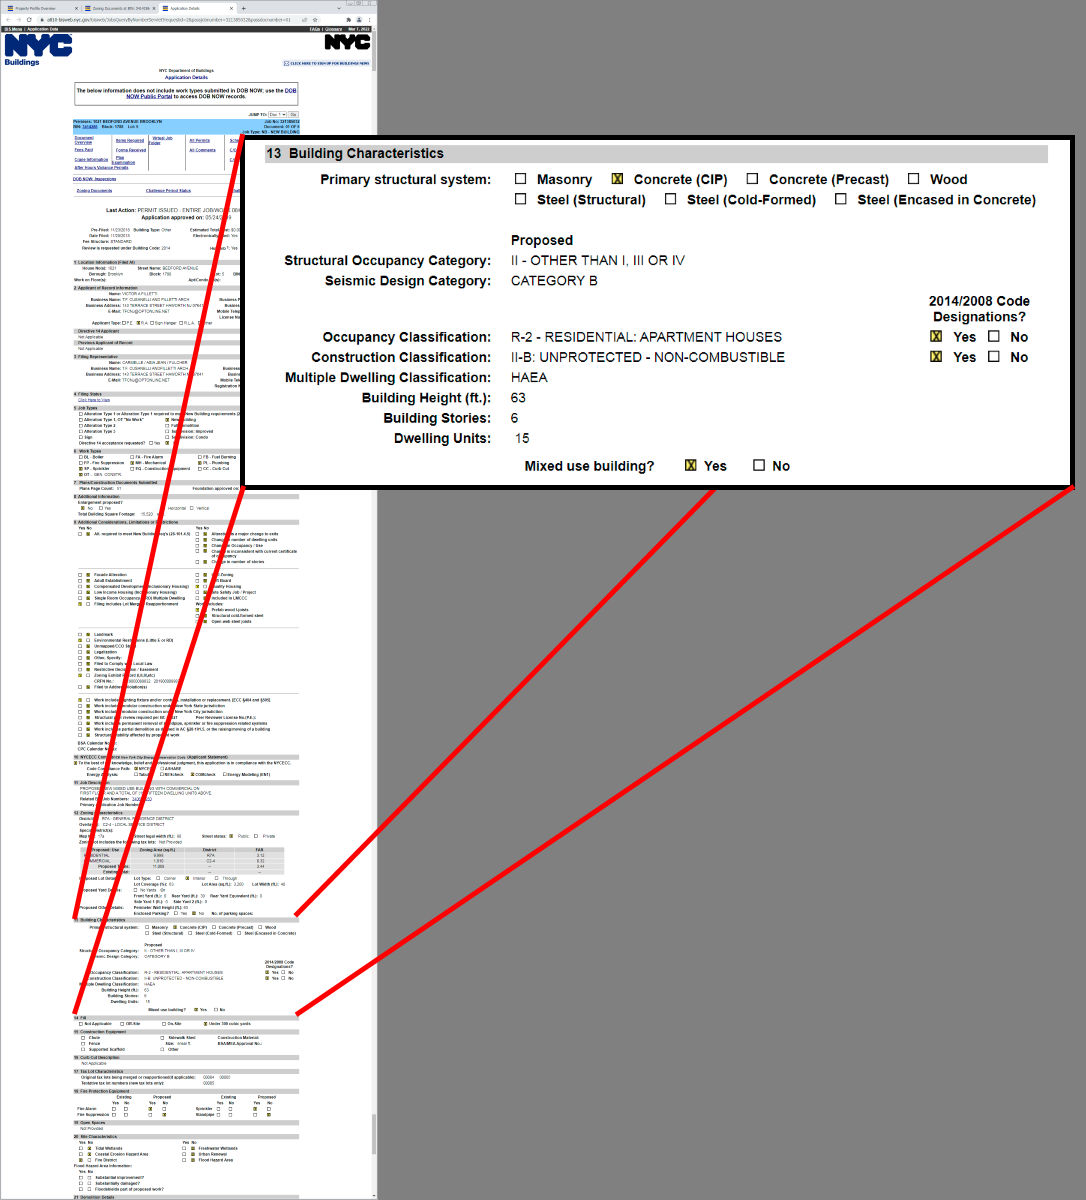
First, though, a quick glance at the section 13 Building Characteristics from the Application Details tab:
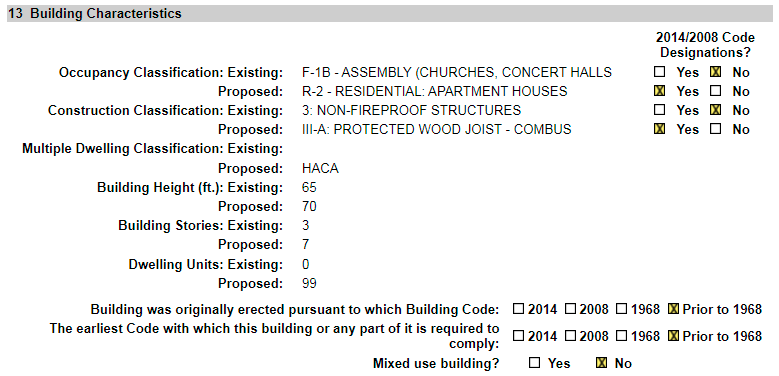
Note the proposed change of occupancy classification from place of assembly to residential. Also note the proposed change in height from 65 to 70 feet, which is surprising because the renovation doesn’t include anything taller than the church building, and the church didn’t grow – in fact, it actually lost the top half of its spire. (The originally imported height of this church splits the difference at 20.5 meters, about 67 feet.)
Maybe we’ll find some clarity by browsing the zoning documents. Click over to that tab:
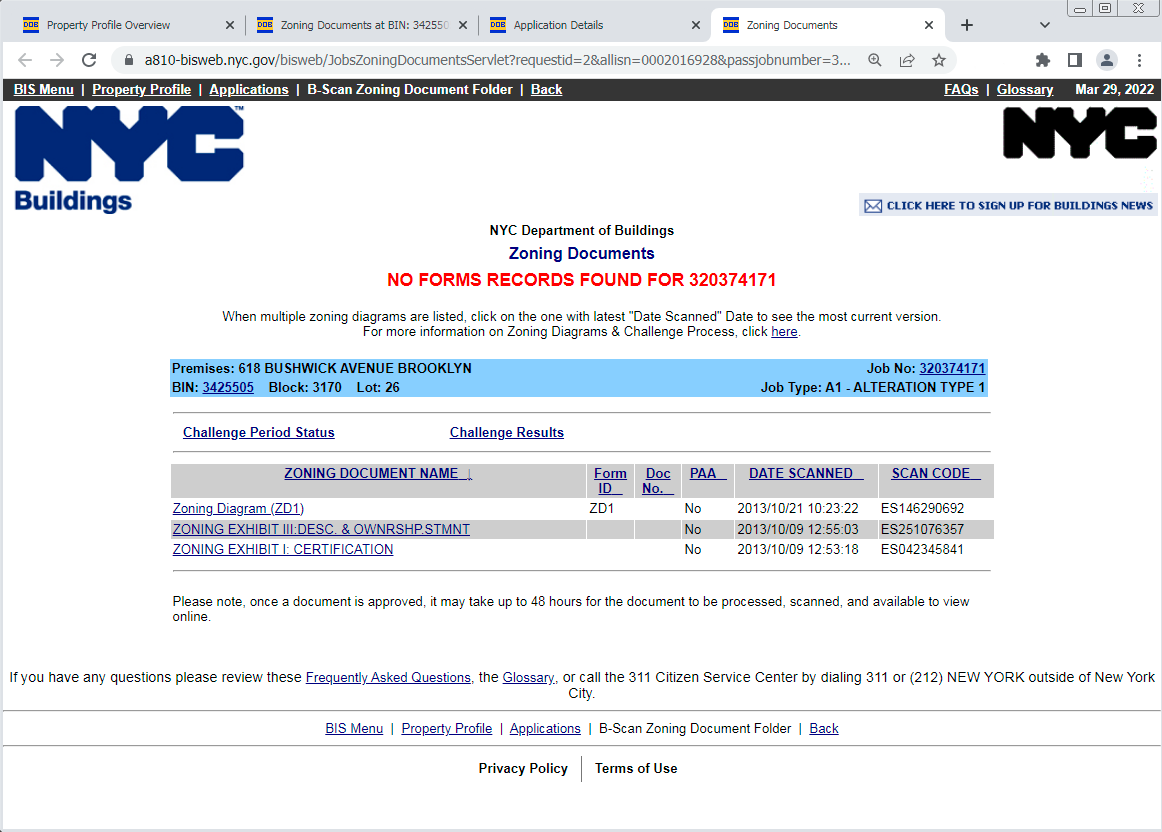
The good stuff is in the Zoning Diagram ZD1. Often there will be multiple revisions of this document listed, reflecting an evolving building proposal. BIS advises you to use the most recent version, but occasionally the newest is just a quick fix that was printed and modified by hand, then scanned at poor resolution, leaving some info illegible. In these cases it might be useful to look at older versions too.
But we only have a single ZD1 for 618 Bushwick. Open the link (in a new tab! if you’ve gotten this far without BIS timing out on you, buy a lottery ticket) to launch the document viewer:
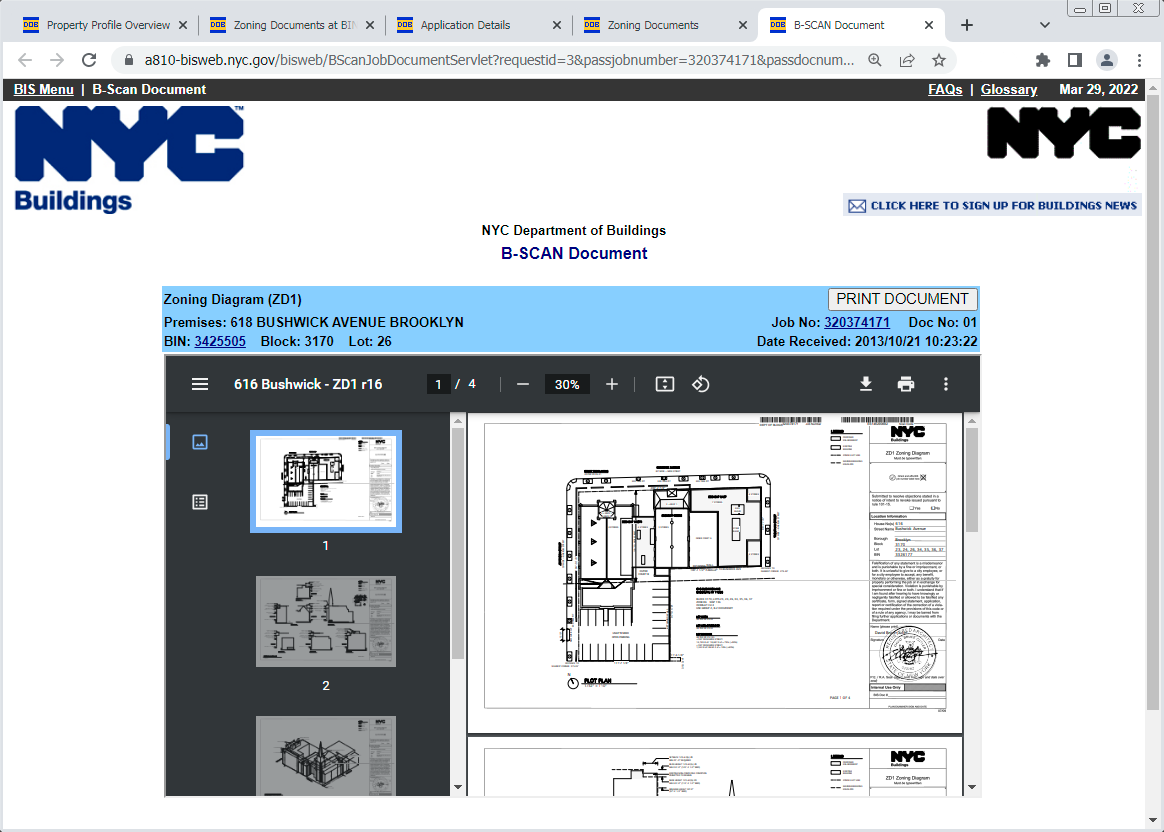
Lovely, but cramped. I recommend downloading the underlying PDF file by clicking the download icon in the toolbar at the top of the viewer box, so you can read it in a native viewer. (And if you want to print, use the print icon in the toolbar, not the “PRINT DOCUMENT” button at the top which will cause the whole page to reload and most likely time out.)
By the way, this PDF lists the old BIN from the church building, instead of the new BIN – don’t use the zoning documents as a BIN reference! It also says 616 Bushwick instead of 618. Larger buildings in NYC usually have one or more ranges of valid housenumbers. Often these alternates are listed in BIS on the initial Property Profile Overview page, but not in this case. (You can see them on the GOAT though – I’ll have to do a diary entry about the GOAT and friends sometime later.) Sometimes a building’s signed address will match neither the BIS Property Profile nor the zoning documents. It’s generally best to tag what’s actually on the building.
Back to the ZD1 PDF… This one, like most, includes three different style building diagrams:
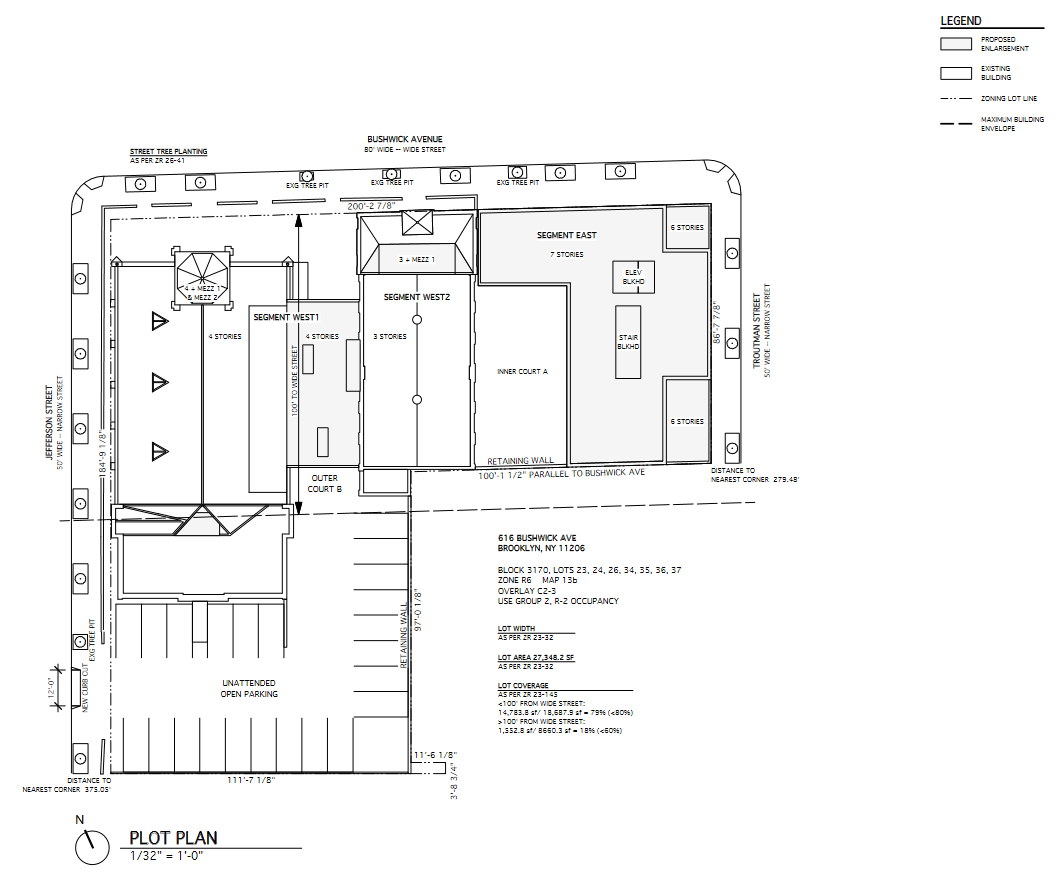
The plot plan (sometimes called “site plan”) depicts the site from above and is helpful when mapping building footprints. One interesting thing to observe from this one is that the newly constructed corner ell segment is not square. Its sides parallel Bushwick Avenue and Troutman Street, which don’t meet at a right angle.
It can also give some insight in the heights of the various building parts, which is useful for 3D mapping. This plot plan shows these heights in stories, but does not give actual measurements. Sometimes the plot plan will also show details of adjacent buildings. This one does not, even though the new corner abuts 17 Troutman to the south.
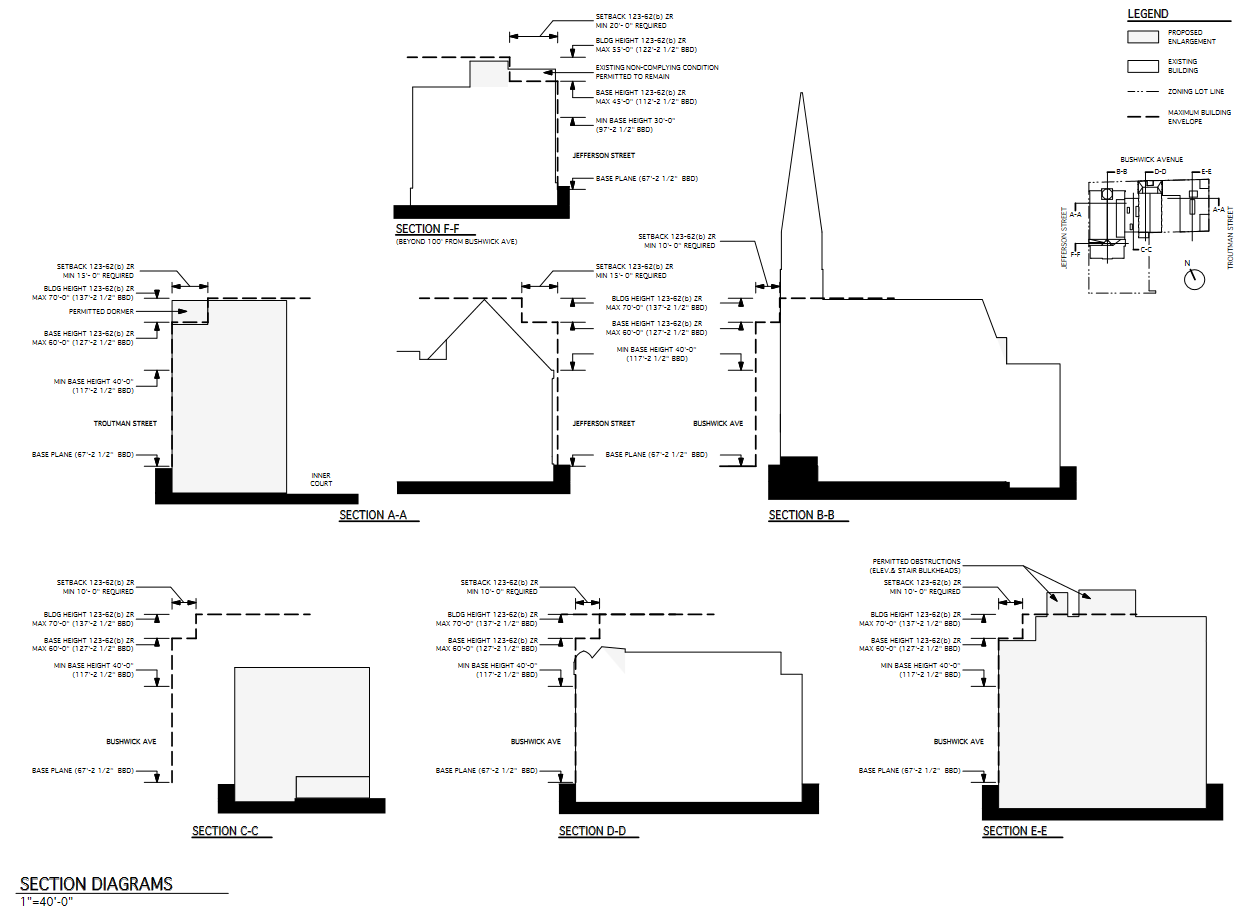
The section diagrams are vertical slices through the structure. Some good details about the roof structure can be gleaned from these, but it can be frustrating – you’ll soon be wishing for more slices (although this one does have several).
These section diagrams include some vertical measurements, but in this case they don’t actually measure the building. Instead, they show how the building sections conform to the maximum dimensions allowed by zoning regulations.
Another thing to note is the slight differences in ground elevation at different ends of the building. Things are pretty flat around here, but in some places the ground terrain can be a real issue with 3D modelling.
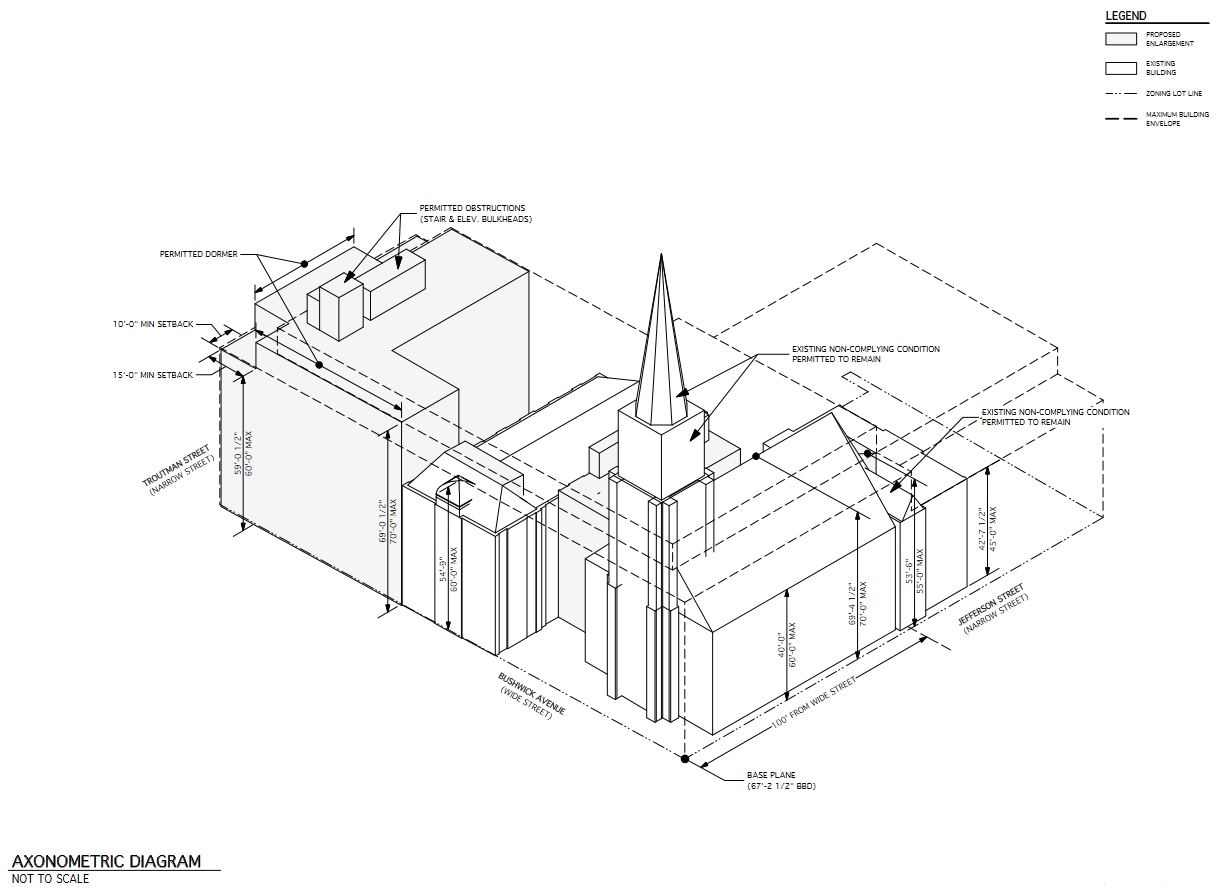
The axonometric diagram is an isometric birds-eye corner view of the building. Sometimes multiple angles are included; here we only have one.
Note that the previous diagrams specified a scale but this one says “not to scale.” Personally I’d recommend against putting excessive faith in the scale of any of these.
Unlike the previous diagrams, this axonometric diagram includes both the maximum permitted measurements and the actual proposed measurements at various spots around the site. Most important for our mapping purposes is the height of the church roof, listed as 69’ 4½” – yet another contender for the height of the building way. There’s no clear explanation for these height discrepancies – maybe different methods of measurement, different precision requirements, or recomputation of the baseplane – but to me this seems like the most authoritative number, so I’ll round to the nearest tenth of a meter and tag height=21.1.
From this diagram, it looks like this development originally intended to keep the full church steeple – maybe it proved unsalvageable or unsafe. Also, it’s clear that the steeple, even in truncated form, is not included in the building height measurements. It’s listed here as a “non-complying condition.” Similarly, the stair and elevator bulkheads on the Troutman end of the building, described as “permitted obstructions,” are not counted toward the building height even though they’re taller than the peak of the church roof. This is normal for NYC – the tagged height of the approximately one million imported building footprints is to the top of the roofline, not including extras.
Ok, I’ve finally completed the quest for BIN and height. Now, following the Simple 3D Buildings schema, I can add some 3D details so maps can better depict the unusual structure of this building. With the ZD1 diagrams, aerial imagery, and photos from my own site survey I have plenty of source material. Per OSM2World, here’s what I’ve arrived at:
See also F4map or Streets GL for a browsable 3D view.
Note that even though I’ve settled on 21.1 meters for the overall building height, the building parts representing the steeple and bulkheads are tagged with larger height values, which the 3D map renderers show correctly.
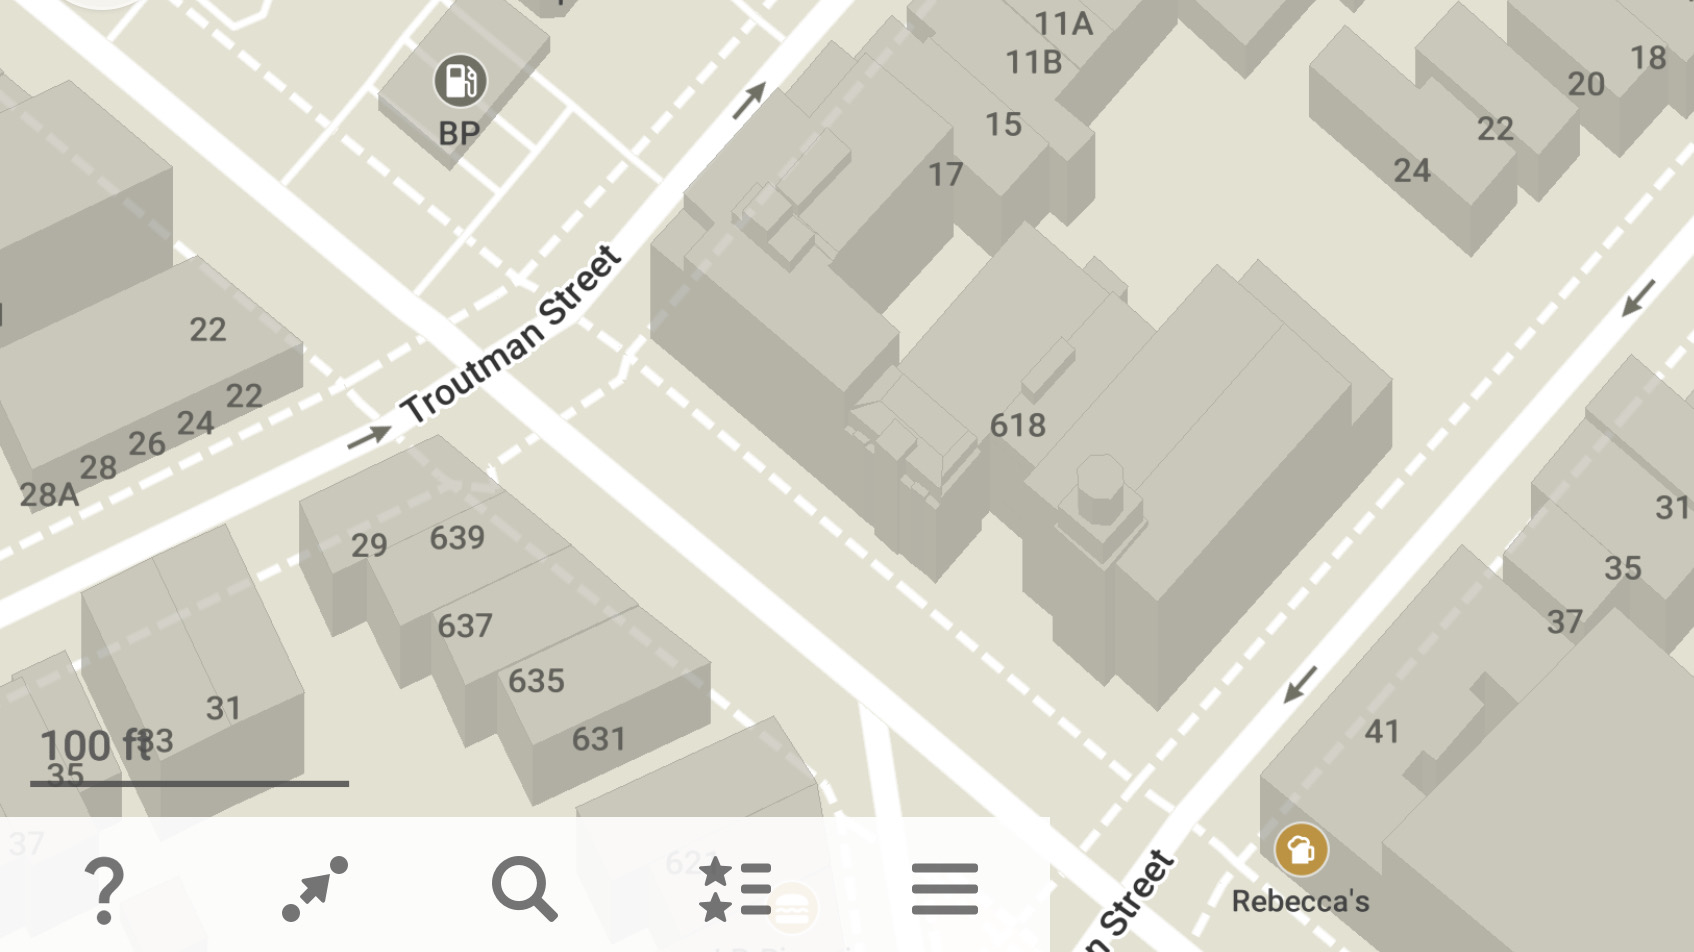
The mobile app Organic Maps shows a 3Dish view that renders the height of building parts but ignores the roof shape tags. The result is nonetheless helpful – it looks somewhat like the actual building:
As old Brooklyn churches go, this one’s actually relatively simple in form. But there are many, many more 3D features that could be added, e.g. the roof dormers, buttresses, details of the rectory in the back. One could probably take a whole day and dozens of nodes trying to approximate the portico alone. But I’m not inclined to go too crazy with it. In the past I’ve occasionally mapped tiny 3D details just because I could, but even with good diagrams like these it tends to involve a fair amount of guesswork and feels close to running afoul of the don’t-tag-for-the-renderer ethos. Currently I only add 3D details that I feel are valuable for navigation.
Anyway, the new 618 Bushwick building is way 1047468252. A couple of finishing touches:
- I went with building=yes rather than a more specific tag. The building tag value should reflect the physical form of the building, and physically this is a Frankenstein monster so no single value would do it justice. Semicolon-separated values for the building tag are in use in some places, but I’m disinclined to try this undocumented tagging technique on a tag that’s in heavy use by software. (I did add building:use=residential though.)
- Both the church and the school were included in the 2009 GNIS node import. Since these buildings still exist in a sense, I added their gnis:feature_id tags (no problem using a semicolon value here IMO) and merged the original nodes into the new building footprint.
This was a good way to demonstrate the use of BIS’s zoning document trove for 3D mapping – but of course it can also be quite useful in normal 2D mapping, for clarifying height and nailing down details of building footprints. Be aware that the ZD1 diagrams are not always fully accurate – give greater credence to your own survey, or to recent aerial imagery. And some will be of much poorer quality, or might not exist at all, especially for older buildings.
Happy mapping everyone!
Location: