My experiences with additional data in mapbox
Posted by dieterdreist on 19 June 2017 in English. Last updated on 20 June 2017.Trying mapbox custom overlays, I was quite shocked from the outcome of my first attempt to show an overlay on mapbox vector tiles.
I have extracted some OSM data to display on a custom map, converted it to geojson with Martin Raifer’s osmtogeojson tool and uploaded it to mapbox via their cli suite (the only reason for using a cli tool for a one time operation is that my geojson is 80MB and mapbox only accepts max. 5MB file size for the browser upload. The cli accepts a geojson in input but doesn’t make a “dataset” of it, it directly converts them into a “tileset”, and that was apparently where the problem lay).
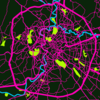
For example the Diocletian Thermal Baths in Rome (a museum), this is the relation in OSM, and this is what I got at first after uploading it to MapBox:  .
.
As you can see, the data in this form would be completely useless (all polygons in the dataset had been defaced in a similar way). This is because of the max-zoomlevel (indicates simplification) set to 9 by default.
Here’s how to workaround: https://www.mapbox.com/help/adjust-tileset-zoom-extent/
Discussion
Comment from tmpsantos on 20 June 2017 at 12:31
For large datasets you can create the vector tiles directly. I recommend using Tippecanoe for converting your GeoJSON to vector tiles: https://github.com/mapbox/tippecanoe
For instance I recently created this old school style map of Brazil entirely using open data from www.ibge.gov.br: https://goo.gl/aoRaar
Comment from dieterdreist on 20 June 2017 at 14:25
Thank you, Tippecanoe seems to work fine.