A few weeks ago pedrito1414 asked me to determine the share of HOT contributions that are attributable to Missing Maps. It took me a while to get around to it… but I finally did. If you follow me on Twitter you may already have seen a couple of these, but here’s the full set.

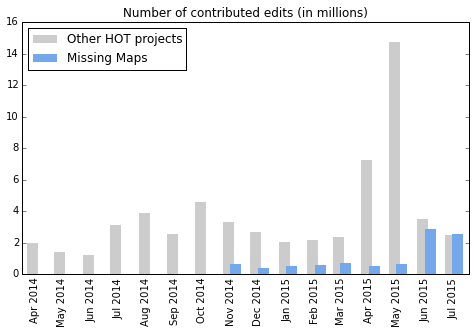
(Interesting to see the post-Nepal uptake in MM activity. I didn’t actually check where this activity is going, but I expect the main driver are the mapping efforts for South Kivu, a new Missing Maps initiative launched in June with a very ambitious geographic scale.)
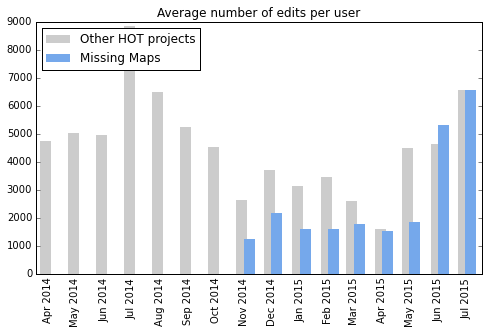
(Note that averages are misleading, it’s unlikely that many MM volunteers actually contribute that much. These contributor stats are typically long-tail distributed, with a small subset of highly prolific users that raise the overall average, and a large number of people who contribute little. In fact a good mantra for any community research is “there is no average user”, partially because of the prevalence of long-tail distributions. Investigating the actual distribution of MM contributions is a task for another day…)

Discussion