
Ward Boundaries in Nottingham
Posted by alexkemp on 25 April 2019 in English. Last updated on 22 June 2022.Useful Links:
- 2019 Ward Boundaries (Nottingham Open Data)
- Nottingham Polling Stations datasets
- All Nottingham Open Data datasets
- HowTo map Ward Boundaries
- Wiki page on OGR
- Aspley Ward
- Basford Ward
- Berridge Ward
- Bestwood Ward
- Bilborough Ward
- Bulwell Ward
- Bullwell Forest Ward
- Castle Ward
- Clifton East Ward
- Clifton West Ward
- Dales Ward
- Hyson Green & Arboretum Ward
- Leen Valley Ward
- Lenton & Wollaton East Ward
- Mapperley Ward
- Meadows Ward
- Radford Ward
- Sherwood Ward
- St Ann’s Ward
- Wollaton West Ward
A useful call-back for me today from Wendy Conibear at the GIS Team in Nottingham City Council (many thanks, Wendy).
Like most cities in the UK, the City of Nottingham is a Unitary Authority (a government measure enacted in 1992 which removed the former multi-tier arrangement of Parish/District/County Councils and which in OSM has led to multiple holes in the administrative map, since no-one can agree how to drag UK admin mapping into the 21st Century) (40% of all UK parishes are Unitary Authorities, which means that they do not appear on the map as there is no accepted mapping for them; that is a dumb position to allow to occur).
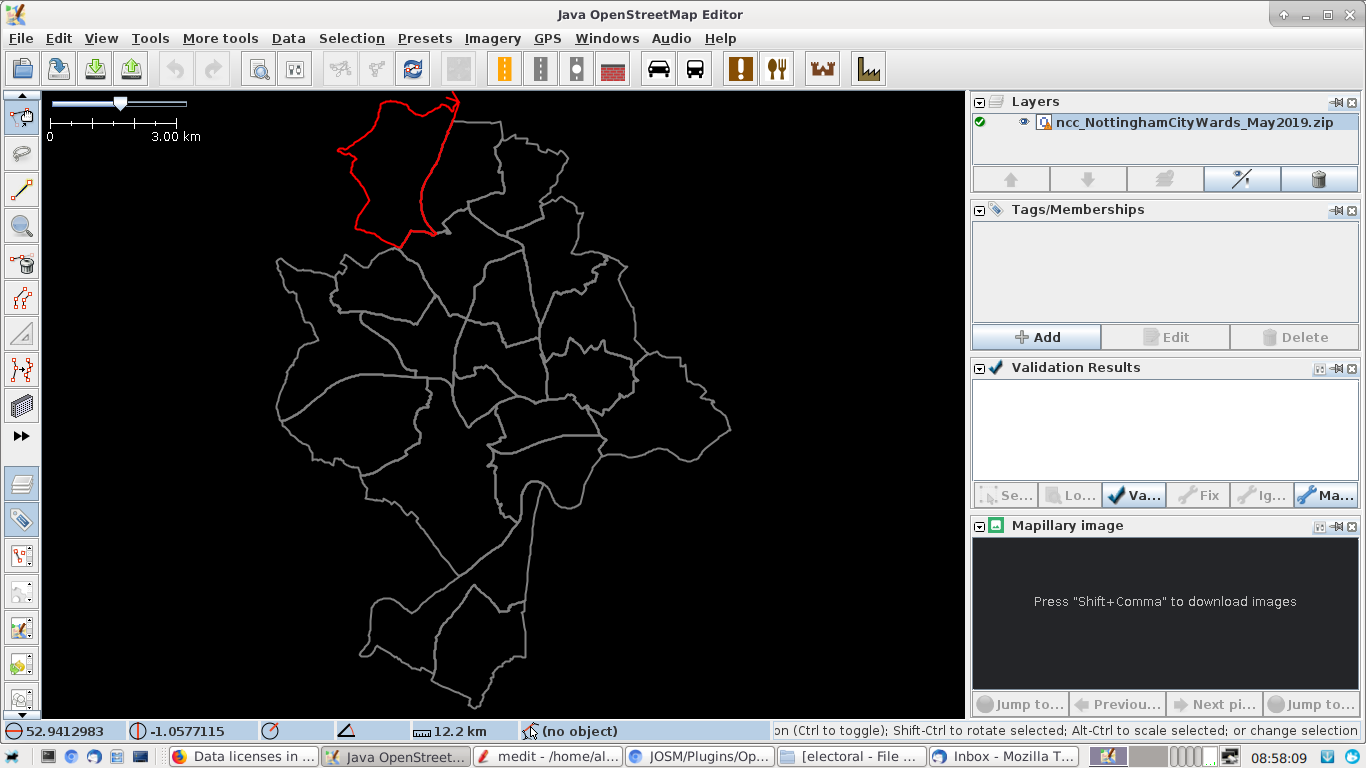
I live within the City of Nottingham Unitary Authority and in March received a bunch of the usual admin spam from them through the letterbox. The spam included arrow, an A3 booklet/magazine for residents. Within the magazine was a couple of pages about the 2 May Local Elections. The bit that caught my attention was a page announcing that last year the City Council’s Ward Boundaries had changed, and that the new wards would be in force for the first time at the upcoming elections in May. However, as best I can tell OSM has zero UK electoral Ward Boundaries within it (29 April update:– that was an accurate statement for the City of Nottingham, but nonsense for at least some of the rest of the UK). So, I made outreach to the council GIS department again and this time received a positive response as outlined at top.
My main questions as I sit here typing this are as to which of the 4 available downloads to use:–
- PDF (not suitable, I think)
- Shapefile
- KML
- GeoJSON
I’ll report back after some research. Your thoughts / comments on the mapping to use welcomed.
Friday updates
My 1ˢᵗ attempt was to produce a GPX file from the SHP (Shapefile) file. I was successful but mein gott! do not recommend it to anyone else (see bottom for all the tortuous detail). There were some very helpful comments to my initial post (thank you EdLoach & SK53) and it turns out that JOSM can import an ESRI Shapefile directly if the OpenData plugin is installed.
The Nottingham Open Data datasets use the OGL (Open Government License), which is fine for OSM to use without compromising it’s map. There are datasets for both Ward Boundaries and also for Polling Stations (+ many others). The bottom RHS of the Ward Boundary page gives a format to use for attribution. Therefore, for nodes/ways/relations I have used the snappy:
source=NCC_OpenData (OGL - Open Government Licence)
source=OGL (ncc_NottinghamCityWards_May2019 shapefile)
…and for the changeset a more lengthy:
source=Electoral Ward Boundaries for Nottm City shapefile, 2019-04-25, licensed under the Open Government Licence (OGL)
It is important to understand that you cannot upload any of these datasets unedited, and for many reasons. As just one example, these particular boundaries all lie within the City of Nottingham boundary, which means that many of them share a good part of their boundary with the Nottingham boundary (and therefore also with multiple other local boundaries). The OSM boundary is not point-by-point identical to the government boundary. This all means that the shapefiles are excellent as a solid reference to copy from, but cannot be uplifted directly.
Next is my working method to install/update these boundaries. Be warned that it is painstaking work and damn slow.
Step-by-Step
- Preparation (after loading JOSM):
• f12 (Preferences | Plugins)
• ☑tick in box foropendata+OK+ restart JOSM
• f12 (Preferences | Display Settings | GPS Points)
• ☐no-tick forDraw direction arrows
• ☐no-tick forDraw a circle from HDOP value
• ☑tick in box forDraw large GPS points
•Single colourforTrack and Point Colouring
• PressOK - menu:File:
• ☐no-tick inDownload OSM data continuously(Shift+Ctrl+f1) - Open the ZIP file containing the Ward Boundary Shapefiles
•menu:File | Open…(orCtrl+O)
• (it will take a little while to process the file) - Click one of the boundaries to highlight it
- Open a new layer in the window
•menu:File | New Layer(orCtrl+N)
• !!! This is very important, as otherwise when you upload your edits it will upload the shapefiles as well, and it is very likely that you will get all your work reversed and your OSM a/c removed !!!
• We now have the shapefiles as a ghost behind the glass of the active layer.
• Updates, additions + deletions to the map are registered into the active layer; make sure that this is the new layer and not the shapefile layer
• Notice that you can also see ghostly arrows at the nodes of the shapefile that is selected; that will be a godsend when you are following that shape and reach a junction, as it will indicate which branch to follow - Navigate to a corner of the highlit shape where you are going to start
- Press
+to zoom-in until you reach the 10m (or less) level - Choose
menu:File | Download in current view - Reactivate
Download OSM data continuously(Shift+Ctrl+f1)
• (we can now tell how well the earlier City of Nottingham shape was mapped) (not very well was the answer, and I had to fix it throughout - my fault) - New sections require the existing boundary to be split (
P) and a fresh line started there following the line (click bloody-click for hour after hour). - Get used to using the
Ctrlkey as you add new sections
• TheCtrl+arrowkeys are used to navigate through the map
• Pressing theAkey switches the cursor into “add a node / extend an existing line” mode
• The default action for adding a node is to merge (join) the node to nearby lines, which with a boundary line is only rarely what you want
• The way to avoid that default action is to hold down theCtrlkey when you click to add another node - Each section is placed into a
boundary=politicalrelation
• (you know that you have it right when the whole list of boundary segments will line up within the relation editor into an error-free circle)
• (check the links for each Ward to see the keys used; I’ve included full addresses within each polling-station, as I assume that folks may want to know that info)
HowTo produce a GPX from an ESRI Shapefile
I found the method above produced a better result, but this is for the record:
-
Unzip the Shapefiles into their own directory:
~$ cd ~/JOSM/electoral ~/JOSM/electoral$ la total 4476 -rw-r--r-- 1 alexk alexk 91369 Apr 25 10:27 ncc_NottinghamCityWards_May2019.zip -rw-r--r-- 1 alexk alexk 83559 Mar 8 16:10 ncc_Polling_Stations.dbf -rw-r--r-- 1 alexk alexk 441 Mar 8 16:10 ncc_Polling_Stations.prj -rw-r--r-- 1 alexk alexk 3712 Mar 8 16:10 ncc_Polling_Stations.shp -rw-r--r-- 1 alexk alexk 1132 Mar 8 16:10 ncc_Polling_Stations.shx -rw-r--r-- 1 alexk alexk 12147 Apr 25 21:28 ncc_Polling_Stations.zip -rw-r--r-- 1 alexk alexk 5 Apr 25 07:00 Wards_New_May_2019v2.cpg -rw-r--r-- 1 alexk alexk 22798 Apr 25 07:00 Wards_New_May_2019v2.dbf -rw-r--r-- 1 alexk alexk 922510 Apr 25 14:05 Wards_New_May_2019v2.gpx -rw-r--r-- 1 alexk alexk 417 Apr 25 07:00 Wards_New_May_2019v2.prj -rw-r--r-- 1 alexk alexk 316 Apr 25 07:00 Wards_New_May_2019v2.sbn -rw-r--r-- 1 alexk alexk 132 Apr 25 07:00 Wards_New_May_2019v2.sbx -rw-r--r-- 1 alexk alexk 207988 Apr 25 07:00 Wards_New_May_2019v2.shp -rw-r--r-- 1 alexk alexk 41807 Apr 25 07:00 Wards_New_May_2019v2.shp.xml -rw-r--r-- 1 alexk alexk 260 Apr 25 07:00 Wards_New_May_2019v2.shx -
use OGR to convert the SHP to a GPX
ogr2ogr -nlt LINESTRING -skipfailures -f GPX -s_srs EPSG:27700 -t_srs EPSG:4326 Wards_New_May_2019v2.gpx Wards_New_May_2019v2.shp -dsco GPX_USE_EXTENSIONS=YES
The command above worked fine, but only after I spent >1 hour bashing my head against the following original error message:
ESRI GPX ERROR 1: Latitude 342520.360000 is invalid. Valid range is [-90,90]
The clue to this error is that OGR needs to convert the Shapefiles from the supplied Ordnance Survey reference system (EPSG:27700 == “British_National_Grid”) into the standard GPX reference system (EPSG:4326 == “WGS84 datum”). PRJ files are “ESRI coordinate reference system” files, and OGR should be using those files to determine the source reference system, but that clearly failed.
Research turned up http://prj2epsg.org/search as a “service for converting well-known text projection information from .prj files into standard EPSG codes”, and it worked a treat. Adding in the -s_srs EPSG:27700 (source) and -t_srs EPSG:4326 (target) segments both got rid of the error message and produced a valid GPX file.
OGR itself was obtained by installing QGIS (a GUI for GIS). I would very much have liked to have used QGIS to have performed the conversion, but it has an extremely high learning slope and I could not do it.
Saturday Update
Polling Stations are registered within the Ward Boundaries HowTo. I first placed them within the Ward relation as ways, but on uplift the validator complained that the relation “contained a way that was neither an outer nor an inner”. For the next Ward I added a node on top of the way and placed that within the relation instead. I got another error, it was simply a different one. It seems that Polling Stations are not yet an official part of Political relations.
I’ve reverted to placing `polling_station=yes` polling_station=20190308 into a way and placing the way into the relation (3 May update: the CREATE_DAT value within ncc_Polling_Stations.zip is 20190308). Eventually the whole thing may get regularised & maybe even appear on the map without having to be searched for. In the meantime the Ward can be seen if the relation URL is known (see top). Polling Stations ways then show as their outlines whilst nodes (including the label) look like bomb-blasts (or something).
Monday Update
All 20 Nottingham city Ward boundaries have now been added to the map.
I will now go through them again for the 2ⁿᵈ time adding polling stations. At the same time each added boundary + existing boundaries will need checking to make sure whether they need repair or not due to the many splits performed as the new ones were added. That could be naughty as many scores of boundaries are involved; what joy.
The Nottingham KML files are Suspect.
I sent an email to Wendy Conibear at the GIS Team in Nottingham City Council today:–
this email is because of discrepancies discovered between the SHP + KML files.
Whilst the ESRI Shapefile matched very closely indeed to earlier county boundaries produced from OS OpenData, the KML file is upto 2m adrift north-south and ~30cm east-west.
That could be due to processing errors or perhaps an endemic difference between the files. I have zero experience to bring to bear, hence the email to Wendy. It is a shame as the KML files do have text within the shapes which appears within JOSM when they are selected, whilst shapefiles are empty of all text in JOSM.
Tuesday Update
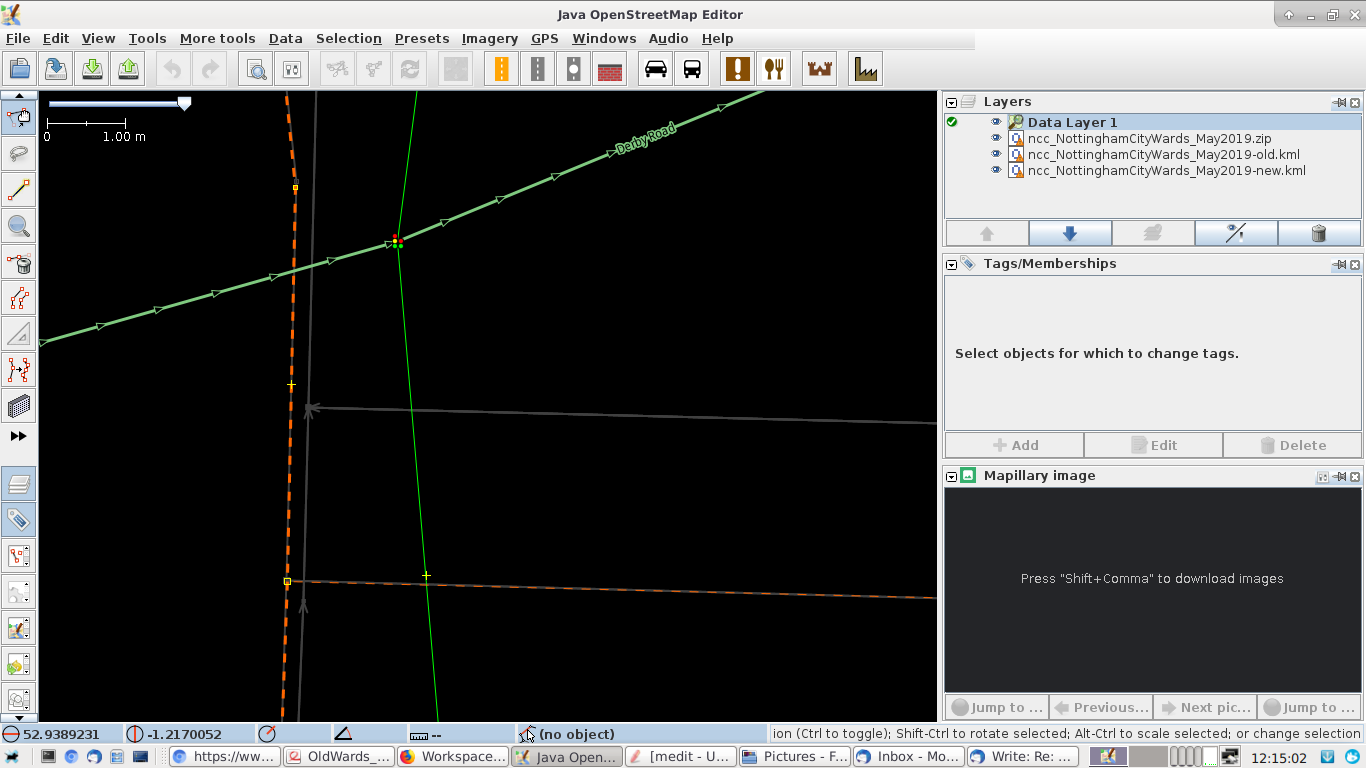
Wendy made a fast response to my email by re-exporting the KML file, but AFAICT the new file was identical to the old down to the 1cm (0.01m) level. You can perhaps get a handle on the problem here by looking at the following screenshot:–
This is a live screenshot of JOSM at the point where the Wollaton West and Wollaton East Wards meet the City of Nottingham boundary (paradoxically they are horizontal here), next to the Priory Island roundabout on Derby Road. The ESRI Shapefiles underlie the dashed-brown Boundary lines, whilst the KLM boundaries are each shown in grey. The Nottingham Boundary is a thick vertical line whilst both Ward Boundaries are thin horizontal lines. You can see that the N-S geometry between the two formats has a difference of upto 3cm, which is unacceptable.
In the afternoon I decided to use my newly-acquired OGR skills to see if I could produce my own KLM file. It worked! Differences between the SHP & KLM geometries were now just ~2mm N-S. I’ve sent the file to Wendy.
This is the command that produced it; it uses the NCC Ward shape fileset which was earlier expanded into the directory, and the new KLM shows text for the Ward just like the old when selected. Result!
ogr2ogr -f KML -s_srs EPSG:27700 -t_srs EPSG:4326 ncc_NottinghamCityWards_May2019.kml Wards_New_May_2019v2.shp
Wednesday Update
Wendy has added the KLM file to the NCC site to make it generally available
Friday Summary
20 wards added, then cleanup + polling stations entry + label entry completed for each + all affected boundaries along the circle integrity checked.
Yesterday (2 May 2019) were local elections throughout the UK, and these were the first to use the newly redrawn Wards. I still had 2 wards to add polling_stations to at the end of that night. Damn!
Just like Civic Parish (CPs), which are the fundamental building blocks for all of the civil administrative boundaries that make up the structure of this Kingdom, Ward Boundaries are the fundamental building blocks for all of the political boundaries that make up the structure of this Kingdom, whether at the local, national or supra-national level.
It is terrifying how long each Ward takes to add. Now that I’ve got the KML file it is relatively quick to add the wards, but my goodness, the polling stations take forever to do a full job on them. Most still need contact details adding, but that is true of most PoIs in Nottingham.
Discussion
Comment from EdLoach on 25 April 2019 at 13:09
I don’t know whether I have a plugin installed or not, but JOSM seems to have an option to open .shp files. I don’t know how or whether it will cope with the Nottingham shapefiles using OSGB projection. When I last used shapefiles some years ago the instructions at https://wiki.openstreetmap.org/wiki/Using_OS_Shapefiles were helpful
Comment from EdLoach on 25 April 2019 at 13:12
Can’t work out how to edit my last comment, but I suspect it is the opendata plugin that adds shapefile support https://wiki.openstreetmap.org/wiki/JOSM/Plugins/OpenData
Comment from SK53 on 25 April 2019 at 14:24
Yes, use a shapefile, and quick tests suggests that EPSG:27700 works . Geojson should be in 4326 so this would be a reasonable fallback. Either way you need the JOSM OpenData plugin. I presume the Nottingham OpenData ones are just an extract from OS Boundary Line Ward District Region.
Wards have been tagged with boundary=administrative and admin_level=11, but I think boundary=political is probably better as they are not really stable entities (lasting no-more than 20 years or so).
It may be even more useful to go over polling station locations. I imported a set IIRC in 2010, but from time-to-time find one which is not properly located. The tagging may have improved since then as there have been activities in several countries to add polling stations. I think the data is available on the Nottingham Open Data Portal.
Comment from alexkemp on 25 April 2019 at 23:32
Thanks, Jerry. Before your comment I managed to convert the .shp to a .gpx but it was damn fiddly. I much preferred the plugin and how it looks. My one disappointment is that no text is carried across into JOSM although it is within the shapefile.
I’v used
admin_level=11within the current mapping but agree with you on changing toboundary=political. I also downloaded the polling station locations after reading your comment and have added two for the first ward. However, I have to add nodes as currently I have them as buildings.Lord, but it is a slow business.
Comment from SK53 on 26 April 2019 at 11:16
It should bring the Shapefile columns in: most just need discarding, but it’s usually possible to rename useful ones (a lot of OS data has a name1 and name2 fields, where the second one only gets populated in areas with bilingual names). HTH
Comment from alexkemp on 26 April 2019 at 14:03
No it doesn’t, Jerry. I want to be able to either see it at the centre of the shape or to be able to confirm the details in the key/value columns but there is, simply, nothing there. The SHP files are an improvement on the GPX because they can contain a phalanx of inter-locking shapes and each shape can be selected individually, whereas the GPX is just one huge line. However, neither has ever shown the attached text, even if it is in the file, which it is with the NCC datasets. The Polling Stations do have text attached to the nodes.