
Globes, gores and geojson (topojson)
Been thinking about this for a while. Like maybe two years. How do you make a globe using openstreetmap data? So when I say think, I mean a quick way to hack this together using lots of other peoples hard won code.
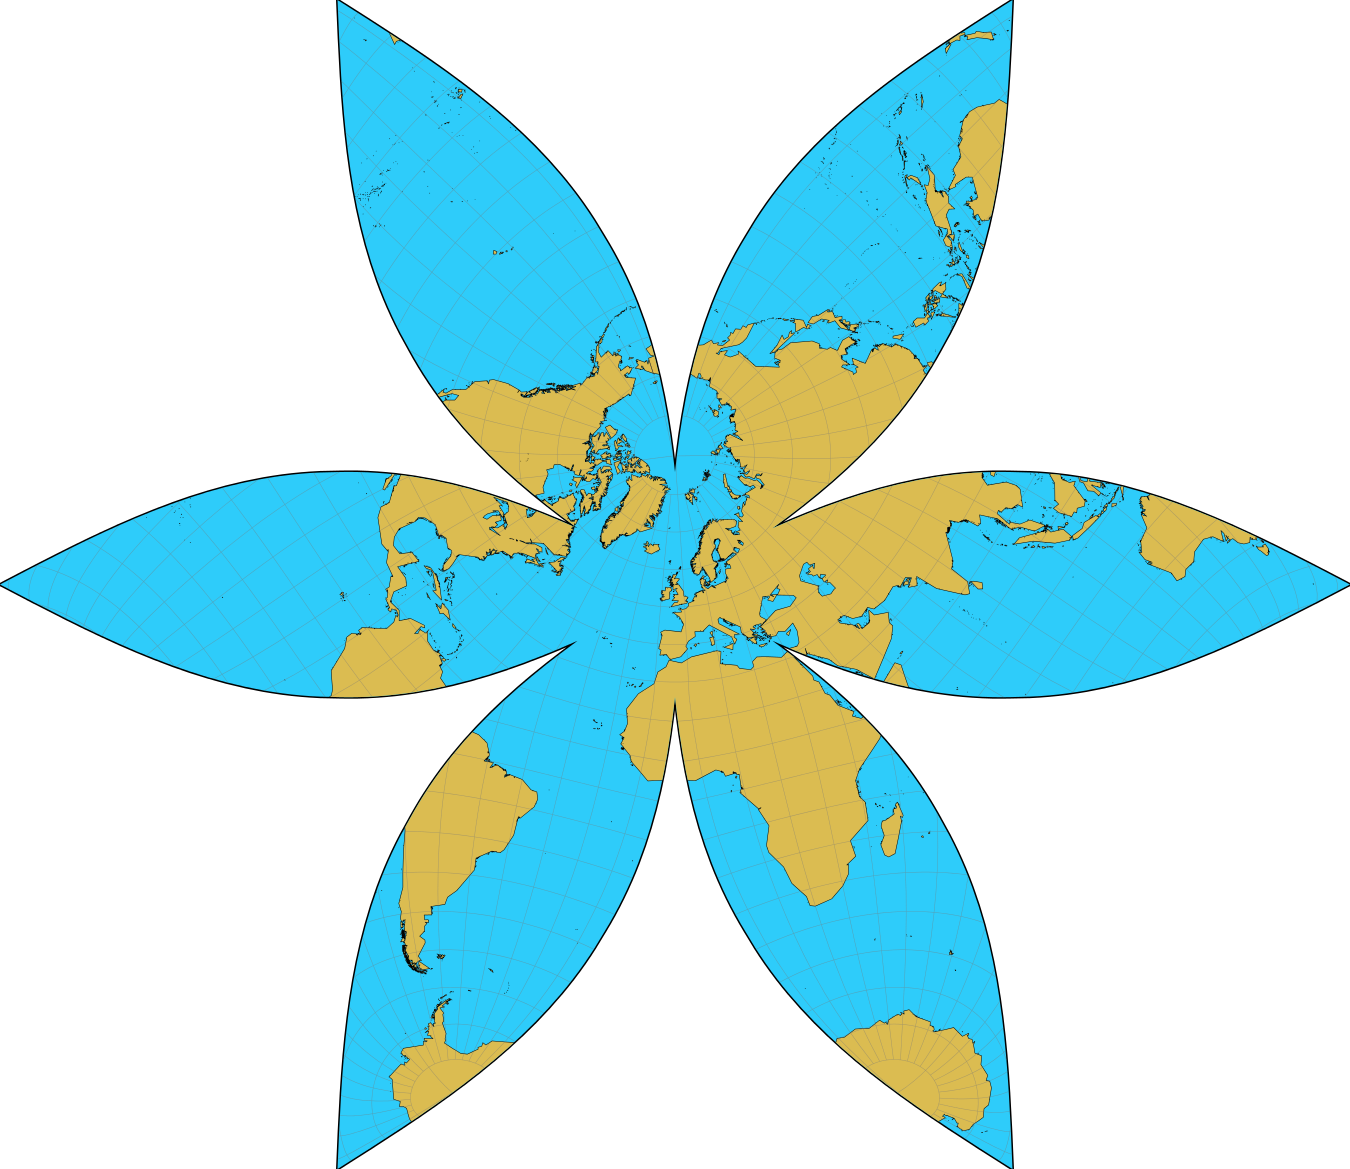
According to what I could find, the main thing was to create ‘gores’ these are the name of the thin oval shapes that make up the outside edge of the classic ‘orange’ segments.
So I googled it a while back and found a perl script for Gimp that appeared to do the trick. At the time, it seemed very involved and I hardly knew much about writing scripts etc (although reading about again - it now seems more straight forward). So I put the idea on the back burner for a while
The next approach seemed to be using Generic Mapping tools (GMT). Which also has a way to stitch gore projections together. But the first time I attempted using GMT, I had issues installing it. Once I got it running it has a bit of a learning curve and lots of interesting file formats…After a short battle, I abandoned my attempt at trying to get it to work.
So it would be nice to do in QGIS using the proj4 library. But unfortunately, it doesn’t work for gores like projections. In the business they are called ‘interrupted’ projections because the map is not just stretched but split into pieces. It is possible I believe to project one gore at a time and stitch together (sounds like a python script waiting to happen).
By this time, I’d spotted a javascript plugin for D3 that looked promising call d3-geo. Seriously, go there straight away and look at it. Recently a projection called ‘gingery’ was added. Again, go check it out.
Anyway, the d3-geo has lots of examples and it was easy to use or maybe my knowledge is somewhat more advanced now. It was possible to tweak the examples and see how they work. Although the core projection mathematics is still way out of my league. But thanks to Jason Davies and Mike Bostock who created them - absolutely amazing.
The next stage was to get some OpenStreetMap data. But that was no problem, using openstreetmapdata.com (thanks Jochen Topf). This gave a shapefile of the basic global land polygon using OSM. I decided to simplify this using QGIS - but this step is not really necessary. After simplifying I was left with a file called simpleworld2.shp but D3 required topojson format. So on a linux type system, first you need to installed Node.js (I had this already), then install TopoJSON:
npm install -g topojson
then using the topojson guidance I used this command
topojson -o output2.json simpleworld2.shp
Converting to topojson greatly reduces the file size. You can now reference the output2.json file within the example given on the d3-geo site.
If you want my html/javascript example, osm based world topojson file or the svg of the above image see my repo here
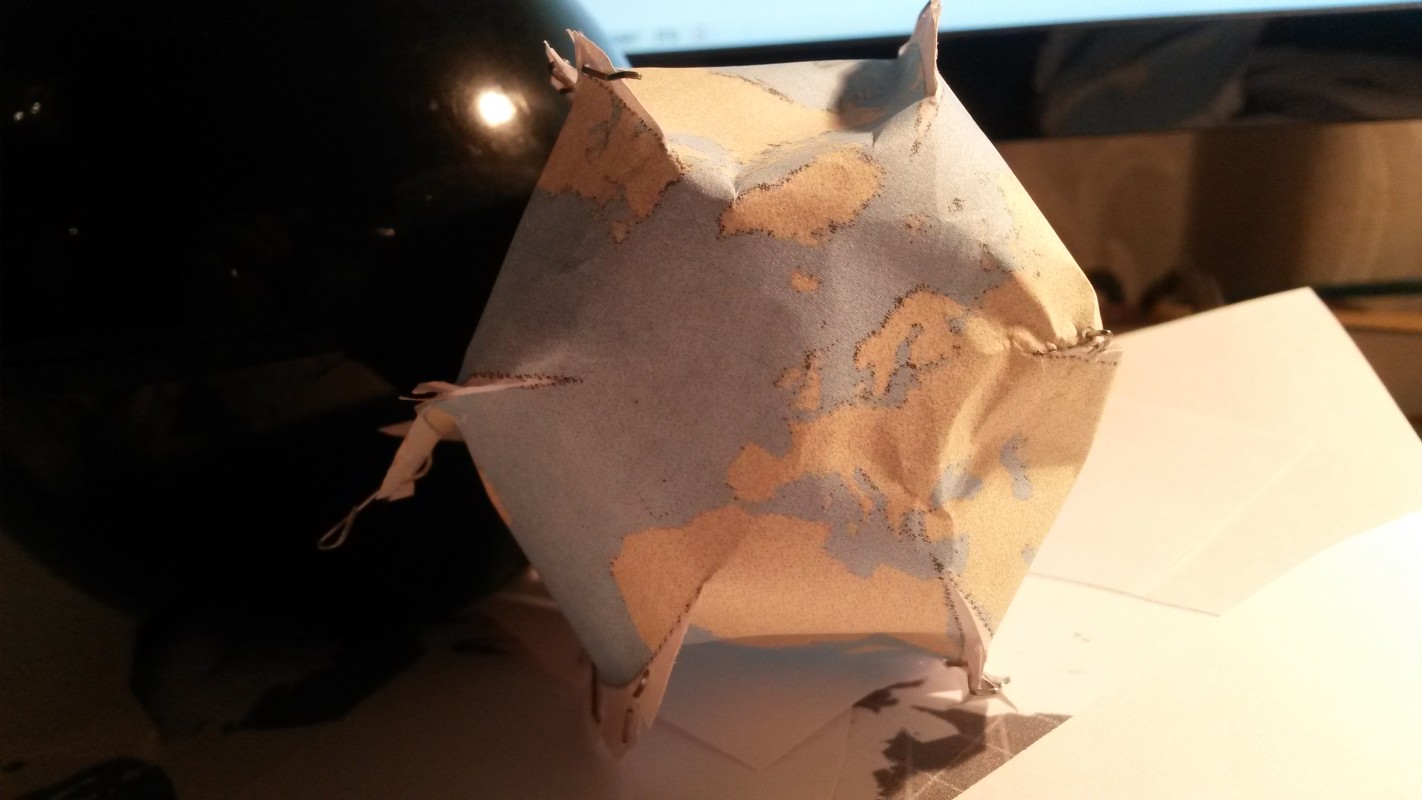
Now get busy with staples and glue!
p.s. looks like there are other ways using [Wolfram / Mathematica/ Matlab] (http://gis.stackexchange.com/questions/15639/what-projections-should-i-use-to-make-my-own-globe) examples.
Discussion
Comment from SomeoneElse on 12 November 2014 at 14:15
I wonder if that photograph would make a suitable “Image of the Week”?
http://wiki.osm.org/wiki/Featured_image_proposals
(it would need to be released under an open licence though as per that link)
Comment from Hawkeye on 12 November 2014 at 17:56
Thanks, You’re welcome to propose it. This was one of my first attempts, I’m hoping to put together some images this weekend. So maybe have something more interesting to post in coming days.
https://wiki.openstreetmap.org/wiki/File:Rough-edges.jpg