OpenStreetMap logo OpenStreetMap

manings's Diary

Recent diary entries

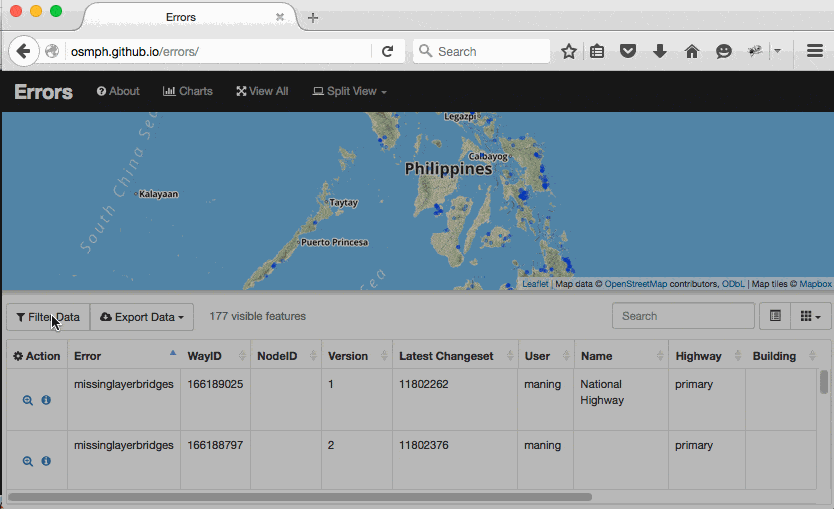
OSMCha has this great feature of watching edits around your neighborhood using the bounding box (bbox) filter. Today, I reviewed several edits using the combination of bbox and the new mapper flag.

screen shot 2017-04-10 at 16 07 54 </br>New mappers in the Philippines in the last couple of days

Note: Being a new mapper does not mean making bad edits per se, but by being new, we can commit errors because of unfamiliarity with the best practices of editing. Admit it old mappers, we made mistakes before. ;)

As I review each changeset, I often fix common errors based on my familiarity with the area. After fixing, I usually add a comment to the user’s changeset explaining my edits and encouraging them to continue contributing to the project.

See full entry

Back in July, we talked about the Los Angeles building import hitting > 1 million mark for LA City and last month, we already imported 2 million buildings covering the rest of the county. We are not finished yet ;)

Read on for what we are doing in the last couple of months.

la_3d
Downtown LA City in 3d

MaptimeLA in Catalina Island

The local community through @MaptimeLA has also been busy validating the data on the ground. A few of them took a ferry to Catalina Island for an awesome mapping weekend! Aside from validating the imported buildings, they added local features and Mapillary street/trail level photos across the island.

See full entry

Location: Middle Ranch, Los Angeles County, California, United States

Fixing split buildings in LA

Posted by manings on 9 August 2016 in English. Last updated on 10 August 2016.

Last time, we talked about how we imported over 1 million buildings in LA. Watch this video from our SOTM-US talk. In this post, we’ll talk about our ongoing cleanup.

No data is perfect, the quality of what we imported in OpenStreetMap was generally good, but in all things data, there will always be unexpected cases.

During the import trials, we discovered that the LA City data was split to the parcel boundaries resulting to small polygons that should be part of the larger building (see: #71). We fix this during the import by using the Auto-tools plugin in JOSM but there were cases when it wasn’t fixed.

screen shot 2016-07-21 at 11 47 25

Detecting split buildings

We ran a detection for split buildings by analyzing size and shapes of buildings using OSM-QA-tiles, turf and tilereduce. A sample output looks like this:

See full entry

Location: Nevin, Central-Alameda, Los Angeles, Los Angeles County, California, 90011, United States

1 million buildings in Los Angeles

Posted by manings on 19 July 2016 in English.

Part of our series of diaries sharing experiences on the ongoing LA Building Import into OpenStreetMap. Last month, we talked about the tools. Today, it’s all about the data.

Just last week, we’ve hit 1.1 million buildings imported in LA City!
A great milestone as we are in the final stretch of import, validation and clean-up for LA City. Here’s a few map-shots on what happened in the last couple of months.

What happened?

We made sure that the import process followed the community accepted guidelines. Instead of importing everything with scripts/bots, we used the Tasking Manager to allow volunteers to take part. We divided LA City into four TM projects and organized mapathons within LA City to kick start the process. The animation below shows the weekly progress starting from Southside all the way to SF Valley. Large chunks of buildings were added during and after every mapathon.

time
Weekly progress, March - July 2016.

See full entry

Location: University Park, Los Angeles, Los Angeles County, California, 90089, United States

living_street
A typical living_street in Bangalore.

It’s been a couple of months since I moved to Bangalore. Naturally, with a new neighborhood comes an opportunity to map and improve the data! When I first came to this side of the city, OSM coverage was fairly good. Streets were marked and buildings were traced, but no other detail was there. It lacked street names, POIs and neighborhood names. So during my daily commute, I try to add a few details to make it much more updated and useful.

Mapping a totally different place comes with challenges that break many of your assumptions. Here’s a few things I found amusing, interesting and at times confusing as I navigated around this Indian city.

Colours everywhere

See full entry

Location: N Thyagaraju Layout, Cooke Town, Bengaluru, Bangalore North, Bengaluru Urban, Karnataka, 560033, India

Building tools for LABuildings Import

Posted by manings on 30 June 2016 in English.

This is a part of a series of diaries sharing our experience on the ongoing LA Building Import into OpenStreetMap.

In the last 2.5 months we started importing building footprints over Los Angeles from open data available in LA county. Discussions about this import started early last year, after several discussions, planning and trial runs, we finally started the import this April. From its start, the import team agreed that this will be a community managed import. The goal is not only to improve building coverage of OpenStreetMap within the county but also to invite local mappers to actively participate in the whole process.

In this post, I will talk about the tools we built to coordinate this massive import. Many of the processes were based on an earlier buildings and addresses import in New York City with modifications needed due to the difference of data and the context of the local community.

Data sources


3 million buildings in LA County.

See full entry

Location: Crenshaw, West Adams, Los Angeles, Los Angeles County, California, 90008, United States

Your OpenStreetMap Story

Posted by manings on 19 March 2016 in English.

Over the years, people ask me how I started and what have I done so far in OpenStreetMap. I tried to capture this in an earlier post.

Wouldn’t it be nice to have a template for your OpenStreetMap elevator pitch? Inspired by an old discussion and The Open Source Report Card, I looked at Pascale’s HDYC numbers to tell a story about your OSM journey.

Stories unlike numbers, are kind of imprecise, fuzzy and sometimes exaggerated. ;-)
This is the challenge of this exercise. How can you tell your OpenStreetMap story this way?

So I made something out of OpenStreetMap data, and, it’s not a map.

prosm

Click the image to see video

Try it out! Use this as a boilerplate and fill in the details of your OpenStreetMap story.

The code is messy/buggy but somehow works. Don’t take the numbers seriously, this was just a fun hack. :)

OSM-PH Error Dashboard using OSMLint

Posted by manings on 16 January 2016 in English.

Using OSMLint and vector tiles, I made this simple dashboard to display and fix common errors.

http://osmph.github.io/errors/

errors

Dashboard is based on Fulcrum Map’s Geojson Dashboard. I hope the OSM-PH community can find it useful.

You too can build your own for your local mapping community.

Basic ingredients are:

  1. Get data as vector tiles: http://osmlab.github.io/osm-qa-tiles/
  2. Process data with OSMLint: https://github.com/osmlab/osmlint
  3. Configure your dashboard: https://github.com/osmph/errors/tree/gh-pages

Keep on fixing the map!

Missing Maps Workshop at Mapbox-BLR

Posted by manings on 9 November 2015 in English.

Our Mapbox-Bengaluru office celebrated International Open Access Week last month with a data gallery and a mapping workshop. I co-lead the mapping workshop as part of the Missing Maps project. I penned these notes to remind me in the future how to run our workshops even better. I figured, why not share to everyone?

2015-10-21 15 32 25

What we talked about

  • OSM is a volunteer/community driven project, mainly for fun and exciting ways.

See full entry