How to Tell a Story | a recap of my SotM EU 2023 presentation
Posted by courtiney on 19 November 2023 in English. Last updated on 20 November 2023.I am continuously surprised by how few people outside of the community know the story of OpenStreetMap. Coming into this community from a world of writers and communicators who spend their days spinning up stories–some of them more worthy than others–sometimes feels like visiting another planet. For writers, the worst crime is what old time newspaper editors used to call “burying the lede”, meaning hide the thing that makes the story interesting. OSM might just be the biggest buried lede in the history of storytelling.
It’s surprisingly hard to tell a good story. Everyone can type an email, but not everyone can make it interesting enough to read. Stories tend to have a “beginning, middle and end,” but so do research reports, tax forms, and parking tickets. Facts and data can add up to a story, but not without interpretation. Telling someone “about” something is not a story, either. If I tell you that the Lord of the Rings trilogy is about a hobbit who travels to the ends of the world to get rid of a magic ring, would you know what happened in the story?
This is why I was at the State of the Map Europe in Antwerp, Belgium last week to talk about storytelling.

Part 1: What is the Problem?
The “problem” at the heart of your story doesn’t have to be a catastrophe or even especially challenging, it just has to be the thing that causes an action.
It could be that you see the world as a map topology, which means you notice when things are missing and could cause confusion or discomfort: street signs, roads, railways, address points, cooling stations, electric vehicle charging stations.
Maybe it’s something even more simple: you enjoy using public bookcases and find it annoying that you have to pay to register a public bookcase on the official “Free Little Library” map.

Maybe it’s something that is urgent: a devastating earthquake has happened and emergency vehicles can no longer use existing maps to find and help people.
Maybe the problem comes in the form of a villain: you’re frustrated by the UK Ordnance Survey, which won’t release its data for free, so you need a different way of getting geospatial data.
In Antwerp, my particular problem was that my presenting partner, Kate Varfalameyeva, a Belarusian Youthmapper, based in Arizona, who is an expert on social media, found out at the last minute that she wasn’t able to attend. This meant that I wasn’t going to be able to deliver the presentation that we had planned. Kate is the one who knows how to leverage social media to create influence. I’m the one who specializes in using stories to build brands. Without her, it was much more difficult for me to present data-driven, actionable steps for building an ambassadorship program.
A good story always starts at the intersection of what you want the world to be and what it really is.
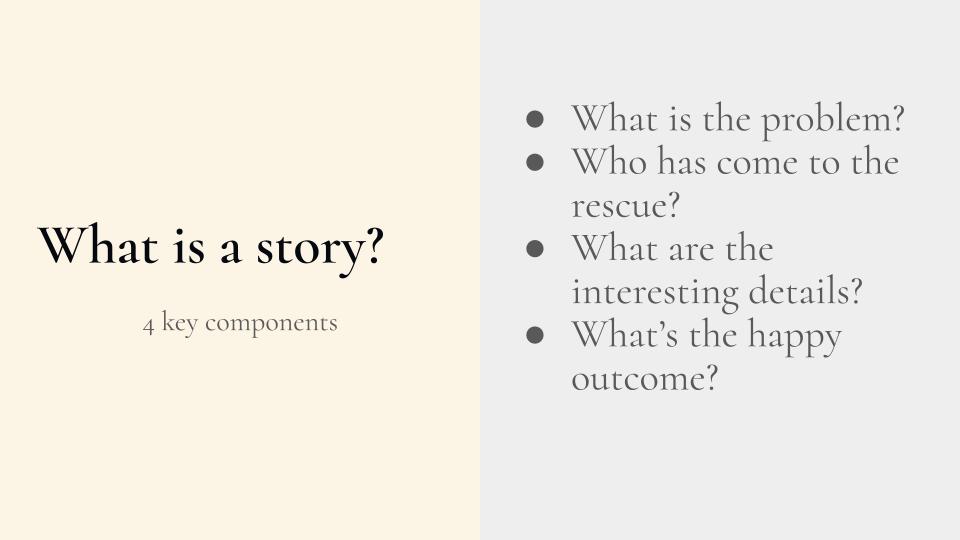
Part Two: Who Has Come to the Rescue?
There’s a line in a poem by the American poet Stephen Dunn that says:
“a hero is a person who blunders into an open cave”
I love the idea that to be a hero, you just have to be someone willing to take a step forward into the unknown.
For example, Belgian OSM’ers Joost Schouppe and Ben Abelshausen, who noticed that, without a global SotM, there would be no in-person meet-up for the European communities in 2023 and decided to figure out how to host a SotM Europe. Or, Marjan Van de Kauter, who had an idea about how her (and my former) employer, TomTom, might be able to support the OSM Belgium community in planning such an event.

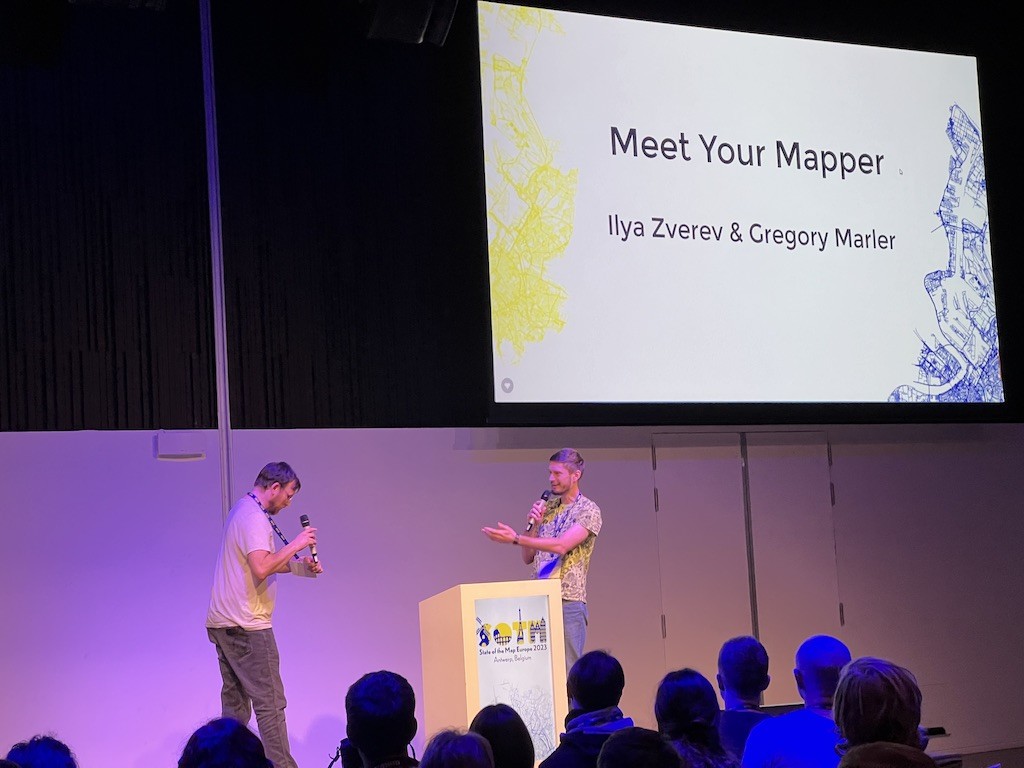
Or, Ilya Zverev and Gregory Marler who got up on a stage in front of hundreds of people and led icebreaker exercises that got us talking to each other. My favorite was when they had us write something we wanted to learn, and then had us crumple up the pieces of paper and throw them around like snowballs. It made us laugh, and caused our ideas to mix and melt together in interesting ways.
Or, Steve Coast who said ‘yes’ to stepping in and helping me out by talking a bit about what it was like to be the original storyteller of OpenStreetMap (and, let’s be honest, to lend a bit of celebrity excitement to help fill the room.)
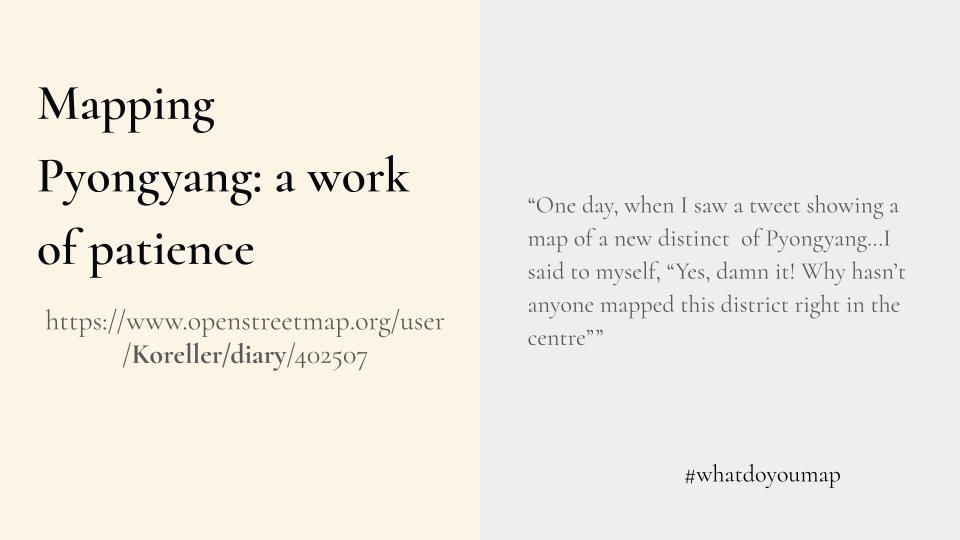
Or, OSM user @koreller who saw a tweet showing a map of a new distinct of Pyongyang and said to himself, “Yes, damn it! Why hasn’t anyone mapped this district right in the centre?” and then went on to realize that there were even more opportunities to map. He writes,
- it was also the Songhwa area. (April 2022)
- And the island in the centre too! (April 2022)
- And the central district, the Phyongchon district, there was everything to do! (mid-May 2022)
- And now why not tackle the big 1980s district, Tongil Avenue, in the south of Pyongyang, which hasn’t been done either! (end May 2022)
- And the district to the west, Kwangbok, also needs to be done! (early June 2022)
Notice how he builds suspense for his story as he unfolds this list. It took@koreller one year and one month to map Pyongyang, a detail that makes the whole thing seem a bit like a fairytale.
This, my friends, is an excellent example of a hero, walking into an open cave to solve a problem.
Part Three: What Are The Interesting Details?
The key word to emphasize here is “interesting.” It can be difficult to know what is interesting to other people. You have to be curious about what your audience thinks about, which is different than what you think about. This takes empathy and a knack for knowing what to leave out of a story as well as what to put in it. It is one of the reasons why writers should be paid for what they do–we are good at things like this.
I call it “being able to see what glitters.” I look for the thing that captures my creative imagination, which is not the same thing as something I “should” be interested in, or that I think my boss (or friend or mom or whomever has an opinion) wants me to be interested in. It’s also almost never what the person who is telling the story thinks is interesting. It’s always some random thing that has to do with that mix of empathy, curiosity, and curation.
For example, the OpenStreetMap servers are named for dragons, which is an important detail for anyone who is not a sys admin, because otherwise, why would a server be interesting. To name them after dragons is a very glittery thing–it creates a terrific visual, right out of the gate. It anthropomorphizes a server into something you could love, or fear, depending on if you think you’re on the same team as the dragon. It also evokes the historic medieval cartographers who wrote “Here be dragons” at the edges of their maps, which lays claim to 1000 years of mapmaking in one simple server name. Pop wow–that is a good detail.
Data is a great source of detail, but tread carefully because a number that represents something that is obvious to you, is probably not obvious to your audience. Plus, data always needs context.
Case in point: when people inside of mapmaking companies do their first Google search about OpenStreetMap, they often find the graph that shows that 10 million people have created profiles and, too often, don’t read any further. I’ve seen this data point used badly a couple of dozen times in the last four years. As you all know, it doesn’t mean that 10 million people are actively mapping now, nor even that 10 million people have actively mapped over the last 19+ years. It just means “created a profile.”
In this example, what is the data telling us?

We discussed this in the workshop and the story on that one is still pending, though we all agreed there probably is one.
That said, there are plenty of vividly interesting data points for OSM. I saw one just yesterday: as of June 2017 there were 89 million tags. (source) That, to me, is a detail that glitters. It shows the “folksonomy” aspect of the OSM taxonomy–the way it is ever-growing-and infinitely adaptable to whatever humanity needs. No corporate map could ever come close to that kind of feature diversity, which is why OSM is the one map that truly reflects the world as it is.
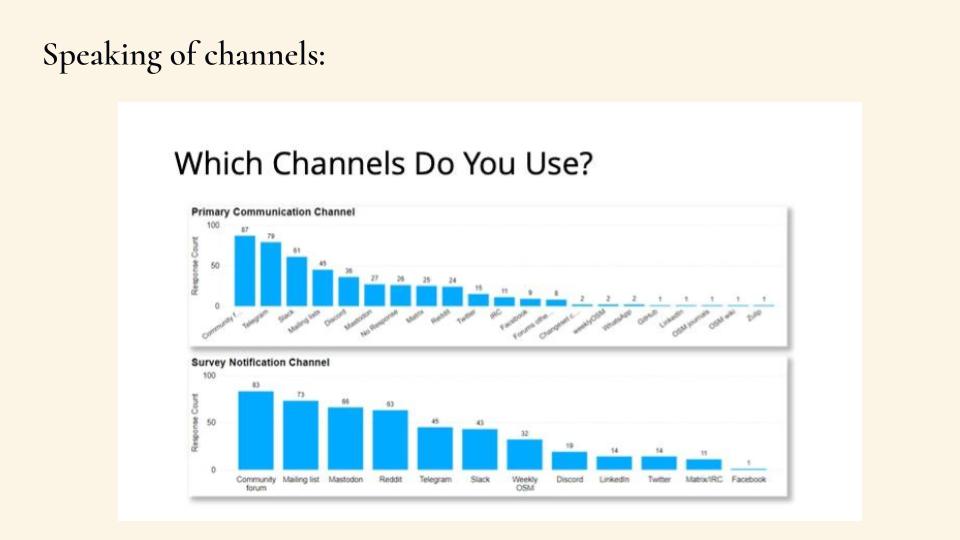
Sometimes the detail is a tool or new source of imagery. These are the OSM versions of what the writer Joseph Campbell referred to as a magic “elixir” in his classic description of storytelling “The Hero’s Journey.” One such tool is the open internet, itself, and more specifically, the many thousands of communication channels, forums, listservs, group chats, and GitHub issues and comments that are the magic carpet of the entire community. Without the ability to document everything that people needed to know about the project for free, in the beginning, in a place that everyone could access, the project could never have grown to its present global scale.
The same could be said about language localization and the machine translation capabilities that scaffold the humans who have been translating the project since the beginning.

The fact that anywhere you go in the world you can go online and learn what you need to know to make an edit in OSM is, when you think about it, astonishing. The fact that you can ask a technical question that will be answered, expertly, by someone who likely lives in another part of the world and may not even speak the same language as you is miraculous.
The fact that a very earnest mapper might get impatient for an answer to a question and type HURY THE HELL into the chat and have it become a meme for people in about 20 different countries is just pure comedy.
Part Four: What’s the Happy Outcome?
That old saying that “it’s the journey not the destination” is true. We’re now almost to the end of our story, and we know what the happy outcomes are already:
We’ve faced down the obstacles and villains: the missing maps and presentation partners, the proprietary organizations that impede free and open source data, the fact that mapping and geospatial data are a bit difficult for a lot of people to understand.
We’ve been given companionship and inspiration by our fellow heroes and travelers: spent a year and a month mapping in Pyongyang, captured two new dragons to our stable of servers, planned a conference, posted a thousand comments, and worked into small groups to practice telling our stories.
We’ve even solved the problem of a mistake on the lat/lon of the event t-shirt design by turning it into a mystery about a missing candy jar, proving that a good story can make even a wrong turning into a bit of fun.
Now, we are just tired and dirty hobbits of mapmaking, ready to find a warm fire and some Belgian beer.
There’s just one more thing to do and that is to ask you, What’s your OSM story?
I hope you’ll post it online wherever you interact with people–not just OSM’ers–but other friends and family, too. I hope you use a hashtag like #whatdoyoumap or #mapwithOSM and tag @openstreetmap so I and other members of the Communications Working Group (CWG) will see you.
For more of the many, many stories from State of the Map Europe 2023, here’s the program and here is OSM Belgium’s LinkedIn post. You can also search #SotMEU in all the usual spaces.
For more of my writing:
- X, FKA Twitter
- Mastodon
- Substack and here is an OSM-er only link for 100% off a paid subscription forever
