Finding streets that are really steps with OSMnx
Posted by alan_gr on 8 August 2025 in English. Last updated on 17 August 2025.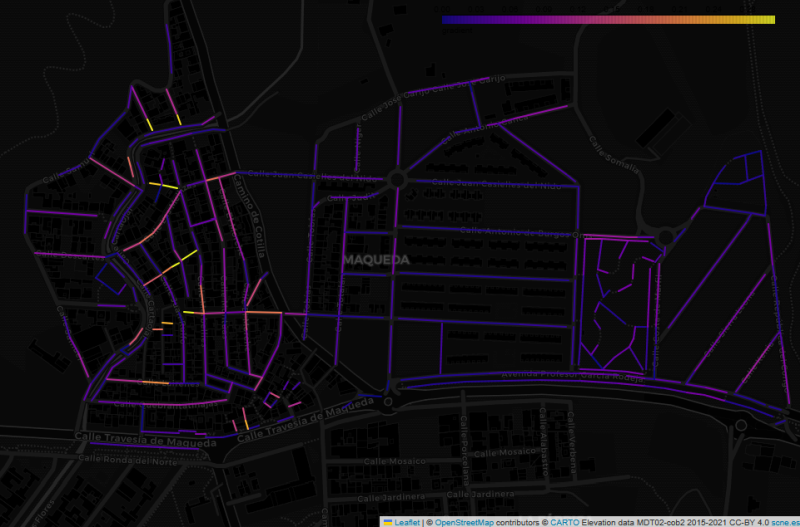
This image shows the Maqueda barrio in Malaga, with streets colour-coded by estimated gradient. The flat area to the east shows up with cold colours, while the western part of the barrio, which straddles a ridge, generally has warmer colours. But why did I make this map, and what does it have to do with “streets that are really steps”?
In my wanderings around the city of Malaga, I have often come across flights of steps that are not tagged as highway=steps in OpenStreetMap. Usually they are tagged as residential or footway, with misleading results for anyone using OSM-based maps or routers to find their way around the city.