Hundred millionth changeset submitted: some graphs and stats
Posted by LucGommans on 25 February 2021 in English. Last updated on 26 February 2021.How many people tried to get that milestone changeset?
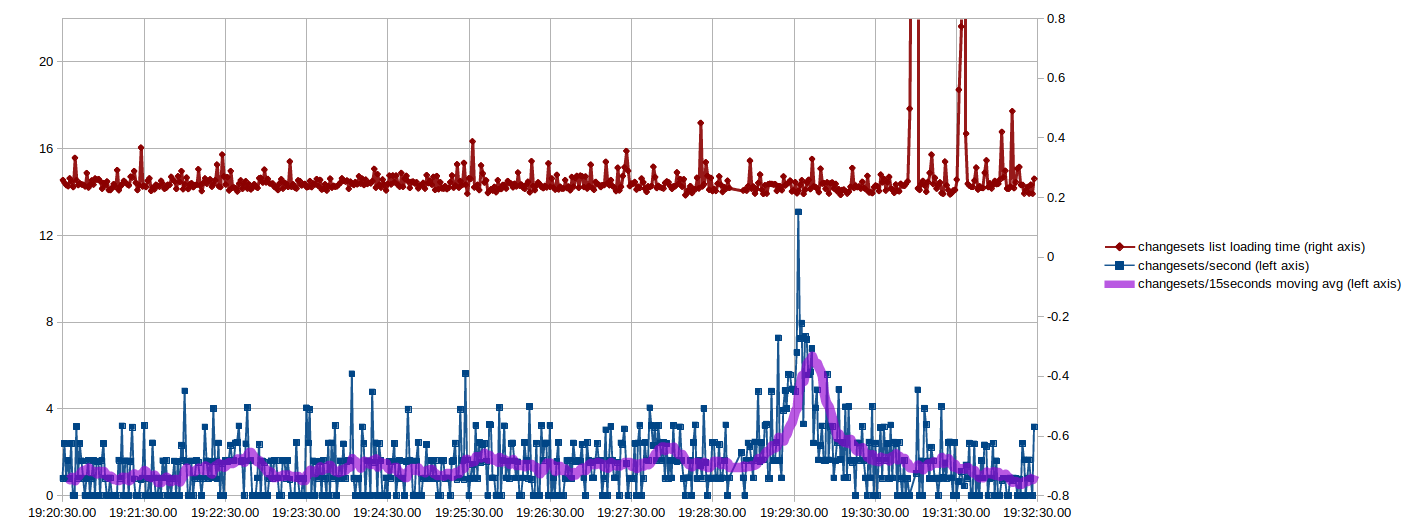
How did the server cope with the load?
What was the peak number of changesets per second?
To monitor the changeset count and make my own attempt at getting the hundred millionth changeset, I had a bash oneliner running in a terminal that refreshed the count every 2 seconds and, after changeset 99 999 878, every second. These are the resulting graphs (click to enlarge):
The X-axis here is the time, which I think makes the most sense. Another interesting way of looking at it, though, is to plot the changeset number on the X-axis so you can more easily see where the 100 000 000th was and what happened before vs. after: