OpenStreetMap logo OpenStreetMap

Deepthij's Diary

Recent diary entries

Deriving River Network using QGIS,SRTM and OpenStreetMap

Posted by Deepthij on 21 August 2021 in English. Last updated on 5 September 2021.

The article represents the method I have used to generate a stream network in a high altitude region in Kerala. The stream network of Devikulam in Munnar is the selected study area and stream and basin is generated using some tools available in QGIS. I am using SRTM DEM with a 30m resolution clipped to the study area and a set of SAGA tools available.

The steps are as follows:

  1. Load the DEM and reproject using the Warp/reprojection tool

The first step is to clip and reproject a DEM into a projected coordinate system. Screenshot Use the option, 
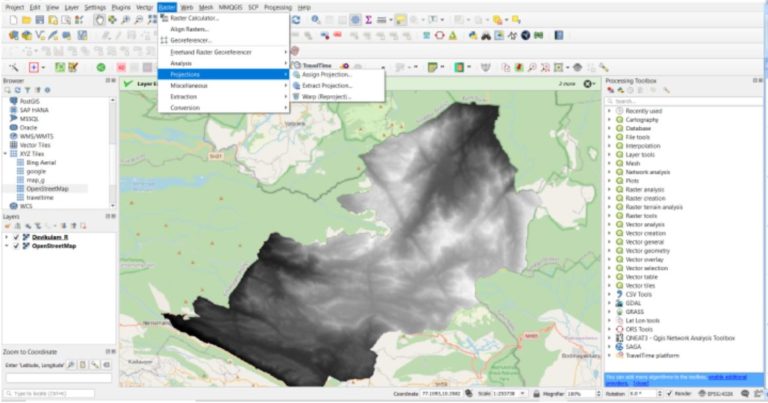
Raster > Project > Warp/Reproject

Select the required Projected coordinate system with reference to the study area.

  1. Fill Sinks in the reprojected DEM

This step is done to correct any unusual distortions of the DEM and to obtain a continuous hydrological network.

Screenshot

Here I am using Fill sinks, SAGA algorithm

Firstly, In settings ensure that SAGA tools are enabled.

From the processing toolbar > search and select Fill sinks(Wang & Liu) tool

Save the file and this filled DEM will be used for further processing.

3.Generating Strahler order streams

To get an idea about the existing order of the stream network, we can generate a reference layer using the Strahler order. This will give a clearer picture of Primary, Secondary and feeder streams and their hierarchy based on the principle of Strahler Stream Order Screenshot

From the processing toolbox > Select Strahler Order

Screenshot This will generate a raster file with stream networks Use the symbology feature to style the river streams for better visualization.

4.Generating vector channel network

To generate vector network of channels and drainage basins

From Processing toolbar > select the SAGA tool > Channel network and drainage basins tool

Screenshot

The threshold value will determine the detailing of the stream. ie. to decrease the value for a more detailed stream and vice versa. Screnshot Now we have the stream network and drainage basins

By default, the attribute table of the generated shapefile contains the fields: stream order, length of the stream etc.

5.Visualization using Hillshade

For better visualization, we can overlay a hillshade layer with our stream channels generated.

This will give a better perception of the area. Screnshot Go to Raster > Analysis > Hillshade, and overlay the stream channel

Identifying missing streams in Openstreetmap

The next most important step is to identify the data gaps in OpenStreetMap. We can do this by comparing the streams we generated using SRTM DEM and existing stream networks in OSM. The streams can either be extracted from OSM using specific tags and values from overpass-turbo or using the QGIS plugin QuickOSM

  1. Generating Buffer

Firstly load the extracted stream network from OSM and reproject the layer to a projected coordinate system. The reprojected files are used to create buffers.

To create buffer choose, Vector > Geoprocessing tool > Buffer Screnshot Apply a Buffer distance of 100 meters to both the OSM Channel and SRTM Channel.

  1. To find the incorrect or missing stream we can apply the Difference tool

From Vector > Geoprocessing tool > Difference

First, take input layer - OSM stream, Overlay layer as SRTM stream 100-meter Buffer

The process will give an output with consecutive Incorrect streams

Screnshot

Secondly, take input layer - SRTM Stream and, Overlay layer as OSM stream 100-meter Buffer

The results will give Missing streams

A logical comparison of the resulting layers will give us an idea about the data gaps in OSM. This can be identified and later hand-drawn using any OSM editors.

Location: Devikulam, Idukki District, Kerala, 685613, India