
 (You can see the visualization here and this entry can also be seen on my website.)
BC2020
Building Canada 2020 project (BC2020) is a community-led initiative driven by a simple and clear vision: map all buildings in Canada on OpenStreetMap (OSM) by the year 2020. While interning at Mapbox, the Community Team supported my participation in the BC2020, but but my involvement actually initiated from my work at Statistics Canada on the Crowdsourcing project, as well as my personal interests in volunteered geographic information. For more details about the project, check out the Mapbox “Points of Interest” blog post I wrote.
Though conceptually simple, mapping all buildings in all of Canada on OSM is no simple task. Without a large and diverse group of individuals that are willing to maintain participation, we may find that contirbutions decline with time, as has been seen in many past crowdsourcing projects. Interest usually starts strong, which has been the case so far in BC2020, but other priorities can affect a volunteer’s ability to remain committed to a proect, and thus participation can weaken or even stop. Therefore, in my opinion, the success of BC2020 comes from continuous engagement and education to various private and public organizations across all of Canada, which includes NGOs, government entities at various geographic levels, local citizens and experienced OSM contributors, and academic institutions.
Mapathon Organization
There has been a growing interest to incorporate OSM into academia, which I have witnessed online and which my former and current colleagues have informed me they witnessed at the HOT Summit in Ottawa (Sept. 14-15, 2017). With this in mind, Mapbox’s Community Team and I believed engaging with Canadian post-secondary institutions would be a great opprotunity to educate academics and students, as well as other interested individuals, about OSM and how to contribute data onto OSM for BC2020 during OSMGeoWeek (Nov. 12-18, 2017) in a meaningful way!
When beginning, I wanted to ensure that the leaders for each mapathon had a GIS background, so I decided to reach out to individuals at various universities and colleges across Canada that were affiliated with either Geothink or were the heads of Geography libraries. After solidifying interest from 8 different groups (2 in BC, 1 in ATLA, 1 in MAN, 3 in ON, 1 in QC), I created a wiki page documenting guidelines and resources for hosting mapathons specifically for mapping buildings on OSM. I also helped identify the area of interest (AOI) that each mapathon would armchair map. Since I wanted to avoid beginner mappers adding buildings within already mapped regions on OSM, I scanned rural Canadian regions on OSM that I suspected would be unmapped. After identifying a suitable region, I then researched whether or not that region had an already existing open dataset of buildings that could be imported. If there was no existing dataset, I concluded that the region was appropriate for the mapathon. Some universities even reached out to their AOI’s municipality to see if there were building footprint open datasets that could be imported instead (in which case they would have selected a different region as importing requires more expertise). The municipalities who stated they did not also expressed support for the initiative! It was warming to see eager mapathon leaders connecting with local municipalities, and even local OSM contributors, to collaborate.
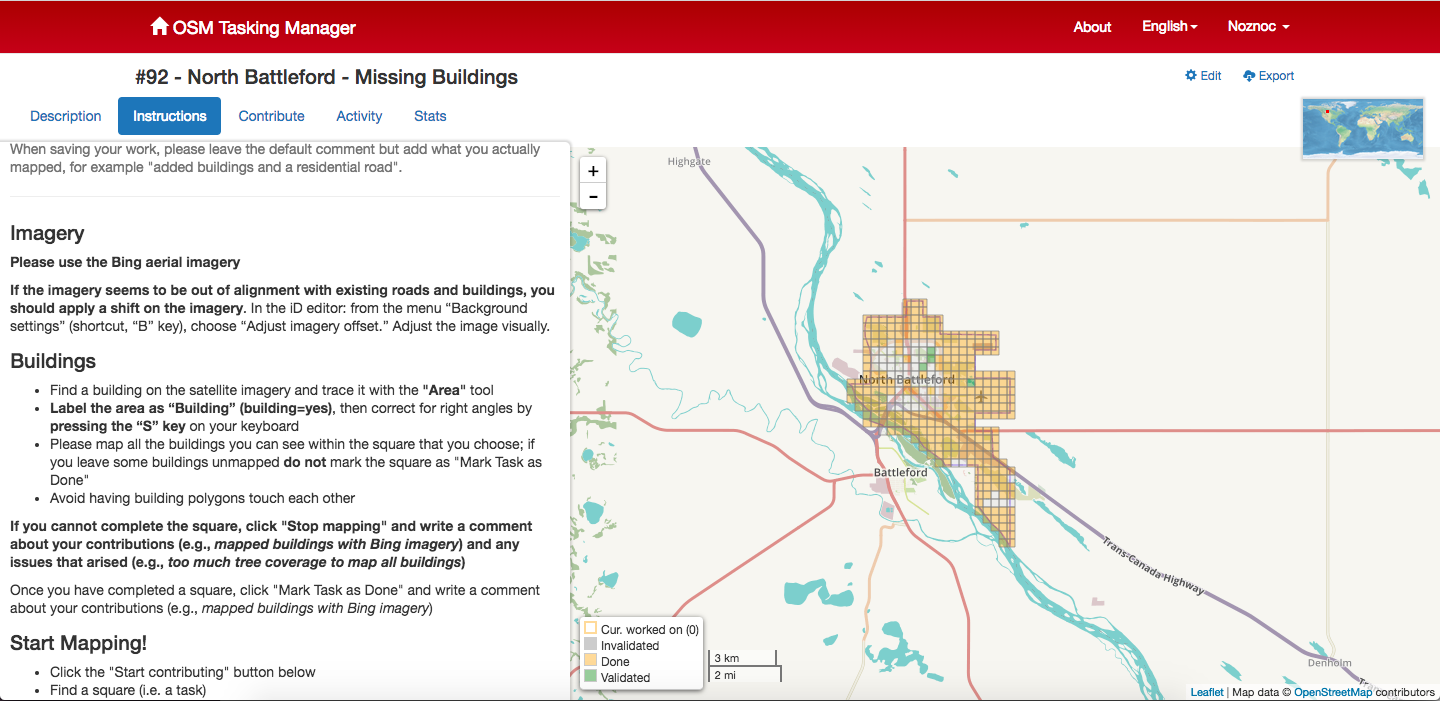
Once the AOIs were picked, I wanted to develop tasks in the Canadian Tasking Manager for the mapathons so that the participants had clear instructions on how to map buildings on OSM with the iD editor. (Note: JOSM would have been preferred because the building_tools plug-in makes adding buildings seamless, but there is a learning curve because JOSM’s graphical interface is not user-friendly.) After communicating with a Canadian OSM community member about my intentions, I was granted admin rights to create projects in the Tasking Manager. The image below shows a task I created for North Battleford, SASK.
Data Visualization
After the mapathons took place between Nov. 10 - 17, I wanted to analyze and visualize the contributed data. First, I used Overpass Turbo to see what buildings were contributed in the 8 AOIs that were mapped; so, on Nov. 20, I zoomed into each AOI and used the following query to select the OSM buildings contributed from the mapathons: building=yes and newer:7day. I then opened each query within JOSM and saved them as individual OSM XMLs to ensure I didn’t lose the metadata, which would have been the case if I directly saved the queries as GeoJSONs from Overpass Turbo. Next, I used osmtogeojson to convert the OSM XMLs to GeoJSONs for each AOI. I then imported the GeoJSONs into QGIS to assess the data. Some GeoJSONs had point and polygon data, but I only imported the polygon data into QGIS. In QGIS, I calculated the total number of contributors and buildings for each AOI. After analyzing the data, I merged all GeoJSONs together using geojson.io. I saved the merged GeoJSON and then used tippecanoe to convert the GeoJSON into a vector tileset. Lastly, I imported the tileset into Mapbox Studio to create a custom style (although I used Mapbox’s Standard style as the starting point).
With all the data cleaned, I was ready to create the data visualization. I used Mapbox’s Malaria Mapping visualization as a guide, but instead of running the repo’s scripts, I just altered the timestamps in Sublime Text (e.g., 2017-11-17T21:26:38+00:00 to 20171117). After adjusting the timestamps, I used Mapbox GL JS to create the time slider functionality. I also wanted every mapathon participant to see their contributions, so I added a button for each participating organization. This way a mapathon leader or participant can be directed to their AOI and review their contributions and stats. From my interactions with the visualization, it was neat to see how some AOIs had mapping done over multiple days.
Validation
I believe validation is very important for BC2020, and more generally to OSM. It is not just about adding data, but about having data that is reliable. Also, validation is especially important because most mapathon participants were beginner armchair mappers and new to OSM. I wanted to make sure the visualization supports validation efforts, thus I added popups so users could select a building footprint and then be directed to that specific building in the iD editor. Also, whenever a user zooms into a selected AOI, they can click on a button to be directed to the task in the Canadian Tasking Manager, or directed to review the validation documentation I wrote up in the wiki. You can see the visualization here!
Conclusion
My work isn’t done yet; it is just beginning. I am working with the universities to conduct validation and I intend on adapting the visualization to handle dynamic data that visualizations all changesets with #bc2020 in the comments. Please let me know if you are intersted in contributing or helping in any capacity! As mentioned above, the success of BC2020 requires a group of active participants!