 OpenStreetMap

OSM for Cities at State of the Map Latam 2026
Posted by vgeorge on 31 October 2026 in Spanish (Español).On 29 October I presented OSM for Cities at State of the Map Latam in Ciudad de México. The project shows how well OpenStreetMap covers a kind of data in a given city, and how recently anyone touched it.
The slides are online, in Spanish.
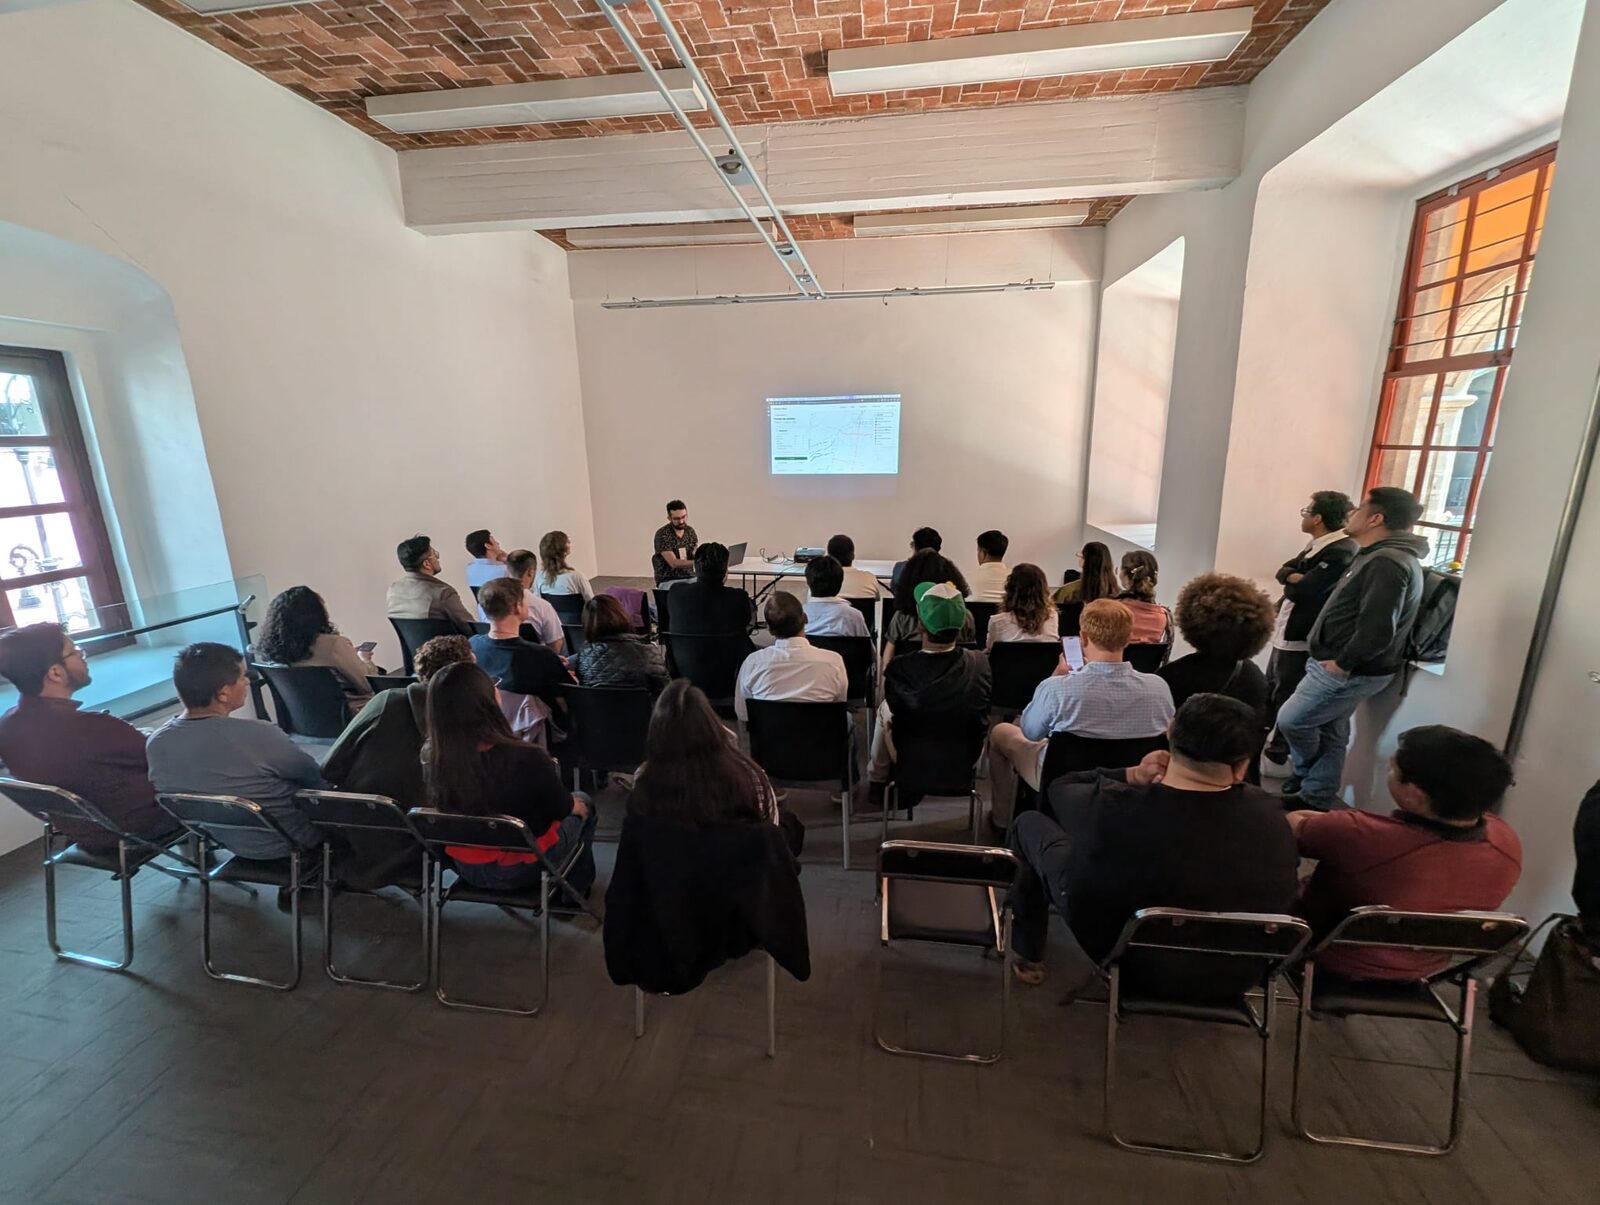 Photo by Jordan Jasuta Fischer
Most of the talk was a live demo with Mexico City bus stops, coloured by when each one was last edited. When I made the slides, 317 stops had been edited in the past week, almost all along a few routes in the west of the city. Someone was mapping them right then. Most of the rest had not been touched in over 90 days.
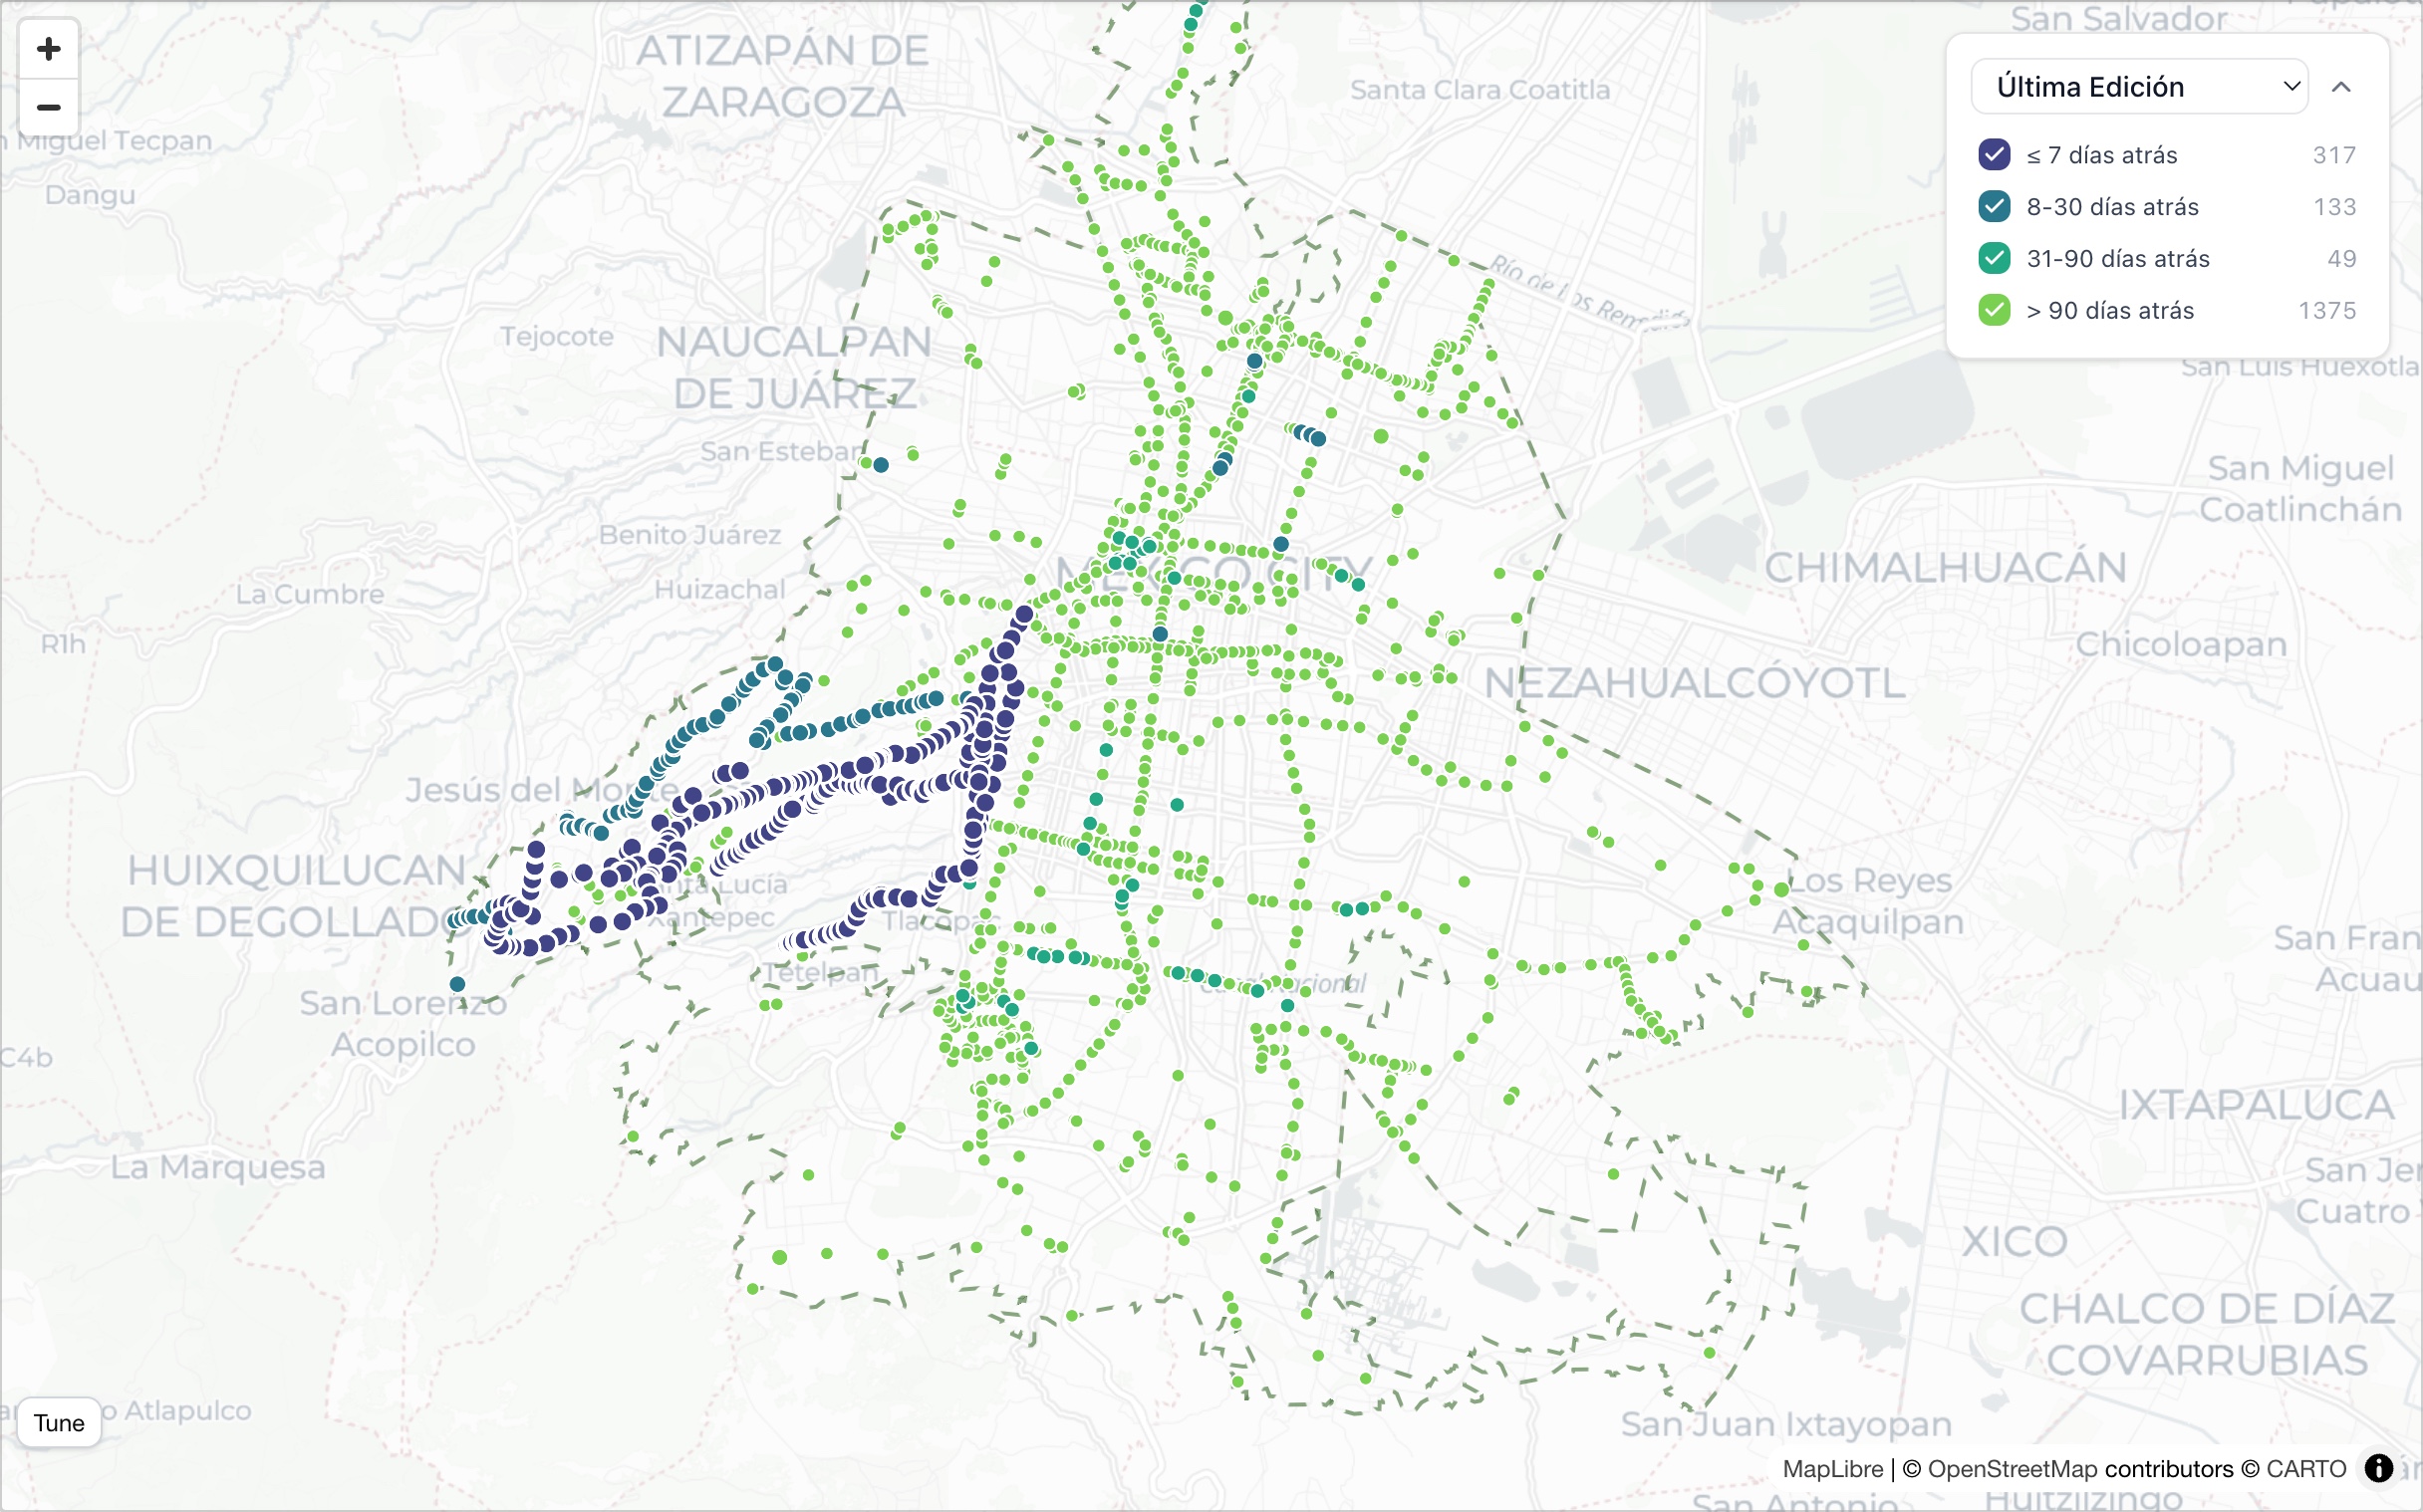
That is what the platform is for, following a dataset over time instead of looking at it once. Save a dataset and it is refreshed from OSM every day, and a notification arrive by email if it changes. A city team can see when its bus stops get mapped, and a mapper can see whether anyone else is keeping their area up to date.
Vector tiles are coming soon
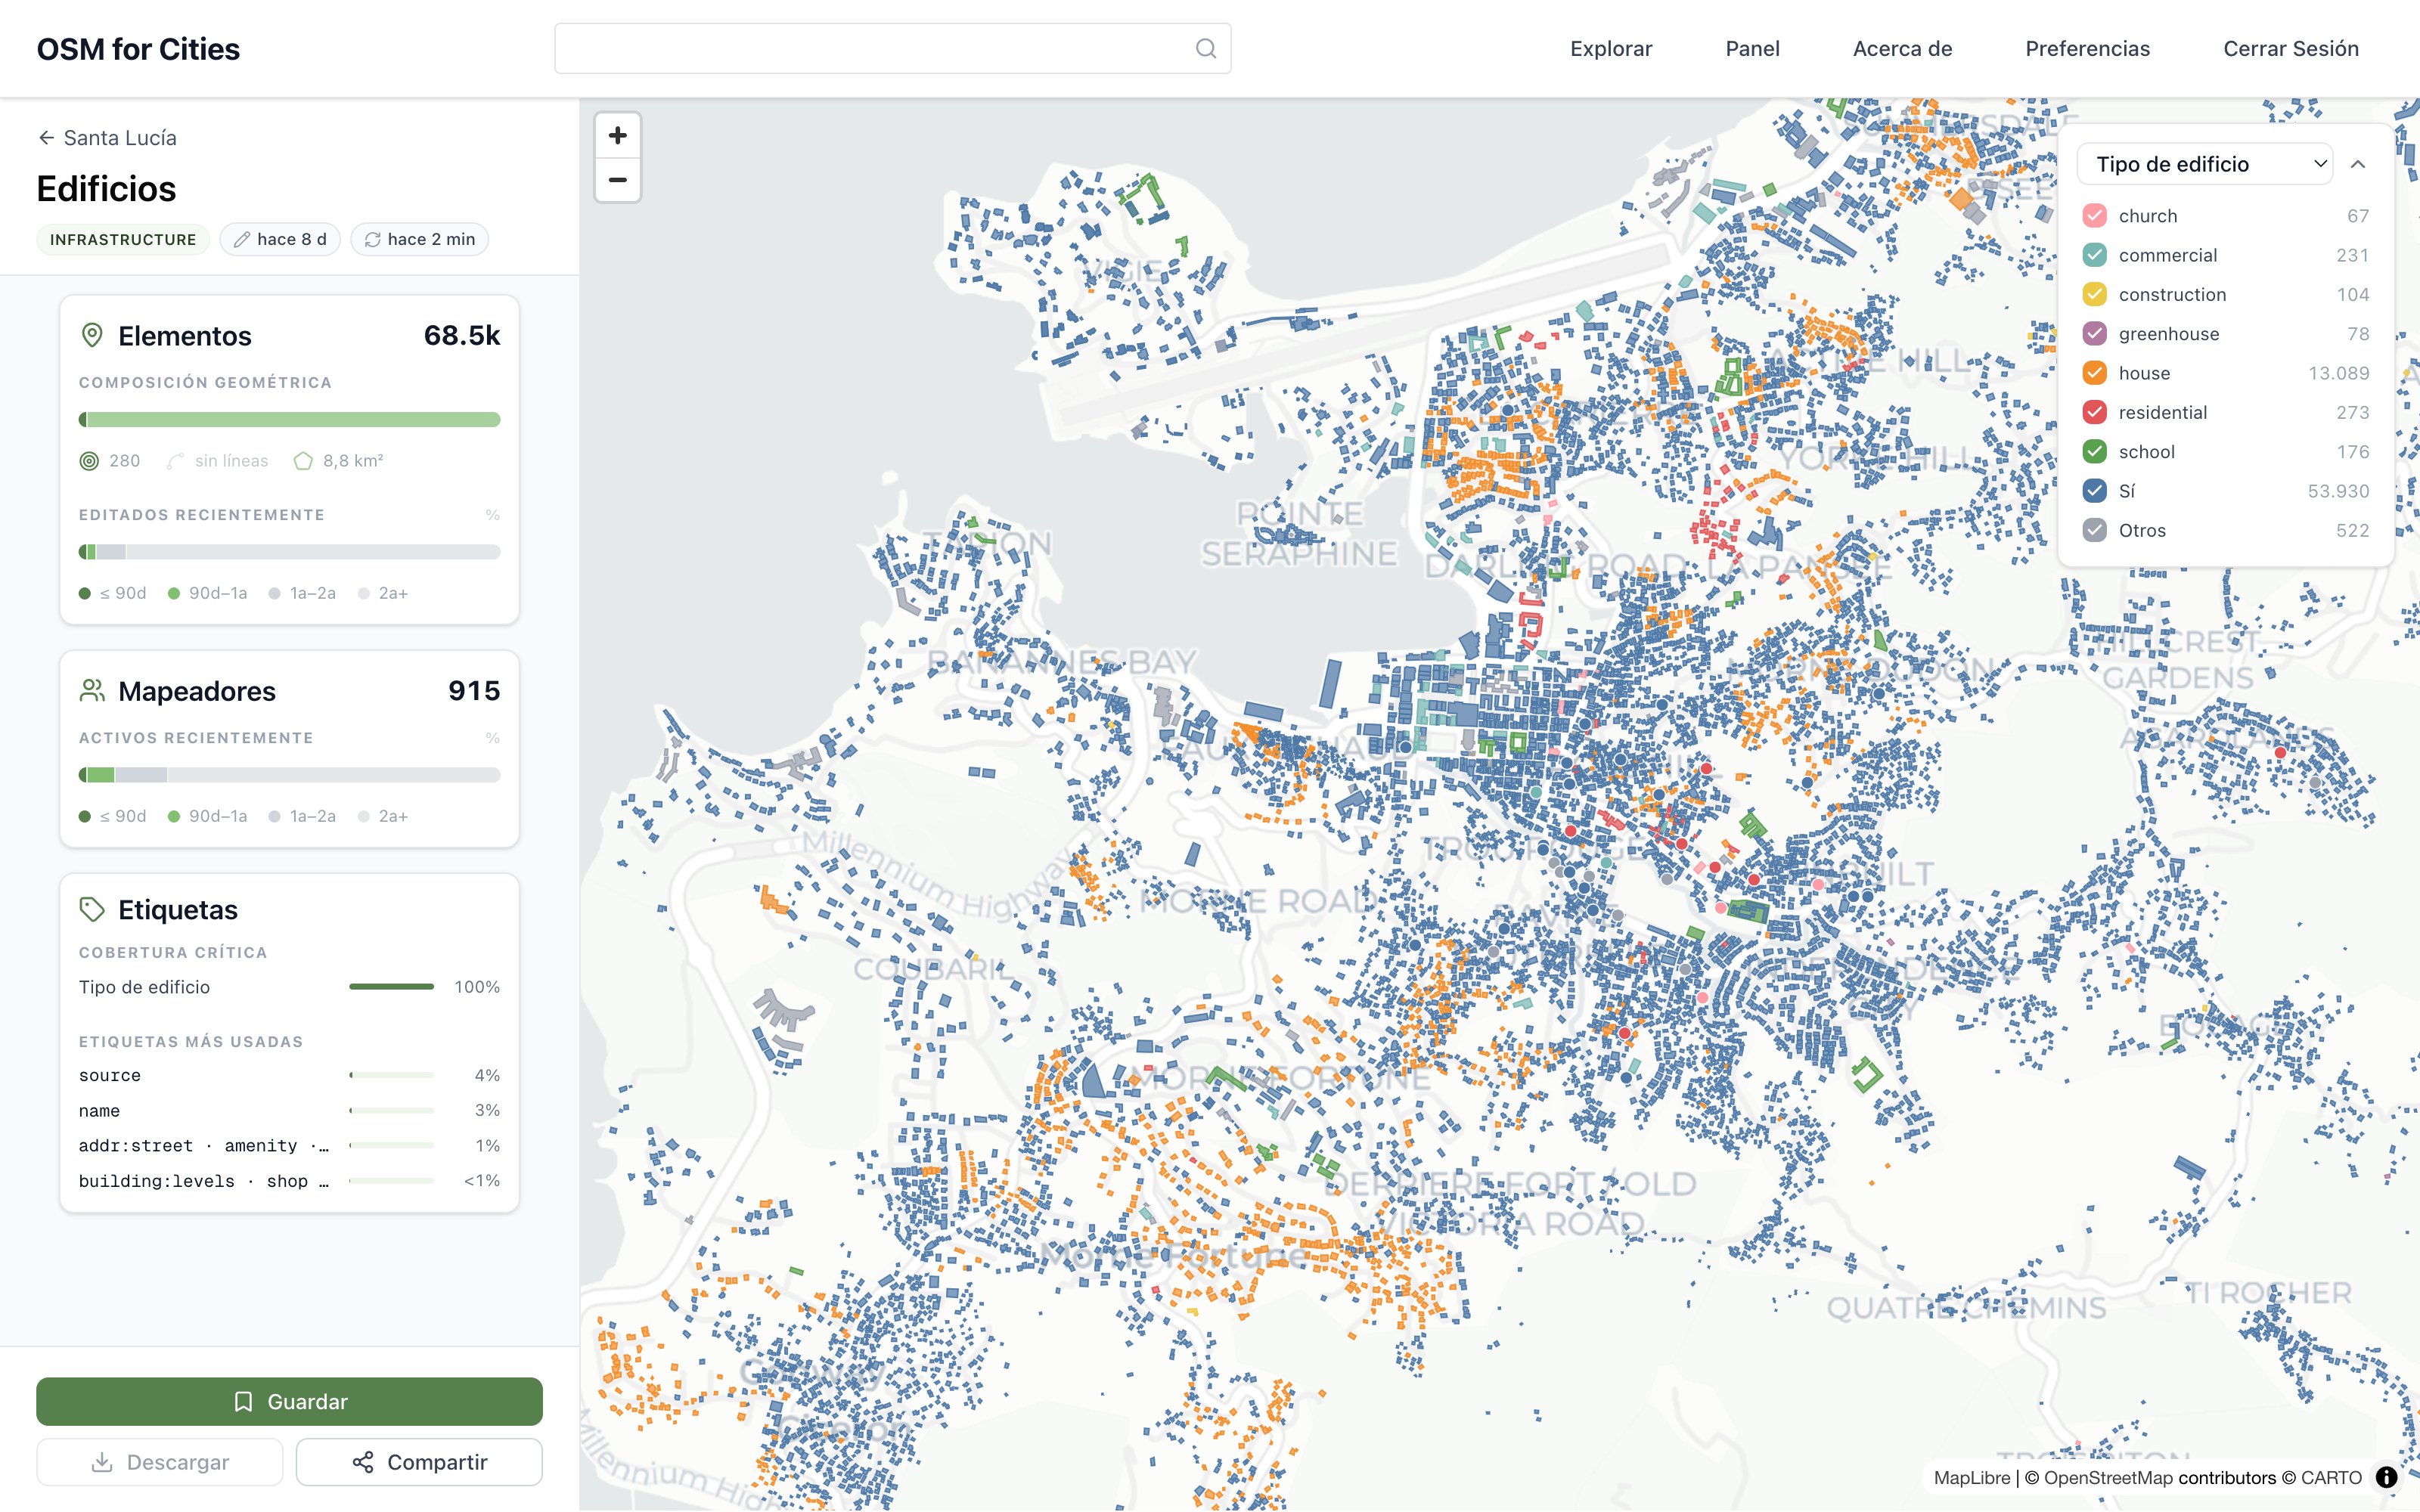
Today a dataset loads into the page as one GeoJSON file. That works for bus stops, but not for the buildings or streets of a large city, which is why those are not on the platform yet.
Buildings matter most for disaster response and health planning. They show where people live, which is what a house-to-house campaign during an epidemic needs.
The fix is to bake each dataset into vector tiles (PMTiles), so the browser only loads what is on screen. It is ready and in testing, and should be released soon.
Thanks, State of the Map Latam!
It was great to be in Mexico City and see old and new friends from the OpenStreetMap community. The conference was very well organized, with an amazing diversity of talks. I’m looking forward to the next one, which will be both Latin American and global, State of the Map 2027, in Bogotá, Colombia.
Disclaimer: Written by me with AI assistance.
Discussion