SK53's Diary Comments
Diary Comments added by SK53
| Post | When | Comment |
|---|---|---|
| Bus Stops | The linked map IS NOT the OSM map. It is a map largely created by SomeoneElse for both the things which he is interested in and to aid on-the-ground mapping. As his interests (hiking, real ale, …) tend to be shared by other OSM contributors in the UK and Ireland it is also helpful to other mappers in those two countries. The style was forked from the Carto style about 10 years ago, prior to changes in the colouring of highways. It has many rendering rules which relate to specific local legal peculiarities (mainly PRoWs - Public Rights of Way - which exist only in England and Wales) & personal quirks, such as whether a pub has real ale, might allow someone in with muddy boots & there’s a warm fire. As a local map it also has more zoom than the maps hosted on the OSM webpage, which in turn allows more detail to be shown. As a general tool for OSMers, SomeoneElse’s map style is mainly useful as an extensive example of how to use LUA for post-processing OSM data, and for numerous features, as in this case, which are not displayed on any of the main styles. With respect to transport providers names for stops: closing the loop on this kind of system is extremely difficult. and slow-winded. Anyone who has worked in large corporations knows that the only timely approach for this type of data issue is to handle such differences. (In perhaps 50-75 engagements over a 15 year period as a consultant I only once was able to close the loop in fixing duff data.) |
|
| Esoteric shops? | I remember looking at these tags about 10 years ago, and deciding in favour of Both tags are well-documented on the wiki, and 10 years on I suspect the meaning is better known (at least to me). See my comment on a Reddit post, quoted below :
There are 7 Glastonbury has had these shops for at least 35 years: I remember visiting in the summer of 1990 and then did some work at Clarks in Street a couple of years later staying overnight at the George & Pilgrims (just added listed status etc. to this). |
|
| Peaks and Mountains | You are not alone! One approach has been to name the connecting ridge as with Buachaille Etive Mòr although the name is equally linked to the main peak {Stob Dearg](https://www.openstreetmap.org/node/25453202) as the inventive use of Elsewhere in Scotland, very uninformative For Monte Rosa Dent du Midi uses both The Ten Mile Range just gets TL;DR: tagging is a mess for these. |
|
| OpenLandcoverMap, или онлайн карта покрытий | QGIS Style file for the previous data: https://gist.github.com/SK53/5e248ebb8155469f34265e9c87e72d81 |
|
| Re-mapping Co. Kilkenny | This is very interesting in terms of stats for a known area. In the UK quite a lot of building are often mapped in a generalised way first time around: no returns on terraces, fussy shaped conservatories and porches missed etc. We also have a lot of buildings mapped from already generalised data (mainly OS StreetView). And more recently imports of Microsoft buildings which often have a lot more issues than the above. Additionally, a significant fraction of buildings mapped 10 years ago or more will have changed (house extensions, demolition etc). I’ve often thought about a project similar to yours, so these stats give a decent impression of the effort involved. What might be quicker would be just classifying status of existing buildings before working through updates. |
|
| Как в действительности отрисован OSM | @Zkir: first go, more after Christmas |
|
| Как в действительности отрисован OSM | Nice to see you active in OSM again! A couple of questions:
I suspect you may need to make some kind of adjustment based on the proportion of a hexagon which is mapped with one of the tags you use. The Kola penisula may be a little damp, but not that wet, and towns in the North and East of the Urals show more prominently (a bit surprised that Perm is wood, I would have though it was big enough for one hexagon and landuse looks reasonably mapped). Jerry |
|
| If only there was a feed of local changes to focus my OSM updates on... | You can use OSMCha to create an RSS feed of changesets of interest (individual mappers, an area, or particular changes). |
|
| TIGER road clumps | @watmildon: Cluster DBScan works just as well for waterways, and a host of other interesting problems with OSM data! I really need to write up some of the other uses. |
|
| TIGER road clumps | If you want to avoid coding it is possible to achieve similar results with a Cluster DB Scan function. Unfortunately, QGIS only offers one which works with points. A (not so*) quick method as follows:
You can do lots more processing on the geometries in QGIS (collect, sum lengths, counts, buffer, hulls etc), and once you have found what is useful these can be pushed upstream into the source SQL query.
|
|
| Board Game Cafe - amenity=* tag needed? | @SomeoneElse I suspect PS Really ought to check they’re still in business. The cat cafe on Friar Lane seems to be thriving. PPS. JayTurner has been checking! |
|
| League Table of World Countries and the Quality of the OSM Mapping for those countries/ entities. | There is a, by now, huge academic literature on measuring quality on OSM. A decent starting point would be looking at the references in the paper by de Sabbata and colleagues : Bright, J., De Sabbata, S., Lee, S., Ganesh, B., & Humphreys, D. K. (2018). OpenStreetMap data for alcohol research: Reliability assessment and quality indicators. Health & Place, 50, 130-136. doi:10.1016/j.healthplace.2018.01.009. DisasterNinja implements a fairly simple quality metric (the coloured hexagons) which is based on some of the values which academic research has picked up. |
|
| Mapping sewer pipes | You also see vents on former brownfield sites which are required to ensure any unpleasant or dangerous gases are not released into buildings. There are quite a lot of these present now where the land has been redeveloped. Vents are also present in areas with high levels of radon from radioactive decay in the underlying rocks. I’ve always wondered if this metal pole is a vent of some kind:
|
|
| Sidewalk mapped separately | @Glassman : I think this really depends where you are. In general separately mapped sidewalks in the UK usually produce worse results (as I learnt long ago when a national public transport app gave an estimate 4x actual time required to walk from my brother’s house to the bus stop). Separate sidewalks are much more prone to lack of connectivity issues: and for the UK in practice require adding crossings at every road intersection (which in many cases do not exist in any visible form) to provide sensible routing. It is very hard to update whole suburbs in this way, and given that sidewalk-as-tag mapping produces sensible pedestrian routing is often a counterproductive use of mapper effort. Both SomeoneElse and I examined various practical issues regarding this tagging when we both had elderly parents with mobility issues. His Dad used a mobility scooter, and my Mum used a wheelchair. In both cases, and I see it now with my own Dad who uses two sticks, the best places to cross were often not at marked crossings with dropped kerbs, but places where driveways to houses were more-or-less opposite. These locations often offer better visibility than at crossing points at road junctions where older people take longer to perceive traffic (particularly any that is turning). There are also many more of them, allowing the choice of avoiding ones where visibility is obscured by parked cars. |
|
| Do people map single tennis courts? | @Minh Nguyen: I’d avoid “out-of-bounds” space. If you have 3 courts side by side with a single surface, then if only the central court is in use effectively all of the surface is technically playable. As an example this is a crude comparison of the No. 1 Court at Wimbledon with a local group of three courts in the university (which has a number of other sites like this). As you can see the playing area of the professional show court is not much smaller than the space dedicated to three courts for leisure players. (Of course a tournament court also needs space for line judges, ball people etc).
Tennis is relatively unusual in this respect compared with most sports, in that the marked area does not actually delineate the allowed play area. I’ve always found the use of the leisure=sports_centre tag to mean some place where a sport is played to be counter intuitive to my regular use of the phrase. I expect a sports centre to host facilities for multiple sports both indoor and outdoor (unfortunately UBS sold their Sportszentrum in Guggach 10 years ago, so I don’t have a nice easy non-English example). Most of the larger ones now seem to go by “sports village”, such as David Ross and Harvey Hadden local to me. As you illustrate tagging has evolved in a way that with current semantics one can have things with the same kind of tags nesting within each other, like Matryoshka dolls. In the UK single or small groups of tennis courts are regular features of public parks, playing fields (aka recreation grounds), school and university campuses etc. In public places they are, or were, typically close by a bowling green (as here. Sometimes they have been replaced by multi-sport pitches (often basketball & 5-a-side soccer). On school sites they may double as netball pitches in the winter, where IIRC the netball court would occupy slightly more space than a tennis court (this)one has 3 netball courts to 4 tennis courts). What seems to have happened over the years is that as mapping became more detailed the replacement of a simple, naive(?), use of a single pitch to denote a set of contiguous courts introduced additional complications for other leisure tags too. I have no solution, and as most of my examples introduce other infelicities I’ll leave it here, but for one extra thing. Forty years ago (give or take 6 weeks) I played tennis here. Note that this and adjacent tennis courts are mapped both individually and en masse with |
|
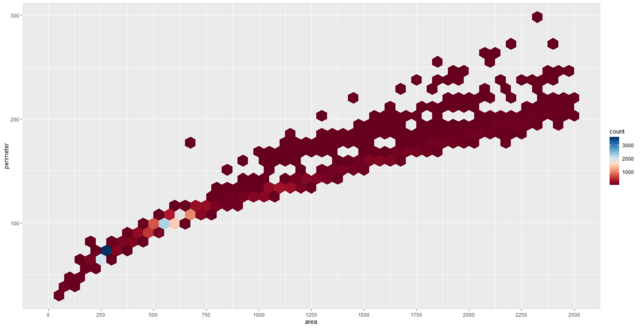
| Do people map single tennis courts? | @Hufkratzer: it looks to be so, metres in Popular Mercator varies with latitude. I’ll put my latest data extract for GB (not current data, but an osm2pgsql database loaded last year) which includes columns for area and perimeter calculated in popular mercator, OSGB (EPSG: 27700) and the with the geography datatype in PostGIS. The latter two are very close. |
|
| Do people map single tennis courts? | @Hufkratzer : I had wondered about using this approach, and obviously can identify single courts. Interesting that on a global scale you find different results. Initially, I wondered if there might be an effect from mapping private tennis courts, but a quick breakdown (via Geofabrik taginfo) by continent dissuaded me:
I ran your query for my local area and it found an area with 2 courts. A couple of issues: using Popular Mercator measurements make things quite different from using a geometrical accurate projection. For instance a 256 sq m court comes out at over 600 sq m at my local latitude, and a 110 m perimeter also comes out smaller, around 67 metres. Given there are differences with latitude it is only possible to do this sort of comparison for relatively small areas. I reran the R query and plotted perimeter against area (values in Ordnance Survey projection EPSG:27700). The plot is not very elegant, but one can see the clusters of 1, 2, 3 court elements.
This is an interesting exercise in general polygon analysis and perhaps shows some of the limitations of trying to do this solely with Overpass, although to be sure I would need to repeat this with the full 400k elements. |
|
| Removing quantity= tags from pitches in the San Francisco Bay Area | @Minh Nguyen: Not sure if any consensus was even reached vis-a-vis the marked vs. actual playing area. When only one court of the three down the road is in use people can make use of the full extent (should their skills allow). Another question I had was “What surface is used for hard courts?”, which AIUI are not usually asphalt these days. And related to your question: if using the info for things like calculating surface run-off from sealed surfaces the marked court area gives the wrong impression. |
|
| Removing quantity= tags from pitches in the San Francisco Bay Area | @publicerination: I had a look at how tennis courts are mapped in Great Britain and more than half are not single courts. Lejun has just posted a follow-up showin how to do the same kind of analysis directly in R. |
|
| R-OpenStreetMap : Emprise au sol | Bravo! |

 .
.