OpenStreetMap

poornibadrinath's Diary

Recent diary entries

A Mappy Week at SOTM and FOSS4G

Posted by poornibadrinath on 8 September 2022 in English.

It is always amazing to connect with like-minded people on topics you are interested in and talk about making it better. That’s what State of The Map has always been to me. And this time, thanks to HOT UnSummit, I got a chance to attend one as a student, and understand the use cases of maps from a very fresh perspective.

After more than 5 years of working in the mapping sector, I decided to pursue my Master’s in Cartography and being a student again, both of the conferences of SoTM and FOSS4G proved to be very beneficial to attend and understand the ways the mapping community are branching out in.

Alt text

I have been a part of the SoTM community for a few years now and have got a chance to even present some of the talks on OSM and validation. However, the whole experience at Florence this time was very different and engaging. The first in person conference after COVID, it was fantastic to meet everyone I knew in person and connect on maps and more.

The week at Florence was full of learning and building holistic relationships with people of the mapping community. It was wonderful to see what everyone has been working on, the new updates to tools and plugins, and the development of new tools for better mapping.

There were so many interesting talks this time that I am still catching up on certain talks that I missed during the conference. However, the ones that I did manage to attend and listen were some of the topics I found fascinating. I particularly thought of the talks of:

  1. Mateusz Koneiczny on Usability Testing
  2. Gala and Simona Ciocoiu’s: None, a story of the data that isn’t there
  3. Pedestrian and bike mapping in NYC by Ariel Kadouri
  4. Every Door and the future of POIs by Ilya Zverev
  5. How to kill OSM: Above all change nothing by Florian Lainez
  6. Routing not only for Prams, Null Island: a node in contention as some of the best talks at SoTM.

Also, the youth mappers documentary on crisis mapping and the efforts by the team and the lightning talks by the HOTOSM team on building mapping communities were fantastic. SoTM have always had great talks, this time too they were out of the box!

My experience at FOSS4G was a little overwhelming. It being my first time at FOSS4G, I never knew what to expect and already a week into being Florence and three days of SoTM made FOSS4G a little formidable and immense. However, it certainly was very fruitful. Along with attending the talks, I found the stalls very informative to understand the companies’ progress and the new products being built. The one product that stood out for me was MerginMaps, the application to sync and edit QGIS products on the phone! Mind-blowing. That is one product that I am pretty sure I am going to end up using a lot.

Aside from the magnificent talks and stalls, FOSS4G does know how to throw a party, and it was needed after the gruelling days of consuming and processing so much amount of information. The musical night was a night to remember!

Alt text

Both SoTM and FOSS4G has been so immensly helpful this time with new inspirations and ideas stemming from the talks and I certainly hope to use some of these methods and will look forwarding to contacting some of the speakers for more ideas for my Thesis semester the coming year. I had an agenda to meet as many people as possible and gain as much as information that I could, and I am very happy that it was possible. I look forward to coming to SoTM and FOSS4G the coming year and will try and be a part of SoTM Asia this November!

On a final note, what an amazing city Florence was. The experience of Italy, the food, the people and all those museums and architecture were absolutely magnificent. I look forward to visiting Italy again and again and again!!

Alt text

Posted below are some of my experiences in pictures, as they speak a thousand words! :) :) Also, check out my insanely short blasts of learning on Twitter for each talk!

Twitter: @bepoorni

Alt text Alt text Alt text Alt text Alt text Alt text Alt text Alt text

Location: Innere Altstadt, Altstadt, Dresden, Saxony, Germany

pasted_image_24_01_17__2_31_pm

When you happen to walk on a street, what usually catches your eye? The street? The trees? Or a cute little shop in the corner having a neon sign board saying pastry? Shop with a pastry sign, mostly! Such shops, stores, restaurants, bakeries, ATMs, etc. are what we call Points of Interest (POI). POIs makes the map well, interesting (pun unintended). It is equally important as streets and buildings to any map for navigation.

Mapping POIs usually requires a mapper to collect GPS traces and take photos on the ground. With Mapillary street-level photos, anyone familiar with the city can look at any Mapillary photo taken by others and use them for mapping POIs.

Here’s how you can map them👇🏻

  • Open an area you are interested in JOSM.
  • Enable the Mapillary plugin to see the images of that street. If you don’t have the plugin available go to Preferences > Plugin.

sfmapillary1

  • Use the Mapillary filter to get only the latest photos. This prevents us from looking at old photos that shows POIs that may not exist on the ground anymore.

sfmapillary Enabling a Mapillary filter will help in prioritising only recent images.
  • Check every street for POIs. Found anything missing? Add them in OpenStreetMap. If they are already present on the map, verify or add more information.

  • To make POI’s appear more prominently, use the osmic map style. osmic

Mapbox has added millions of photos in Mapillary last year and continues to add more!

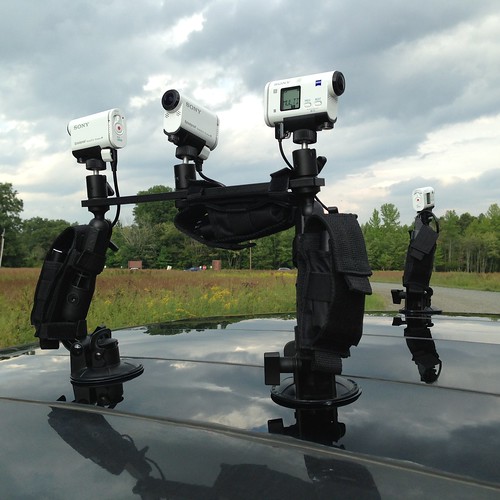
Our streetcam rig.

The coverage in San Francisco City is nearly complete and we are starting to improve POI coverage using these photos.

screen shot 2017-01-25 at 12 30 23

Head over to our ticket for detailed workflow or jump right in and grab a task.

Mapping POIs is straightforward, but maintenance is challenging. Even though we are limiting to only recent Mapillary photos, a lot can be changed within a span of days. In such cases, ground truth matters and local knowledge would be the best to know where what has been changed.

If you have any feedback on the workflow or suggestions on improving the same, please do let us know. Looking forward to the continued collaboration.

Thank you,

Cheers!

From Mapbox Data Team

Mapping roads and buildings in Singapore!

Posted by poornibadrinath on 24 November 2016 in English. Last updated on 25 November 2016.

In the last two weeks, as a part of improving the quality of base-map data of Singapore on OpenStreetMap, the Mapbox data team along with the community has completed adding missing streets and buildings in Singapore.

For this task, the team used a combination of Mapbox and Bing satellite imagery to improve the road network and building footprints data. We presently have managed to refresh more than ~1200 kilometers of roads. Additionally, we also have added close to ~40,280 buildings.

Take a look at the visualisation below which shows the buildings added during the last two weeks.

sg_builings

image

Issues with mapping in Singapore:

  • The main issue that the team encountered was the lack of good quality satellite imagery for both Bing and Mapbox. While Bing had better quality than Mapbox, it was not recent and had huge patches of cloud cover. So secondary sources like Strava were used for verification of major roads during adding missing roads.
  • Also due to the presence of huge number of high rise buildings, there often was distortion and the building footprint had to be very carefully aligned around the base and not the rooftop.

Singapore is a rapidly developing country and satellite imagery is often outdated. It would be great to have the community validate our edits and give any feedback regarding our process in our mapping ticket.

We thank the community for all the support. We look forward to more interactions with the Singapore community.

Thanks,

From Mapbox Data Team.

With an aim of making OpenStreetMap more navigable and accurate in routing, we started mapping turn restrictions and exit-destinations in Canada in its five important cities: Toronto, Ottawa, Montreal, Vancouver and Calgary. The tasks which spread over a month have been completed; we have finished adding and validating both turn restrictions and exit-destinations in the selected cities of Canada with the support from the OpenStreetMap community.

Summary of improvements

Mapping turn restrictions was flagged off on 21 of July with data team and the community working on adding missing turn restrictions and validating the ones that are present.

As the mapping progressed, workflow was getting updated every time the team had some doubts regarding how best to map a particularly different turn restriction that was detected. The questions we had were posted on the mapping ticket we used and the community got back to us almost immediately with clarifications to our questions. We completed both adding and validating turn restrictions in 14 days.

Exit-destination mapping started on August 11. For exit and destinations, a slightly different approach was followed, unlike how we mapped previously using only checkautopista2. Each highway was considered a separate task, which was integrated into tasking manager, with a specific link to checkautopista2 that loaded that particular highway that was selected using tasking manager.

Below is the full breakdown of how many turn restrictions and exit-destinations were mapped:

image

Status of existing data and Mapillary coverage

We could map extensively in Toronto because of great Mapillary coverage. Ottawa had us verifying the existing exit-destination tags rather than adding new ones because most of them were already mapped. 🎉 The community raced us in adding exit-destination tags in Vancouver! 🚀 Due to less Mapillary coverage, we couldn’t map much in Montréal and Calgary. We wrapped up adding and validating exit-destinations in 9 days :)

Community support

Both the projects were met with an amazing response from the community. It was great to have you all working alongside us, helping us in adding missing data, calling out and correcting our errors, keep tabs on our edits, and clarifying doubts and questions, letting us make edits to previously added data. We thank everyone, especially Andrewpmk, Rps333, James2432, Bootprint, Puec, Fmarier, Scruss, for your support and guidance and hope the collaboration and involvement continues in all our future projects. We will continue navigation mapping in Canada, specifically in Montreal and Calgary once there is enough Mapillary or OpenStreetView coverage for us to add data and verify them.

Until then,

Cheers!

Mapbox Data Team :)

4847742452_7344611ced

Exit numbers and destinations on highways are an important aspect of navigation since they guide the user where do they have to exit the freeway in order to reach their destination and which other cities or towns or areas the highway interlinks. Making any map more navigable or any routing machine more accurate includes all the minute details and improvements. In an effort to broaden the reach of OpenStreetMap to the people and make it better in routing and guidance, we are adding exit and destination tags for highways in five priority cities of Canada.

The Approach:

We are concentrating on five major cities of Canada: Toronto, Ottawa, Montreal, Vancouver and Calgary to add the exit and destination tags and the method we intend to follow 👇🏻

  • We are using tasking manager for loading the highways as a separate task and open it directly onto checkautopista2. Checkautopista2 by k1wi is a neat tool that highlights all the highways and their exits which makes it easier to add the exit and destination tags. taskmanager_checkautopista4

  • You can get involved with the project and know about adding exits and destinations from the detailed workflow.

Here’s how you can get involved:

Adding exit and destination tags is based on good sources: Mapillary, local knowledge and official documents. You can contribute to this project of making one of Canada’s most detailed maps by contributing to:

  • Mapillary coverage of the higways that would aid us in adding right destination tags.
  • Adding exit and destinations to highways. Community participation has already ensured that around 1500 destination tags are added across Canada 👏🏻 🎉
  • Validation of our edits. You being local mappers have more knowledge on the highways than us and it would be great to have your eyes on what we add.
  • Refer to any other verifiable source like official documents, secondary sources which would help us in adding the missing tags.
  • Suggesting on how better to improve our existing workflow

A few questions:

After an initial groundwork into the already mapped exit numbers and destinations, some observations are:

  • We noticed that destination (places, cities) and destination:ref (highways) tags are being added to the nodes of exits as name tags.
  • Few exit nodes have destinations given in the ref tag, instead of ways
  • The destination:street ( for ways that lead towards streets, avenues, boulevard, rue) tags are not being used.

Our questions are:

  • Is the usage of name=* instead of destination=* on the exit nodes the usual protocol?
  • Is it acceptable if we change the name=* tag to the appropriate destination tags and move the tags from the Exit nodes to the correspoding ways?

—> A full breakdown of the observations and here’s the OSMWiki for adding destination tags.

We would like to hear from the community about the agreed method of mapping exit numbers and destinations in Canada to take this further.

The turn restriction sprint in Canada was met with an immense support from the OpenStreetMap Community who guided us in all stages by improving our workflow, keeping an eye on the errors and contributing to adding turn restrictions and also Mapillary. It would be great to have you working with us in adding exit and destinations in all the five priority cities of Canada and making sure all the gaps are filled :)

It was two fantastic days of hacking, discovering, sharing and generally having fun. OSM HackWeekend opened a lot of doors in the process of learning new things, sharing new ideas, building new tools, hacking on amazing stuff. It was the first time Mapbox BLR played host to two days of hacking, working on tools that build and escalate OpenStreetMap and the results were anything but ordinary.

dscn1508-001

Hack weekend (2 & 3 of July) served as a platform for meeting a lot of new and interesting people and the turn out we had for the event was equally diverse and intriguing. We had twenty one people attend the event from different places across India and it was fascinating to hear what their interests are and why they thought OpenStreetMap HackWeekend would broaden their perspective and give a new edge to their work profiles.

Day 1:
  • Day one of Hackweekend started with Arun (PlaneMad) taking the participants to the world of opensource mapping with a session on OpenStreetMap. Many participants were new to mapping on OpenStreetMap and this introductory session was the icebreaker and a conversation starter. With people slowly getting the idea of open-source mapping and how it came into being with OpenStreetMap beginning its reign, the focus slowly turned to the tools that maintain and perfect OpenStreetMap. Kushan took charge of explaining the goals of the HackWeekend and what we planned on accomplishing over the weekend and thus, the hacking —————- began!

    osm hackday

Day 2:
  • Day two, even though it had lesser turnout than day 1, was no less fruitful. Everyone continued to work on the projects they started the previous day and by the end of the day we had a solid progress on the tasks initialized. Here’s the hackpad of the ideas that everyone worked on, and to summarise what everyone worked on:
  • Manoj, Maning, Jinal and I worked on localising iD editor by translating instructions to Malayalam, Tagalog, Gujarati and Kannada respectively.
  • OpenStreetMap main website has had some translation to Malayalam by Manoj and also, he worked on visualising 3D buildings.
  • Ram Gopal (VoidSpace) worked on Open GTFS: a way to generate GTFS feeds for anywhere in the world.
  • Prashant and team worked on using GL JS to visualise population and literacy rate in India.
  • Asif and team worked on creating an app using android SDK that tracked the location of a transport and estimate the amount of time it would take to reach the next stop or station.
  • Ravigopal did a Jekyll and css re-organisation of the OSM India website.

starred photos

Amidst all the hacks and so much information to process, we didn’t realise it was time to conclude the event. With a brief session of discussing what everyone worked on and what were their learnings from two days of hacking, we wrapped up the OpenStreetMap HackWeekend. Eagerly looking forward to more hacking and more fun!

dscn1694-001 Cheers!

What better ways to spend weekends than mapping? ;)

And it’s like icing on the cake when World Environment Day falls on the end of the week. No better day to kickstart Basaveshwaranagar Mapping Party!

dscn1067-001 Basaveshwarnagar neighbourhood

This quaint little neighbourhood has been home to us for the past 20 years, and even though we thought we had all its entities etched in our memory, the growth this area has had in the recent years has baffled us, nonetheless. There are so many new things coming up, the neighbourhood has gone through so many changes that it was almost a necessity to keep up with the pace of its growth and have an idea about what is happening in our immediate surroundings. Well, mapping seemed like an answer to all those questions and hence, tada, Basaveshwaranagar Mapping Party has officially been flagged off!

dscn1074-001 Even the cows like partying!!!!

On account of World Environment Day, the mapping party started off with us, Jinal and me mapping trees present in our area, to get a bearing of whether our neighbourhood is more greener or less, and of course, it is less. There are so many trees cut down to make room for development. A sad scenario, but few good samaritans still love the ah-mazing trees and quite a few of them have survived.

dscn1065-001 Survival skills, I tell you!

We mapped close to a hundred trees in ten streets we roamed around. Quite a good number but there is still room for a lot more greenery. Basaveshwaranagar is beautiful, there is no denying it, but it can be a lot more beautiful with more trees. Maybe, a call for a sapling drive would be great!

collages1 Basaveshwaranagar buddies mapping ;)

Using maps.me an offline mapping app, we mapped the locations of trees around our area (sadly, we couldn’t upload it from maps.me since it doesn’t have a tag for trees; though we have made them a request!) and then we uploaded it on OpenStreetMap using JOSM. OpenStreetMap looks a lot more greener, now that we have added quite the number of trees in our locality.

dscn1072-001 Using maps.me

screenshot_2016-06-08_13_27_51 Streets we covered

15c5dw Trees mapped in the area

Mapping party, however, is not just about mapping trees. It’s about getting to know our surroundings, our home better and to keep Basaveshwaranagar up to date on the map. We are looking forward to a lot more mapping, adding up new interest points, restaurants, shops, adding missing streets and repairing the wrong ones present on OpenStreetMap and also, ;)

dscn1064 Tracking our little friends ;)

We welcome all Basaveshwarnagar mappers to join, bring in new perspective and put in their efforts and interests to make our area a lot more cooler than it already is. Let’s grab field papers, party hats and go map!

What say?

Imagine you are driving down a highway with your car guidance giving you the instruction “In two miles, take exit number 164A and follow the signs towards Dearborn Street” using OpenStreetMap data. This will soon be possible with upcoming improvements to the OSRM guidance engine that will use destination tags more intelligently from the map data.

Over the last week, the Mapbox data team reviewed freeways in 30 cities across the United States to find gaps, in exit number and destination information that could be improved using Mapillary images and official documents. We want to share our findings here and welcome your feedback on our approach, use of tools, and workflow.

Our Approach

We stuck to reviewing motorways and motorway junctions, as we did during mapping destination signs for 9 US States, and covered 328 motorways in total. As part of the review, we used Mapillary imagery, official Department of Transport data, Crosscountryroads, Aaroads, and Wikipedia for reference. For identification of exit numbers and destination tags, we relied on Checkautopista2 by k1wi.

Quickly find motorways with missing exit numbers and destination tags using Checkautopista2

Here is how we went about tagging:

  • on nodes with motorway_junctions:
  • ref=* representing exit numbers.
  • noref=yes for junctions with no exit numbers.
  • on ways with motorway_link:
  • destination for city, neighbourhood.
  • destination:ref for reference-number of next motorway.
  • destination:street for streets and road.

24-wa_i-5_n_exit_164a

We used this workflow for adding Exit Numbers and Destinations.

In total, we added 761 tags on the 328 motorways we reviewed. Here is a full breakdown of the number of destination related tags that were already present on OpenStreetMap before 1st April in 30 cities and what was added during this project:

image

Note There were already 2653 nodes with exit_to tag in these cities, which is an older tagging scheme for destination mapping (read more). These features were not modified.

As we worked on this project, we got a ton of help from OpenStreetMap contributors who provided feedback, caught mistakes, and helped us improve our process. As remote mappers, its important our edits are validated by local mappers, feel free to review the data in any of the cities that were worked on and post your feedback on our project tracker. You can look forward to more updates to the map in these cities as we work towards a more navigation ready OpenStreetMap.

Every Mapper knows that nothing beats Field Mapping in terms of perfection and of course, the sheer joy of mapping. Having a notepad, pen, gps and walking along the streets, marking every detail will give you a clear picture of that particular area and about your observation skills in noticing tiny details about what makes that particular street, colony or area, tick! Field mapping gives you first hand insight about the features in that particular place, what kind of streets are there, how the colony is built etc…

This time I had a taste of the first city based field mapping when I got to roam around streets of Indiranagar, trying to see what interests the people in that area, what are the new point of interests, what new restaurants and cafes have popped up, where are the atms and banks, how new buildings are shaping up, are there any important points missing from the maps?

Today’s task had us, a team of three: Maning, Chetan, Poorni covering a stretch of around 2 kilometers around the Krishna Temple Road of Indiranagar, across the 100 feet road, to see what new POI’s need to be added to the map, what new buldings might have come up since the time it was previously mapped, are there any shops or amenities that were previously there but not functionable anymore. screenshot 2016-04-06 16 56 10

The tools that we used were OSM Tracker, OSM AND and Mapillary. As we were three people, we each used one tool to get the bearing of the task and update as much as we could. We used field papers to note down the points. By the time we were done, the field papers were messy and we were happy with the mapping that had been done! fieldpapers-1

Field Mapping is crucial because the insight that you get is something missing from mapping remotely and as the city grows every single day, there are new things coming up, old stuff crashing down. It is crucial to map all the features because everybody needs an updated map to stay in sync with the fast moving world out there! The data points you updated will most certainly help someone whether they are looking for a bite late night or trying to find an atm or a pharmacy in times of an emergency or while trying to route the fastest way to their work place.

This is how the neighbourhood changed quickly on OpenStreetMap as we went on updating data points! sri_krishna_temple_road_mapping_party _indiranagar_bengaluru credits: PlaneMad

Because if adding data remotely is a task then field mapping is the validation!

So grab your notepad, pens and gps and go out there and map!

Happy Mapping :)

This time, I tried to do something new and took to improving road network and buildings in two areas that are probably very different from each other in terms of the dynamics or the urban set up. But both had one thing in common, clusters. The settlements were clustered and packed and hence, it proved to be a challenging task editing both Ranchi and Dehradun

Road tracing in Ranchi was tough mainly because of its congested built up.

From the satellite data, it was pretty clear that the capital city of Jharkand is clustered. The settlements were packed. But there was also a lot of open space. It was easy to make out highways and tracks but difficult to decipher where the residential roads were due to the mass build up of residential settlements.

screenshot 2016-03-025

Things that I noticed

  • The settlements are so clustered that it was difficult to make out where the roads are.
  • Some of the streets had already been marked though none of them had the right tags. Some of the streets had been marked wrongly.
  • Some of the roads were placed where there were no roads.
  • Some of the roads had been joined with the adjacent land-use or buildings.

Before and After

screenshots2

Building tracing in Dehradun was slightly more challenging than road tracing.

screenshot 2016-03-30 00 14 08

This task demanded keen eye for detail and how much of it one is able to process. One issue that one might face when tracing buildings in India is irregularity or dissimilarity. The settlements are so diversely built that it becomes hard to be consistent while tracing the shape of the building as the settlement built up dynamics change every now and then.

Things that I noticed

  • Satellite imagery was not so clear in some parts which made it hard to detail.
  • The buildings were so close to each other that it became a little difficult to trace the outlines.
  • Buildings which have different shapes takes longer time to edit.

Before and After

screenshots-001

screenshots1-001

Road tracing and building tracing broadened my perspective about mapping and gave me a fantastic chance to try and learn how the cities are built. It is very interesting to study the dynamics of urbanisation and how cities are planned.

But most importantly, it provided me with an in depth analysis of how important data is and how crucial it is to add right data. It’s not the quantity but the quality. It is not about a race of how many roads you have added or how many buildings you have traced. What is more important is the fact that there are so many people out there who are dependent on the data you are updating and it is a responsibility to make sure that we don’t mess it up. A node unconnected or a building connected to the road can make a huge difference and it is scary to think the amount of repercussions it can cause.

Well, what more can I say. Happy Mapping :D :D

I started mapping the Basaveshwarnagar neighborhood, in Bengaluru, the area where I stay and thought I knew the place pretty well.

Before starting mapping, I was a little apprehensive about how much of Bengaluru has already been mapped. A few areas that are not mapped, might probably be the ones which I don’t know very well. So, I was wondering what was left for me to map.

But to my surprise and a bit of a shock, I discovered so many errors in the data in my area and to say I was overwhelmed would be an understatement.

One grouse would be why hadn’t I done this before.

The area I concentrated on screenshot 2016-03-22 12 14 09

Things that I edited

  • Misaligned roads screenshot 2016-03-22 17 45 11

    • Untagged streets
    • Streets that didn’t have a name
    • some untagged buildings and polygons
    • roads that were wrongly intersecting
    • Footways and walkways of the local parks screenshot 2016-03-22 17 31 19

Things that I added

  • New shops that had cropped up in my surroundings recently
  • A few buildings that I could make out
  • A few streets that were missing
  • A couple of amenities screenshot 2016-03-22 17 31 58

So far, mapping hometown has been great fun. I will continue mapping my neighbourhood. I am sure I am in for some great surprises :)

Mapping Bengaluru is a little tricky mostly because of not knowing what to map but when searched, it comes up with tons of data that can be corrected, added, edited and generally have fun. There is so much more to be improved. Looks like I am in for a crazy ride :) :)

screenshot 2016-03-23 11 32 30