OpenStreetMap

pnorman's Diary

Recent diary entries

Minutely Shortbread tiles

Posted by pnorman on 29 February 2024 in English. Last updated on 5 March 2024.

I’ve put up a demo page showing my work on minutely updated vector tiles. This demo is using my work for the tiles and the Versatiles Colorful stylesheet.

With this year being the year of OpenStreetMap vector maps I’ve been working on making vector tile maps that update minutely. Most maps don’t need minutely updates and are fine with daily or, at most, weekly. Minutely updates on OpenStreetMap.org are a crucial part of the feedback cycle where mappers can see their edits right away and get inspired to map more often. Typically a mapper can make an edit and see their edit when reloading after 90-180 seconds, compared to the days or weeks of most OSM-based services, or the months or years of proprietary data sources.

Updating maps once a week can be done with a simple architecture that takes the OSM file for the planet and turns it into a single file containing all the tiles for the world. This can scale to daily updates, but not much faster. To do minutely updates we need to generate tiles one-by-one, since they change one-by-one. When combined with the caching requirements for osm.org, this is something no existing software solved.

For some time I’ve been working on Tilekiln, a small piece of software which leverages the existing vector tile generation of PostGIS, the standard geospatial database. Tilekiln is written specifically to meet the unique requirements of a default layer on osm.org. Recently, I’ve been working for the OSMF at setting up minutely updated vector tiles using the Shortbread schema. A schema is a set of definitions for what goes in the vector tiles, and Shortbread is a CC0 licensed schema that anyone can use and there are existing styles for.

My work has progressed to the stage where I’ve set up a demo server with the tiles where they are updated about once a minute. This can be viewed on a demo page and it should be fairly quick up until zoom 13, because everything is pre-generated. If you’re outside Europe it might be a bit slower in places since there’s only one backend server and it’s in Europe.

The real point of this demo is not the map itself, but the tiles behind the map. If you want to try the vector tiles yourself in other software, you can use the URL https://demo.tilekiln.xyz/shortbread_v1/tilejson.json in any software that reads tilejson, or https://demo.tilekiln.xyz/shortbread_v1/{z}/{x}/{y}.mvt for a direct link to the tiles in MVT format. Please test the tiles directly - I’m very interested in unusual use cases!

Another behind the scenes part of the demo is testing monitoring. It’s essential to have adequate monitoring of a system when it’s in production, and Tilekiln comes with an exporter for Prometheus in order to monitor itself. You can view this online or look at an example query like number of z13 and z14 tiles in storage

As with any demo, there are a couple of technical issues. The big one is, as always, documentation. It exists but is not as complete as I would like and there’s no equivalent to the switch2osm guides. The other that you might notice is that the caching isn’t ideal, with caching on my server and then caching on the CDN with Fastly. Some more work needs to be done to optimize cachability and until that’s done it might take 5-15 minutes to see an update even if it’s been done on my server.

There is no SLA for this demo, and I can guarantee it will be offline at times for software updates. When the demo is finished the URLs will stop working, so I don’t recommend releasing software that depends on it. This being said, you’re welcome to use it for any use provided you display OpenStreetMap attribution and aren’t upset when the demo stops.

I’ve been looking at how many tiles are changed when updating OSM data in order to better guide resource estimations, and have completed some benchmarks. This is the technical post with details, I’ll be doing a high-level post later.

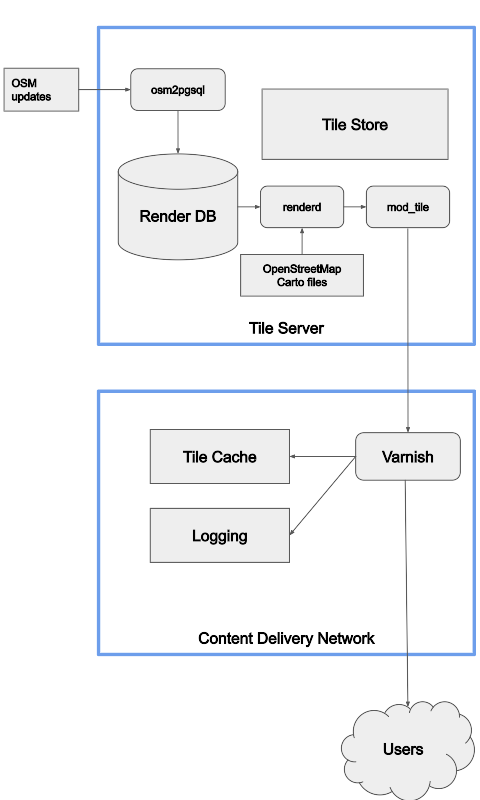
Software like Tilemaker and Planetiler is great for generating a complete set of tiles, updated about once a day, but they can’t handle minutely updates. Most users are fine with daily or slower updates, but OSM.org users are different, and minutely updates are critical for them. All the current minutely ways to generate map tiles involve loading the changes and regenerating tiles when data in them may have changed. I used osm2pgsql, the standard way to load OSM data for rendering, but the results should be applicable to other ways including different schemas.

Using the Shortbread schemea from osm2pgsql-themepark I loaded the data with osm2pgsql and ran updates. osm2pgsql can output a list of changed tiles (“expired tiles”) and I did this for zoom 1 to 14 for each update. Because I was running this on real data sometimes an update took longer than 60 seconds to process if it was particularly large, and in this case the next run would combine multiple updates from OSM. Combining multiple updates reduces how much work the server has to do at the cost of less frequent updates, and this has been well documented since 2012, but no one has looked at the impact from combining tiles.

To do this testing I was using a Hezner server with 2x1TB NVMe drives in RAID0, 64GB of RAM, and an Intel i7-8700 @ 3.2 GHz. Osm2pgsql 1.10 was used, the latest version at the time. The version of themepark was equivalent to the latest version

The updates were run for a week from 2023-12-30T08:24:00Z to 2024-01-06T20:31:45Z. There were some interruptions in the updates, but I did an update without expiring tiles after the interruptions so they wouldn’t impact the results.

To run the updates I used a simple shell script

#!/bin/bash
set -e
while :
do
SEQUENCE=$(osm2pgsql-replication status -d shortbread --json | jq '.local.sequence')
osm2pgsql-replication update -d shortbread --once -- --expire-tiles=1-14 -o "expire_files/$SEQUENCE.txt"
sleep 60
done

Normally I’d set up a systemd service and timer as described in the manual, but this setup was an unusual test where I didn’t want it to automatically restart.

I then used grep to count the number by zoom in each file, creating lists for each zoom.

for z in `seq 1 14`; do
find "$@" -type f -exec grep -Ech "^$z/" {} + >> $z.txt
done

This let me use a crude script to get percentiles and the mean, and assemble them into a CSV.

#!/usr/bin/env python3
import numpy
import sys
nums = numpy.fromfile(sys.argv[1], dtype=int, sep=' ')
mean = numpy.mean(nums)
percentiles = numpy.percentile(nums, [0, 1, 5, 25, 50, 75, 95, 99, 100])
numpy.set_printoptions(precision=2, suppress=True, floatmode='fixed')
print(str(mean) + ',' + ','.join([str(p) for p in percentiles]))

A look at the percentiles for zoom 14 immediately reveals some outliers, with a mean of 249 tiles, median of 113, p99 of 6854, and p100 of 101824. I was curious what was making this so large and found the p100 was with sequence number 5880335, which was also the largest diff. This diff was surrounded by normal sized diffs, so it wasn’t a lot of data. The data consumed would have been the diff 005/880/336

A bit of shell magic got me a list of changesets that did something other than add a node: osmium cat 005880336.osc.gz -f opl| egrep -v '^n[[:digit:]]+ v1' | cut -d ' ' -f 4 | sort | uniq | sed 's/c\(.*\)/\1/' Looking at the changesets with achavi, 145229319 stood out as taking some time to load. Two of the nodes modified were information boards that were part of the Belarus - Ukraine border and Belarus-Russia border. Thus, this changeset changed the Russia, Ukraine, and Belarus polygons. As these are large polygons, only the tiles along the edge were considered dirty, but this is still a lot of tiles!

After validating that the results make sense, I got the following means and percentiles, which may be useful to others.

Tiles per minute, with updates every minute

zoom mean p0 p1 p5 p25 p50 p75 p95 p99 p100
z1 3.3 1 2 2 3 3 4 4 4 4
z2 5.1 1 2.6 3 4 5 6 7 7 10
z3 9.1 1 4 5 8 9 11 13 15 24
z4 12.8 1 5 7 10 12 15 20 24 52
z5 17.1 1 5 8 13 17 20 28 35 114
z6 21.7 1 6 9 15 21 26 37 48 262
z7 25.6 1 6 9 17 24 31 46 63 591
z8 29.2 1 6 9 17 26 34 55 92 1299
z9 34.5 1 6 10 18 28 37 64 173 2699
z10 44.6 1 7 10 20 31 41 80 330 5588
z11 65.6 1 7 12 23 35 49 125 668 11639
z12 111 1 8 14 29 44 64 238 1409 24506
z13 215 1 10 18 40 64 102 527 3150 52824
z14 468 1 14 27 66 113 199 1224 7306 119801

Based on historical OpenStreetMap Carto data the capacity of a rendering server is about 1 req/s per hardware thread. Current performance is slower, but includes The new OSMF general purpose servers are mid-range servers and have 80 threads, so should be able to render about 4800 tiles per second. This means that approximately 95% of the time the server will be able to complete re-rendering tiles within the 60 seconds between updates. A couple of times an hour it will be slower.

As mentioned earlier, when updates take over 60 seconds, multiple updates combine into one and reduce the amount of work to be done. I simulated this by merging every k files together. Contuining the theme of patched-together scripts I did this with a shell script, based on StackExchange

k=2
indir="expire_files_2/"
dir="expire_2_mod$k"

readarray -td $'\0' files < <(
   for f in ./"$indir"/*.txt; do
       if [[ -f "$f" ]]; then printf '%s\0' "$f"; fi
   done |
       sort -zV
)

rm -f ./"$dir"/joined-files*.txt
for i in "${!files[@]}"; do
   n=$((i/k+1))
   touch ./"$dir"/joined-files$n.txt
   cat "${files[i]}" ./"$dir"/joined-files$n.txt | sort | uniq > ./"$dir"/joined-files$n.txt
done

Running the results through the same process for percentiles generates numbers in tiles per update - but updates are half as often, so in terms of work done per time, all the numbers need to be divided by k. For a few k, here’s the results.

k=2

zoom mean p0 p1 p5 p25 p50 p75 p95 p99 p100
z1 1.7 0.5 1 1 1.5 1.5 2 2 2 2
z2 2.5 0.5 1 1.5 2 2.5 3 3.5 3.5 5
z3 4.5 0.5 2 2.5 4 4.5 5.5 6.5 7.5 12
z4 6.4 0.5 2.5 3.5 5 6 7.5 10 12.5 26
z5 8.6 0.5 2.5 4 6.5 8.5 10 14 17.5 51
z6 10.9 0.5 2.9 4.5 7.5 10.5 13 18.5 24.5 107
z7 13.0 0.5 3 4.5 8.5 12 15.5 23 32 239
z8 14.9 0.5 3 4.5 9 13 17 27 50 535
z9 17.8 0.5 3 5 9.5 14 18.5 32 97 1127
z10 24 0.5 3 5 10 15.5 20.5 41 192 2347
z11 36 0.5 3.5 6 11.5 17.5 24 65 395 4888
z12 64 0.5 4 7 14.5 22 32 120 844 10338
z13 120 0.5 5 9 20 32 50 265 1786 22379
z14 263 0.5 7 14 33 56 99 617 3988 50912

k=5

zoom mean p0 p1 p5 p25 p50 p75 p95 p99 p100
z1 0.66 0.20 0.40 0.40 0.60 0.60 0.80 0.80 0.80 0.80
z2 1.01 0.20 0.40 0.60 0.80 1.00 1.20 1.40 1.40 2.00
z3 1.82 0.20 0.80 1.00 1.60 1.80 2.20 2.60 3.00 4.60
z4 2.54 0.20 1.00 1.40 2.00 2.40 3.00 4.00 4.80 8.00
z5 3.40 0.20 1.00 1.60 2.60 3.40 4.00 5.40 7.00 18.80
z6 4.31 0.20 1.02 1.80 3.20 4.20 5.20 7.40 9.80 42.60
z7 5.08 0.20 1.20 1.80 3.40 4.80 6.20 9.20 12.60 93.60
z8 5.78 0.20 1.20 1.80 3.40 5.20 6.80 11.00 18.93 206.20
z9 6.78 0.20 1.20 2.00 3.60 5.60 7.40 13.00 35.40 430.40
z10 8.73 0.20 1.40 2.00 4.00 6.20 8.20 16.40 67.48 895.20
z11 12.76 0.20 1.40 2.40 4.60 7.00 9.60 25.16 150.32 1,865.40
z12 21.60 0.40 1.60 2.80 5.80 8.80 12.80 47.00 328.89 3,932.40
z13 41.88 0.40 2.00 3.60 8.00 12.80 20.60 102.08 712.36 8,486.80
z14 91.76 0.40 2.80 5.40 13.00 22.80 40.40 239.88 1,597.66 19,274.40

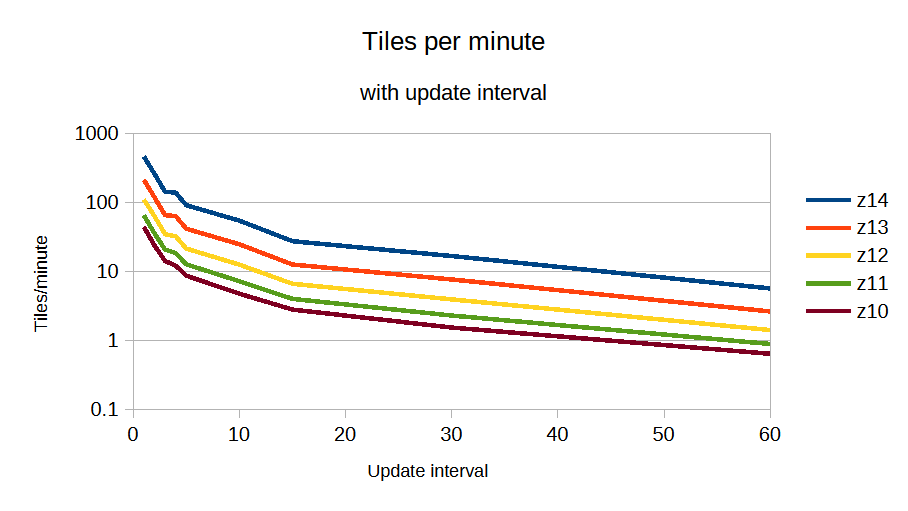
Finally, we can reproduce the Geofabrik graph, looking at tiles per minute with update interval and get approximately work ∝ update ^ -1.05, where update is the number of minutes between updates. This means combining multiple updates is very effective at reducing load.

Usage of standard layer in May

Aggregating Fastly logs

Posted by pnorman on 1 September 2023 in English.

The Standard Tile Layer has a lot of traffic. On August 1st, a typical day, it had 2.8 billion requests served by Fastly, about 32 thousand a second. The challenges of scaling to this size are documented elsewhere, and we handle the traffic reliably, but something we don’t often talk about is the logging. In some cases, you could log a random sample of requests but that comes with downsides like obscuring low frequency events, and preventing some kinds of log analysis. Critically, we publish data that depends on logging all requests.

We query our logs with Athena, a hosted version of Presto, a SQL engine that, among features, can query files on an object store like S3. Automated queries are run with tilelog, which publishes files daily to generate published files on usage of the standard tile layer.

As you might imagine, 2.8 billion requests is a lot of log data. Fastly offers a number of logging options, and we publish compressed CSV logs to Amazon S3. These logs are large, and suffer a few problems for long-term use because they:

  1. contain personal information like request details and IPs, that, although essential for running the service, cannot be retained forever;
  2. contain invalid requests, making analysis more difficult;
  3. are large, being 136 GB/day; and
  4. become slow to query, being compressed gzip files with the only indexing being the date and hour of the request, which is part of the file path.

To solve these problems we reformat, filter, and aggregate logs which lets us delete old logs. We’ve done the first two for some time, and are now doing the third.

The first step is to filter out non-tile requests, rejected requests, and convert to a better data format for querying. Tilelog does this by running a SQL query to update the successful request logs based on the raw request logs. This query filters to just successful tile requests, converts paths to x/y/z coordinates, and converts text to numbers where applicable. This cuts the file size in half to 71 GB/day, but critically improves query performance because Parquet is both faster to parse than gzipped csv and is a columnar store. Columnar stores are good for queries which only fetch data from some columns. Since all the queries we normally run fetch data from all rows but only some columns, this is a huge performance boost because less data needs to be read.

For a long time this was all the filtering that was done, but because each successful request results in a row, they’re still large log files. Additionally, they retain personal information which cannot be retained forever.

To reduce data volumes and personal information further, we need to know what information is useful long-term. Experience has shown that queries run on historic data are of two types

  1. tile focused, where the query is trying to answer a question about what tiles are accessed; or
  2. request focused, where the query is looking at what software has been requesting tiles, but doesn’t need to know which tiles were accessed.

The first requires a more detailed version of the tile request logs which have how many requests have been made for each tile. This is done by a query that aggregates based on tile, time up to the hour, approximate requestor region, and Fastly datacenter. This brings the size down to 17 GB/day. This is enough information to create tile view animations which show how tiles are accessed around the globe.

The second is more focused on abuse prevention and historical analysis of what software uses the standard layer. For this, a query that aggregates based on time up to the hour, requestor information, and HTTP headers is used. This brings the size down to 8 GB/day.

Maxar usage over the last year

Posted by pnorman on 8 July 2023 in English. Last updated on 9 July 2023.

I was curious about the usage of Maxar over the last year, so did some quick work to see where it was used. To start, I used a Python 3 version of ChangesetMD to load the latest changesets into PostgreSQL, using the -g option to create geometries.

I then, with a bit of manual work, identified the changesets of the last year are those between 122852000 and 137769483. Using this, and knowledge of tags normally used with maxar, I created a materialized view with just the Maxar changesets

CREATE MATERALIZED VIEW maxar AS
SELECT id,
    num_changes,
    st_centroid(geom)
FROM osm_changeset
WHERE id BETWEEN 122852000 and 137769483
    AND (tags->'source' ILIKE '%maxar%' AND tags->'imagery_used' ILIKE '%maxar%');

This created a table of 2713316 changesets, which is too many to directly view, so I needed to get it by country.

I did this with the border data from country-coder

curl -OL 'https://raw.githubusercontent.com/rapideditor/country-coder/main/src/data/borders.json'
ogr2ogr -f PostgreSQL PG:dbname=changesetmd borders.json

This loaded a quick and dirty method of determining the point a country is in into the DB, allowing me to join the tables together

SELECT COALESCE(iso1a2, country), COUNT(*)
FROM maxar JOIN borders ON ST_Within(maxar.st_centroid, borders.wkb_geometry)
GROUP BY COALESCE(iso1a2, country)
ORDER BY COUNT(*) DESC;
coalesce count
IN 253789
ID 138214
TR 131282
BR 121062
SV 102280
GT 100412
TZ 86890
RU 71243
US 69600
BD 60622
ZM 60130
CN 58226
NG 55355
SY 49353
PH 46432
CD 45216
AE 40728
MW 40710
PE 37037
SE 33762
UA 33664
MX 33012
HN 32385
NP 31692
KE 30045
MY 27224
RO 26477
MG 24456
ZA 24262
CO 23876
BY 20925
AR 20264
VN 20203
GB 19687
DE 19613
UG 19534
LY 18980
KZ 18037
TH 17879
SA 17270
PK 17161
EG 16848
ET 16406
AU 16134
IQ 15819
AF 15404
IT 15283
SO 14745
SD 14346
CA 14223
EC 13919
ML 13417
QA 12379
CL 11902
HU 11284
IR 10899
TG 10533
TL 10364

This usage includes a period of time at the end where Maxar was not working, which is still the case. It’s also a very quick and dirty method designed to minimize the amount of time I had to do stuff, at the cost of spending more computer time. ChangesetMD is unmaintained and loading all the changesets is slow, but I already knew how to use it, so it didn’t take me much time.

Tilelog country data

Posted by pnorman on 22 May 2023 in English.

I added functionality to tilelog to generate per-country usage information for the OSMF Standard Map Layer. The output of this is a CSV file, generated every day, which contains country code, number of unique IPs that day, tiles per second, and tiles per second that were a cache miss, all for each country code.

With a bit of work, I manipulated the files to give me the usage from the 10 countries with the most usage, for the first four months of 2023.

Tile usage per country by date

Perhaps more interesting is looking at the usage for each country by the day of week.

Tile usage per country by date

The Operations Working Group is looking at what it take to deprecate HTTP Basic Auth and OAuth 1.0a in favour of OAuth 2.0 on the main API in order to improve security and reduce code maintenance.

Some of the libraries that the software powering the API relies on for OAuth 1.0a are unmaintained, there is currently a need to maintain two parallel OAuth interfaces, and HTTP Basic Auth requires bad password management practices. OAuth 2.0 libraries should be available for every major language.

We do not yet have a timeline for this, but do not expect to shut off either this year. Before action is taken, we will send out more notifications. Deprecation may be incremental, e.g., we may shut off creation of new applications as an earlier step.

What can you do to help?

If you are developing new software that interacts with the OSM API, use OAuth 2.0 from the start. Non-editing software can require authentication support, e.g. software that checks if you have an OSM login.

If you maintain existing software, then look into OAuth 2.0 libraries that can replace your OAuth 1.0a ones. We do not recommend implementing support for either protocol version “by hand”, as libraries are readily available and history has shown that implementing your own support is prone to errors.

If you do not develop software that interacts with the OSM API, this change will not directly impact you. You may need to update software you use at some point.

I have been developing Street Spirit, a new style using OpenStreetMap data. It uses Maplibre GL for client side rendering of MVTs generated by Tilekiln, which supports minutely updates using the standard osm2pgsql toolchain.

To focus style development, I have set its aims as being suitable for

  • use as a locator map,
  • to show off what can be done with OpenStreetMap data,
  • to be up-to-date with the latest OpenStreetMap data, and
  • using to orient a viewer to a location they are at.

Although not complete - if a style can ever said to be complete - it is at the point where there’s enough features to give the overall feel of the map, at least for zooms 12 and higher. Lower zooms are missing many features still, particularly roads and rail and some landcover and other fills.

Because the style has a more clearly defined purpose, I’ve been able to use more of the colour pallet than many other styles, particularly compared to styles designed for overlaying other data on top of.

I’ve set up a dev instance on one of my servers, using OSM data from 2023-02-27. Have an explore around.

Some of the bigger areas that need work are

  • Missing mid- and low-zoom features
  • Missing fills
  • A consistent set of POI icons
  • More POIs

If you’re interested in contributing to the work, let me know. Contributing will require some technical knowledge in the following areas

  • MapLibre GL style specification, focusing on layers and expressions, including data-driven expressions;
  • YAML, in particular appropriate indentation for arrays. MapLibre GL styles tend to feature deeply nested arrays; and
  • SQL for writing read-only PostGIS queries if modifying vector tiles.

OpenStreetMap Carto release v5.7.0

Posted by pnorman on 11 January 2023 in English.

Dear all,

Today, v5.7.0 of the OpenStreetMap Carto stylesheet (the default stylesheet on the OSM website) has been released. Once changes are deployed on openstreetmap.org it will take couple of days before all tiles show the new rendering.

Changes include - Unpaved roads are now indicated on the map (#3399)

  • Country label placement improved, particularly for countries in the north (#4616)

  • Added elevation to wilderness huts (#4648)

  • New index for low-zoom performance (#4617)

  • Added a script to switch between script variations for CJK languages (#4707)

  • Ordering fixes for piers (#4703)

  • Numerous CI improvements

Thanks to all the contributors for this release, including wyskoj, tjur0, depth221, SlowMo24, altilunium, and cklein05, all new contributors.

For a full list of commits, see https://github.com/gravitystorm/openstreetmap-carto/compare/v5.6.2…v5.7.0

As always, we welcome any bug reports at https://github.com/gravitystorm/openstreetmap-carto/issues

OSM usage by country

Posted by pnorman on 22 November 2022 in English.

I gathered some statistics about usage of the website and tiles in 2022Q3.

I looked at total tile.osm.org usage, tile.osm.org usage from osm.org itself, osm.org visits, and osm.org unique visitors.

Here’s the data for the top 20 countries.

country osm.org tile requests total tile requests Website visits Website unique Visitors
DE 17.79% 7.78% 8.27% 7.98%
RU 12.23% 8.49% 2.47% 2.43%
US 8.72% 9.22% 13.11% 13.56%
PL 7.69% 4.99% 3.09% 2.80%
GB 4.85% 3.68% 4.42% 4.42%
FR 4.79% 7.00% 3.91% 3.94%
NL 3.62% 3.31% 2.17% 2.09%
IT 3.49% 3.46% 4.74% 4.86%
IN 2.64% 2.66% 3.67% 3.16%
CN 2.62% 0.79% 2.65% 2.72%
AT 2.03% 0.89% 0.98% 0.91%
UA 1.78% 1.98% 1.20% 1.21%
CH 1.41% 0.71% 0.83% 0.82%
CA 1.29% 1.59% 1.36% 1.39%
BE 1.29% 1.06% 1.10% 1.03%
ES 1.27% 2.41% 2.32% 2.39%
JP 1.10% 1.54% 1.74% 1.71%
AU 1.09% 0.92% 0.88% 0.82%
SE 0.91% 0.95% 0.87% 0.88%
FI 0.89% 0.74% 0.74% 0.71%

I’ve put the full data into a gist on github

OpenStreetMap Carto release v5.6.1

Posted by pnorman on 12 August 2022 in English.

Dear all,

Today, v5.6.1 of the OpenStreetMap Carto stylesheet (the default stylesheet on the OSM website) has been released. Once changes are deployed on the openstreetmap.org it will take couple of days before all tiles show the new rendering.

Changes include

  • Fixing rendering of water bodies on zooms 0 to 4

Thanks to all the contributors for this release.

For a full list of commits, see https://github.com/gravitystorm/openstreetmap-carto/compare/v5.6.0…v5.6.1

As always, we welcome any bug reports at https://github.com/gravitystorm/openstreetmap-carto/issues

OpenStreetMap Carto release v5.6.0

Posted by pnorman on 3 August 2022 in English.

Dear all,

Today, v5.6.0 of the OpenStreetMap Carto stylesheet (the default stylesheet on the OSM website) has been released. Once changes are deployed on the openstreetmap.org it will take couple of days before all tiles show the new rendering.

Changes include

  • using locally installed fonts instead of system fonts, for more up to date fonts;
  • changing tree and tree row colours to the same colour as areas with trees;
  • rendering parcel lockers; and
  • rendering name labels of bays and straights from z14 only, and lakes from z5

Thanks to all the contributors for this release including GoutamVerma, yvecai, ttomasz, and Indieberrie, new contributors.

For a full list of commits, see https://github.com/gravitystorm/openstreetmap-carto/compare/v5.5.1…v5.6.0

As always, we welcome any bug reports at https://github.com/gravitystorm/openstreetmap-carto/issues

OpenStreetMap Carto could use more help reviewing pull requests, so if you’re able to, please head over to Github and review some of the open PRs.

This is a bit less OpenStreetMap related then normal, but has to do with the Standard Tile Layer and an outage we had this month.

On July 18th, the Standard Tile Layer experienced degraded service, with 4% of traffic resulting in errors for 2.5 hours. A significant factor in the time to resolve the incident was a lack of visibility of the health status of the rendering servers. The architecture consists of a content delivery network (CDN) hosted by Fastly, backed by 7 rendering servers. Fastly, like most CDNs, offers automatic failover of backends by fetching a URL on the backend server and checking its response. If the response fails, it will shift traffic to a different backend.

A bug in Apache resulted in the servers being able to handle only a reduced number of connections, causing a server to fail the health check, diverting all load to another server. This repeated with multiple servers, sending the load between them until the first server responded to the health check again because it had zero load. Because the servers were responding to most of the manually issued health checks and we had no visibility into how each Fastly node was directing its traffic, it took longer to find the cause than it should have.

Our normal monitoring is provided by Statuscake, but this wasn’t enough here. Instead of increasing the monitoring, we wanted to make use of the existing Fastly healthchecks, which probe the servers from 90 different CDN points. Besides being a vastly higher volume of checks, this more directly monitors the health checks that matter for the service

During the incident, Fastly support provided some details on how to monitor health check status. Based on this guide, the OWG has set up an API on the tile CDN to indicate backend health, and monitoring to track this across all POPs.

Fastly uses a modified version of Varnish, which supports VCL for configuration. This is a powerful language, which lets us do sophisticated load-balancing, and in this case, even create an API directly on the CDN.

We start with a custom VCL snippet within the recv subroutine that directs requests to the API endpoint to a custom error

if (req.url.path ~"^/fastly/api/hc-status") {
  error 660;
}

Next, we make another VCL snippet within the error subroutine that manually assembles a JSON response indicating the servers’ statuses, as well as headers with the same information

 if (obj.status == 660) {
  # 0 = unhealthy, 1 = healthy
  synthetic "{" LF
      {"  "timestamp": ""} now {"","} LF
      {"  "pop": ""} server.datacenter {"","} LF
      {"  "healthy" : {"} LF
      {"    "ysera": "} backend.F_ysera.healthy {","} LF
      {"    "odin": "} backend.F_odin.healthy {","} LF
      {"    "culebre": "} backend.F_culebre.healthy {","} LF
      {"    "nidhogg": "} backend.F_nidhogg.healthy {","} LF
      {"    "pyrene": "} backend.F_pyrene.healthy {","} LF
      {"    "bowser": "} backend.F_bowser.healthy {","} LF
      {"    "baleron": "} backend.F_balerion.healthy LF
      {"  }"} LF
      {"}"};
  set obj.status = 200;
  set obj.response = "OK";
  set obj.http.content-type = "application/json";
  set obj.http.x-hcstatus-ysera = backend.F_ysera.healthy;
  set obj.http.x-hcstatus-odin = backend.F_odin.healthy;
  set obj.http.x-hcstatus-culebre = backend.F_culebre.healthy;
  set obj.http.x-hcstatus-nidhogg = backend.F_nidhogg.healthy;
  set obj.http.x-hcstatus-pyrene = backend.F_pyrene.healthy;
  set obj.http.x-hcstatus-bowser = backend.F_bowser.healthy;
  set obj.http.x-hcstatus-balerion = backend.F_balerion.healthy;
  return (deliver);
}

This API can be manually viewed to show the status, but it only works from the CDN node you’re connecting through. To monitor all of the nodes at once, we use the Fastly edge_check endpoint. When called with an authorized token, the response looks something like

[
  {
    "pop": "frankfurt-de",
    "server": "cache-fra19139"
    },
    "response": {
      "headers": {
        "x-hcstatus-ysera": "1",
        "x-hcstatus-odin": "1",
        "x-hcstatus-culebre": "1",
        "x-hcstatus-nidhogg": "1",
        "x-hcstatus-pyrene": "1",
        "x-hcstatus-bowser": "1",
        "x-hcstatus-balerion": "1"
      },
      "status": 200
    }
  },

  {
    "pop": "yvr-vancouver-ca",
    "server": "cache-yvr1528"
    },
    "response": {
      "headers": {
        "x-hcstatus-ysera": "1",
        "x-hcstatus-odin": "1",
        "x-hcstatus-culebre": "1",
        "x-hcstatus-nidhogg": "1",
        "x-hcstatus-pyrene": "1",
        "x-hcstatus-bowser": "1",
        "x-hcstatus-balerion": "1"
      },
      "status": 200
    }
  }
]

The real response has a lot more headers and other information in it, as well as another 90 POPs, but what I’ve shown is the important information. This is all the information required, but it’s not in a very useful form. To make it useful, we need to gather the data with our monitoring tool Prometheus. This is done with a simple prometheus exporter that queries the URL, parses the response, and writes out metrics. Once the metrics are in Prometheus, we can do alerting on them and graph them.

Because the metrics are 1 or 0, taking the average with avg(fastly_healthcheck_status{host="tile.openstreetmap.org"}) by (backend) gives a graph indicating the backend status, as measured by Fastly POP healthchecks. This graph is now on the Tile Rendering Dashboard.

OpenStreetMap Carto Release v5.5.1

Posted by pnorman on 13 July 2022 in English.

Dear all,

Today, v5.5.1 of the OpenStreetMap Carto stylesheet (the default stylesheet on the OSM website) has been released. Once changes are deployed on the openstreetmap.org it will take couple of days before all tiles show the new rendering.

The one change is a bugfix to the colour of gates (#4600)

For a full list of commits, see https://github.com/gravitystorm/openstreetmap-carto/compare/v5.5.0…v5.5.1

As always, we welcome any bug reports at https://github.com/gravitystorm/openstreetmap-carto/issues

OpenStreetMap Carto release v5.5.0

Posted by pnorman on 10 July 2022 in English.

Dear all,

Today, v5.5.0 of the OpenStreetMap Carto stylesheet (the default stylesheet on the OSM website) has been released. Once changes are deployed on the openstreetmap.org it will take couple of days before all tiles show the new rendering.

Changes include

  • Fixed colour mismatch of car repair shop icon and text (#4535)

  • Cleaned up SVG files to better align with Mapnik requirements (#4457)

  • Allow Docker builds on ARM machines (e.g. new Apple laptops) (#4539)

  • Allow file:// URLs in external data config and caching of downloaded files (#4468, #4153, #4584)

  • Render mountain passes (#4121)

  • Don’t use a cross symbol for more Christian denominations that don’t use a cross (#4587)

Thanks to all the contributors for this release, including stephan2012, endim8, danieldegroot2, and jacekkow, new contributors.

For a full list of commits, see https://github.com/gravitystorm/openstreetmap-carto/compare/v5.4.0…v5.5.0

As always, we welcome any bug reports at https://github.com/gravitystorm/openstreetmap-carto/issues

I’m working on publishing a summary of sites using tile.osm.org and want to know what format would be most useful for people.

The information I’ll be publishing is requests/second, requests/second that were cache misses, and domain. The first two are guaranteed to be numbers, while the last one is a string that will typically be a domain name like www.openstreetmap.org, but could theoretically contain a poisoned value like a space.

The existing logs which have tiles and number of requests are formatted as z/x/y N where z/x/y are tile coordinates and N is the number of accesses.

My first thought was TPS TPS_MISS DOMAIN, space-separated like the existing logs. This would work, with the downside that it’s not very future proof. Because the domain can theoretically have a space, it has to be last. This means that any future additions will require re-ordering the columns, breaking existing usage. Additionally, I’d really prefer to have the domain at the start of the line.

A couple of options are - CSV, with escaping - tab-delimited

Potential users, what would work well with the languages and libraries you prefer?

An example of the output right now is

1453.99 464.1 www.openstreetmap.org  
310.3 26.29 localhost
136.46 39.68 dro.routesmart.com
123.65 18.54 www.openrailwaymap.org
107.98 0.05 www.ad-production-stage.com
96.64 1.78 r.onliner.by
91.42 0.16 solagro.org
87.83 1.53 tvil.ru
84.88 12.98 eae.opekepe.gov.gr
74.0 2.32 www.mondialrelay.fr
63.44 1.93 www.lightningmaps.org
63.22 14.01 nakarte.me
55.1 0.74 qualp.com.br
52.77 11.25 apps.sentinel-hub.com
46.68 4.07 127.0.0.1
46.3 1.96 www.gites-de-france.com
43.47 1.15 www.anwb.nl
42.46 10.52 dacota.lyft.net
41.13 6.63 www.esri.com
40.84 0.69 busti.me

The OpenStreetMap Foundation runs several services subject to usage policies.

If you violate the policies, you might be automatically or manually blocked, so I decided to write a post to help community members answering questions from people who got blocked. If you’re a blocked user, the best place to ask is in the IRC channel #osm-dev on irc.oftc.net. Stick around awhile to get an answer.

The most important question is which API is being used. For this, look at the URL you’re calling.

If the URL contains nominatim.openstreetmap.org, review the usage policy. The most common cause of being blocked is bulk geocoding exceeding 1 request per second. Going over this will trigger automatic IP blocks. These are automatically lifted after several hours, so stop your process, fix it, wait, and then you won’t be blocked.

If you’re using nominatim but not exceeding 1 request per second, to get help you should provide the URL you’re calling, the HTTP User-Agent or Referer you’re sending, the IP you’re requesting from, and the HTTP response code.

If you’re calling tile.openstreetmap.org or displaying a map, review the tile usage policy. The most common causes of being blocked is tile scraping or apps that don’t follow the usage policy.

To get help you should provide where the map is being viewed (e.g. an app, website, or something else), the HTTP User-Agent or Referer you’re sending, the IP you’re requesting from, and the HTTP response code. For a website, you can generally get this information through the browser’s developer tools. The tile.openstreetmap.org debug page will also show you you this information.

If you’re having problems with an app that you’re not the developer of, you’ll often need to contact them, as they are responsible for correctly calling the services.

OpenStreetMap Carto release v5.4.0

Posted by pnorman on 23 September 2021 in English.

Dear all,

Today, v5.4.0 of the OpenStreetMap Carto stylesheet (the default stylesheet on the OSM website) has been released. Once changes are deployed on the openstreetmap.org it will take couple of days before all tiles show the new rendering.

Changes include

  • Added a new planet_osm_line_label index (#4381)
  • Updated Docker development setup to use offical PostGIS images (#4294)
  • Fixed endline conversion issues with python setup scripts on Windows (#4330)
  • Added detailed rendering of golf courses (#4381, #4467)
  • De-emphasized street-side parking (#4301)
  • Changed subway stations to start text rendering at z15 (#4392)
  • Updated road shield generation scripts to Python 3 (#4453)
  • Updated external data loading script to support pyscopg2 2.9.1 (#4451)
  • Stopped displaying tourism=information with unknown information values
  • Switched the Natural Earth URL to point at its new location (#4466)
  • Added more logging to the external data loading script (#4472)

Thanks to all the contributors for this release including ZeLonewolf, kolgza, and map-per, new contributors

For a full list of commits, see https://github.com/gravitystorm/openstreetmap-carto/compare/v5.3.1…v5.4.0

As always, we welcome any bug reports at https://github.com/gravitystorm/openstreetmap-carto/issues

OpenStreetMap Standard Layer: Requests

Posted by pnorman on 29 July 2021 in English. Last updated on 30 July 2021.

This blog post is a version of my recent SOTM 2021 presentation on the OpenStreetMap Standard Layer and who’s using it.

With the switch to a commercial CDN, we’ve improved our logging significantly and now have the tools to log and analyze logs. We log information on both the incoming request and our response to it.

We log

  • user-agent, the program requesting the map tile;
  • referrer, the website containing a map;
  • some additional headers;
  • country and region;
  • network information;
  • HTTP protocol and TLS version;
  • response type;
  • duration;
  • size;
  • cache hit status;
  • datacenter;
  • and backend rendering server

We log enough information to see what sites and programs are using the map, and additional debugging information. Our logs can easily be analyzed with a hosted Presto system, which allows querying large amounts of data in logfiles.

I couldn’t do this talk without the ability to easily query this data and dive into the logs. So, let’s take a look at what the logs tell us for two weeks in May.

Usage of standard layer in May

Although the standard layer is used around the world, most of the usage correlates to when people are awake in the US and Europe. It’s tricky to break this down in more detail because we don’t currently log timezones. We’ve added logging information which might make this easier in the future.

Based off of UTC time, which is close to European standard time, weekdays average 30 000 requests per second incoming while weekends average 21 000. The peaks, visible on the graph, show a greater difference. This is because the load on weekends is spread out over more of the day.

On average over the month we serve 27 000 requests per second, and of these, about 7 000 are blocked.

Blocked Requests

Seven thousand requests per second is a lot of blocked requests. We block programs that give bad requests or don’t follow the tile usage policy, mainly

  • those which lie about what they are,
  • invalid requests,
  • misconfigured programs, or
  • scrapers trying to download everything

They get served

  • HTTP 400 Bad Request if invalid,
  • HTTP 403 Forbidden if misconfigured,
  • HTTP 418 I'm a teapot if pretending to be a different client, or
  • HTTP 429 Too Many Requests if they are automatically blocked for making excessive requests by scraping.

Before blocking we attempt to contact them, but this doesn’t always work if they’re hiding who they are, or they frequently don’t respond.

HTTP 400 responses are for tiles that don’t exist and will never exist. A quarter of these are for zoom 20, which we’ve never served.

For the HTTP 403 blocked requests, most are not sending a user-agent, a required piece of information. The others are a mix of blocked apps and generic user-agents which don’t allow us to identify the app.

Fake requests get a HTTP 418 response, and they’re nearly all scrapers pretending to be browsers.

May blocked chart

In July we added automatic blocking of IPs that were scraping the standard layer, responding with HTTP 429 IPs that are requesting way too many tiles from the backend. This only catches scrapers, but a tiny 0.001% of users were causing 13% of the load, and 0.1% of QGIS users causing 38% of QGIS load.

July blocked chart

This blog post is a version of my recent SOTM 2021 presentation on the OpenStreetMap Standard Layer and who’s using it.

The OpenStreetMap Standard Layer is the default layer on openstreetmap.org, using most of the front page. It’s run by the OpenStreetMap Foundation, and the Operations Working Group is responsible for the planning, organisation and budgeting of OSMF-run services like this one and servers running it. There are other map layers on the front page like Cycle Map and Transport Map, and I encourage you to try them, but they’re not hosted or planned by us.

Technology

At the high level, this is the overview of the technology the OWG is responsible for. The standard layer is divided into million of parts, each of which is called a tile, and we serve tiles.

Flowchart of rendering

OSM updates flow into a tile server, where they go into a database. When a tile is needed, a program called renderd makes and store the tile, and something called mod_tile serves it over the web. We have multiple render servers for redundancy and capacity. We’re completely responsible for these, although some of them run on donated hardware.

In front of the tile server we have a content delivery network. This is a commercial service that caches files closer to the users, serving 90% of user requests. It is much faster and closer to the users, but knows nothing about maps. We’re only responsible for the configuration.

The difference between the tile store and tile cache is how they operate, and size. The tile store is much larger and stores more tiles.

Only the cache misses from the CDN impose a load on our servers. When looking at improving performance of the standard layer, I tend to look at cache misses and how to reduce them.

Policy

The OWG has a tile usage policy that sets out what you can and cannot do with our tile layer. We are in principle happy for our map tiles to be used by external users for creative and unexpected uses, but our priority is providing a quickly updating map to improve the editing cycle. This is a big difference between the standard layer and most other commercially available map layers, which might update weekly or monthly.

We prohibit some acitivities like bulk-downloading tiles for a large area (“scraping”) because it puts an excessive load on our servers. This is because we render tiles on-demand and someone scraping all the tiles in an area is downloading tiles they will never view.

As part of figuring out how to best process standard tile layer logs I had a chance to generate some charts for usage of the OpenStreetMap Standard tile layer on the day of 2021-03-14, UTC time. This was over a weekend, so there are probably differences on a weekday. I’m also only looking at tiles delivered and not including blocked tiles from scrapers and similar usage. All traffic is in tiles per second, averaged over the day.

Countries

I first looked at usage of the layer from users on openstreetmap.org and all users, by country.

Country code osm.org-based traffic total traffic
DE 237.7 1299.54
PL 89.07 674.67
RU 69.97 949.04
US 67.64 1474.47
FR 61.75 1234.47
GB 55.75 628.81
IT 41.32 432.84
NL 40.78 428.73
AT 27.14 115.6
CH 21.84 116.57
UA 19.38 303.38
CN 17.93 330.04
BE 16.95 189.03
CA 15.97 269.16
ES 13.56 353.89
AU 11.26 145.75
JP 11.25 256.9
IN 11.04 223.02
SE 10.42 154.83
FI 10.24 118.19
KZ 9.75 55.72
AR 9.57 263.79
TR 9.46 132.14
HU 9.39 169.86
HK 9.31 130.87
CZ 8.53 158.03
BR 8.19 472.51
ID 7.93 182.18
PH 7.46 53.86
SK 6.89 63
DK 6.73 116.17
RO 5.66 312.97
IR 5.62 300.05
TW 5.37 102.62
KR 5.3 35.72
BY 5.25 68.57
IL 4.89 53.97
HR 4.82 43.07
IQ 4.76 16.92
NO 4.4 59.52
RS 4.33 42.49
NZ 4.15 38.56
CO 4.12 203.94
MX 3.6 190.62
GR 3.28 45.04
PT 3.26 56.45
IE 2.88 64.29
LT 2.81 63.05
TH 2.62 75.52
CL 2.61 55.24
MY 2.54 32.12
VN 2.51 85.74
SI 2.33 19.29
SG 2.32 33.75
EE 2.31 21.87
LU 2.29 9.61
BG 2.12 40.86
LV 2.12 44.77
EG 1.9 29.49
BA 1.7 13.31
BD 1.59 67.94
ZA 1.45 25.32
AE 1.42 19.94
DZ 1.32 18.24
PK 1.26 31.58
PE 1.26 68.36
SA 1.24 40.63
YE 1.14 1.8
MA 1.11 18.1
MD 1.02 12.5

Traffic is very much as I expected, with OSM.org usage generally correlated with users.

Hosts

There’s a few ways to reach the standard tile layer. The recommended one is tile.openstreetmap.org, but there’s the legacy a.tile.openstreetmap.org, b.tile.openstreetmap.org, and c.tile.openstreetmap.org domains, and other domains that alias to the same service. If you’re setting up something new, use only tile.openstreetmap.org and HTTP/2 will handle multiple tile fetches in parallel.

host TPS
a.tile.openstreetmap.org 4251.35
b.tile.openstreetmap.org 3668.94
c.tile.openstreetmap.org 3595.94
tile.openstreetmap.org 2282.77
b.tile.osm.org 225.13
a.tile.osm.org 207.61
c.tile.osm.org 200.73
tile.osm.org 2.25
b.Tile.openstreetmap.org 0
c.Tile.openstreetmap.org 0
a.Tile.openstreetmap.org 0
cdn-fastly-test.tile.openstreetmap.org 0
tile-openstreetmap-org.global.ssl.fastly.net 0

The 0 values are below 0.005 TPS. The last two domains were test domains that might still be cached in some users. There’s more traffic on a.tile.openstreetmap.org than b or c because sometimes people hard-code only one domain.

QGIS

QGIS is one of the major users of the standard tile layer, and we can get a breakdown of versions

version TPS
31800 7.23
31700 2.58
31604 48.73
31603 13.43
31602 3.76
31601 4.71
31600 4.52
31416 4.26
31415 17.13
31401 0.91
31400 1.99
31203 1.91
31202 4.43
31201 3.03
31200 4.63
31014 12.49
31013 1.83
31012 1.66
31011 2.04
31010 3.43
31009 1.04
31008 0.81
31007 1.89
31006 3.35
31005 2.6
31004 6.07
31003 1.88
31002 2.02

Versions before 3.10 used a different format in their user-agent, so I decided to cut the chart off there. Earlier versions contributed 38.54 TPS.