OpenStreetMap

Tomas Straupis's Diary

Recent diary entries

Ambush of OpenStreetMap Hut

Posted by Tomas Straupis on 1 November 2023 in English.

Attack

In the sinister depths of a fellowship of the underground cartographers, known for its dark secrets, two veteran system administrators, Hat-trick and Springbok, had laboured tirelessly to maintain a cursed digital infrastructure for years. Their expertise was revered, their work likened to the dark heart of the company’s success.

On a moonless night, a group of overconfident, so-called dunkrugers challenged Hat-trick and Springbok. These individuals were unaware of the malevolent forces that dwelled within the servers, but their arrogance led them to believe they could control the sinister systems.

Ignoring the administrators’ chilling warnings, they recklessly invaded the server room, meddling with cables and initiating occult-like configurations. Their actions unleashed a torrent of unholy chaos as servers crashed, forbidden data was consumed, maps started to lie, and the very essence of the system unravelled.

Desperation gripped Hat-trick and Springbok, but the spectral destruction could not be halted. The map’s fate was sealed, and the malevolent forces of dunkrugers claimed victory. What remained was a haunted, empty shell of the once-thriving organisation.

After the maps...

Well, ok, this is just some mediocre Halloween story, any resemblance to real-world people or parts of OpenStreetMap is purely coincidental. Nothing like this would ever happen to system administration part of OpenStreetMap. Only people who know how to do it are allowed to make decisions about servers, so that part is rock solid, future is bright here.

However… that is not true about data tagging part… There are even no general guiding principles - only dark chaos. Why is that? That part is not important? Or that part is “easy” and will work anyway?

Cartographic generalisation

Posted by Tomas Straupis on 19 January 2022 in English. Last updated on 24 January 2022.

Generalisation

“Cartographic generalization, or map generalization, <…> is a core part of cartographic design.”

Yet it is quite often unknown or understood incorrectly/partly. This article has a pretty good description of generalisation, it’s purpose, history and main operators with some examples of where OSM-Carto is missing generalisation.

https://en.wikipedia.org/wiki/Cartographic_generalization

In December of 2021 a bi-annual International Cartographic Conference was held in Florence, Italy.

ICC2021

Because of Covid it was a mixed conference, however ~200 people (my estimation, I do not have an official number) have attended on site (with many more participating on-line).

OpenStreetMap was mentioned a lot. This is a good thing, but… the only good thing. It was always mentioned just as a data source. And it seems everybody is taking for granted that OSM data while being heterogenic in saturation is at least in schema (tagging) a consistent thing and slowly smartly evolving, rather than eroding. Nobody new or even expected that schema in OSM can be changed by anybody, even people who have absolutely no clue in Cartography/GIS. And this is not only a possibility, but a reality.

ICC is held by International Cartographic Association (https://icaci.org/) - main worldwide body of professional Cartographers. It has a lot of commissions for different aspects of cartography: map design, atlases, map production, military mapping, generalisation and multiple-representation, maps for people with disabilities etc. etc. And still OpenStreetMap was NOT mentioned for cartography in ANY presentation in any of the directions at all (well, one presenter said “OSM is getting better”).

Why is that? Well it is because OpenStreetMap (community) is not only doing nothing in cartography front, but the whole fabric of OSM is made in a way that anybody trying to do some quality/cartography work is quickly pushed away and whole thing is rampaged by several clueless people running and destroying whatever value is still left in OSM (because there are no means to stop them).

Sad, but without change in governance there will be no change at all.

When preparing geodata for smaller scales, you need generalisation algorithms. Douglas-Peucker and Visvalingam-Whyatt algorithms are usually used for lines (polygons). Unfortunately those are mathematical/geometrical algorithms which do not take into account cartographic requirements.

Wang–Müller algorithm tries to do exactly that - generalise lines (of natural objects) according to cartographic requirements, such as saving or even exaggerating characteristic features.

Original Wang–Müller article has a quite concise description of the algorithm and as there is no open source implementation of this algorithm (to my knowledge) it is impossible to use this algorithm in wider scale and there are a number of unanswered questions on how some particular aspects should work.

A student of Vilnius University, Motiejus Jakštys, has done a perfect job - he has not only implemented the main part of Wang–Müller algorithm using open technologies, but also described the algorithm in his paper, which you can find here:

https://github.com/motiejus/wm/blob/main/mj-msc-full.pdf

Besides describing the algorithm itself (in more detail that original paper), this paper also includes recommendations on values of parameters to use on different scales, a lot of pictures as well as propositions for future work on finishing and refining the open implementation.

Wang–Müller for scale 1:50000

In coming days the work of Motiejus will be forked into Lithuanian Openmap repository where work on this algorithm will be continued and we hope to have a final implementation some time this year.

Topology rules

Posted by Tomas Straupis on 14 April 2021 in English.

Topology

Problem

Once in a while discussion arises in OpenStreetMap: which polygon to render above which. For example we have a large forest and then a lake inside it. What to do? Render water above the forest! Cool! But wait, we have a small island covered with trees in that lake, so rendering water on top of the forest hides that island. What to do? Render forest above the water!… Oh wait…

And you can change water and forest to a lot of others: residential, industrial, meadow, wetland, you name it.

The point is that this cannot be solved by deciding “what has to be rendered above/below what” (well not fully). But if you decide which objects may or may not intersect, which objects must always be covered by which etc. - then you have better described ontology. Then you cut holes in forest/water example above to get not only a correct rendering, but also an often forgotten - correct analysis (for example calculation of water/forest area).

We also have some very small patches of wood/grass inside residential/industrial areas, we do not want to exclude those small patches from residential areas. Not only because it could make landuse geometry too complex, but because those small patches ARE still residential areas, altho covered with something. What do we do with those? We define SEPARATE classes to be used above other classes. Say we define landcover=trees to be used above (and only above) residential, commercial or industrial polygons. The same could go for patches of grass or small basins/ponds. With water we define, that small water objects like landuse=basin can be covered with the likes of landuse=residential, but natural=water (lakes), landuse=reservoir and waterway=riverbank - cannot intersect with landuse=residential.

Solution

It is nothing new. It is a very well known thing in GIS - topology rules. There are a lot of tooplogy rule types, I will not go through all of them, but interested reader could find it in say A* documentation

Example

When those rules are defined (even the small part of those, as it is done in Lithuania: Topology rules) it makes it very clear to everybody - mapers, creators of editors and QA tools, map makers - what goes above/below what.

As an additional bonus, it probably has a cartographic benefit, those small patches of trees/grass above other larger landuse can easily (without complex generalisation calculations) be removed on mid-small scales. Check how small patches of trees are removed on smaller scales removing clutter while larger forest patches are still visible: https://openmap.lt/#m/16.09/54.92935/23.95217/0/0/

With trees on larger scales: With trees

And here without trees on smaller scale: Without trees

Address import in Lithuania

Posted by Tomas Straupis on 5 April 2021 in English.

Lithuanian address cadastre information was opened in October last year. We started importing the data to OSM straight away. Most (90-95%) of addresses could be imported automatically (taking care of existing addresses, putting address on a building when there is only one candidate, removing any excess addresses). Remaining addresses were added semi-automatically using JOSM remote control. This increased the number of addresses from 300 thousand to 1.1 million.

Here is a video of the progress: https://www.youtube.com/watch?v=Eebl0xxT-nM Address import progress

But we quickly found out that importing addresses is the least difficult part. We have a number of QA rules in Lithuania, including:

  • When there is an address with a street S, the way with such name must exist in vicinity
  • When there is an address with a city C, it can only be in admin boundaries of city C

Street name information is part of the dataset being opened, but it is way harder to import that data automatically as ways have to be created, combined, split, moved etc. Another thing was that OpenStreetMap data of street geometry is way more precise, so in some cases only human can correctly specify the geometry of the street. Therefore it was decided to go through ALL streets (highway=residential,unclassified,living_street) and add name or noname tag. Several mappers participated using simple report giving JOSM remote control to streets which needed review closest to their starting point. Each mapper started from their own point. This way more than 25000 ways have been reviewed and necessary data added.

Here is a video of name adding progress: https://www.youtube.com/watch?v=Zc3TQQhO_rA

Admin boundary info was also in the opened dataset. It is also being fixed manually. Still in progress.

Waterway map point generalisation

Posted by Tomas Straupis on 14 August 2020 in English.

Point symbols need generalisation as much as any other type of object, because in small scales they also start competing for the space on the map. Usually (in popular internet maps) the most primitive way of point generalisation is chosen: points are classified, priorities are assigned to classes and then lower priority point is simply not rendered if a point with the higher priority is already rendered in the same space. If there is more than one point with the same piority in the same spot - result is even worse - decision is random.

Such solution is of course not ideal. There are a number of ways to generalise points: displacement, aggregation, symbol combination etc. Only one option, which was chosen for Lithuanian river map, will be described in this entry.

Initial situation is that sometimes rivermap points are so close one to another, that one of them is removed or they overlap:

Overlapping symbols

In the picture above, bridge symbol is over the put_in/egress symbol. Both symbols are important - therefore we cannot remove/overlap any of them. Symbols have to be moved apart to fit both of them.

Order of symbols is also important to the reader of river map. In this particular example it is important to know, that egress point is after the bridge (going down the river). Therefore we choose an option to combine symbols into one and place them in the order of left to right as for reading - objects symbolised on the left side will be encountered before objects on the right.

We get a picture like this:

Combined symbol

More attentive reader will notice, that in this particular situation - when river flows eastwards (from right to left) - direction of reading is the opposite from the geographical position of objects. But we have to understand, that in other places river could be flowing eastwards, nothwards or diagonally - different mixes/rules of depiction would make it harder for map reader to read the map correctly. Another important point - main usage of these combined points is in online map where it would be difficult to change symbols depending on direction of the map, chosen by the map reader.

You can check point generalisation in Lithuanian river map https://openmap.lt.

BalticGIT - SOTM Baltic videos

Posted by Tomas Straupis on 29 April 2020 in English.

Videos of BalticGIT, SOTM Baltic 2020 are on-line:
http://straume.lmt.lv/lv/video-saraksts/Baltijas-GIT
SOTM Baltic was held in auditorium DELTA

Allan Mustard’s presentation „I’m Tired of Getting Lost!“ can be seen in auditorium ALFA (part 1) or you can watch the same presentation in last years NACIS2019:
https://www.youtube.com/watch?v=JpHLulm-Wq4

Waterbody labels

Posted by Tomas Straupis on 5 October 2019 in English.

Labels should intuitively “connect” to their respective object on a map so that map reader could “feel” the stronger connection between the label and waterbody (lake natural=water or reservoir landuse=reservoir). When calculating places for labels in multi-scale (or vario-scale) map, we can distinguish three types of label placement:

  1. Multiple large labels - this is used in large scales where waterbody is so large that a very large label could fit. Usually at that point waterbody is so large that only part of it will be visible to map reader. This means multiple labels could(should?) be placed, trying to calculate the average size of a map view - we would like one and only one label to be visible at one point and as label positions have to be calculated beforehand it is impossible to make precise calculations as maps would be viewed on different devices with different size of map canvas. (There is also an interesting question if such labels should be horizontal or not, if not - how should they be positioned?)
  2. Curved labels - middle scale labels where label can be curved according to the geometry of a waterbody.
  3. Simple labels - small scale labels, where it is no longer possible to have curved labels (as they no longer fit into waterbody) and only simple straight line labels are possible.

Note that type of label depends on a particular scale+waterbody. That is on one scale you could have some waterbodies with large labels, some with curved and some with simple labels. As can be seen here:

Waterbody labels Topographic map of Lithuania

Here you can see a large curved label for lake Želva, smaller curved labels for lakes Gilužis and Trinktinis, and a simple label for lake Lenktinis.

The most interesting are curved labels. While calculating approximate medial axis could look like a good way to get a curve to draw a label on, it has one major disadvantage - you cannot get information on how large your text could be (and what letter spacing you could use). One might think that adding buffer to the line would indicate the possible size of a type, you will still have problems with irregular shape waterbodies, where label should be placed on a side where waterbody is “large enough” for a label (think of a waterbody with a shape of a prolonged triangle).

OpenTopoMap has used a very interesting algorithm to divide a waterbody to squares and then get a curve for a label. You can read about it on Github. This solution can be extended by iterating through different sizes of squares: starting with larger ones - trying to fit large type and then decreasing the size of a square thus trying to fit smaller type. The result of such calculation is seen in the picture above.

Such solution fits most of waterbodies. Even more interesting solutions are required for very irregular shaped waterbodies, say lakes with a shape of U, E etc. Such waterbodies should probable require more than one label placed even in one view as connection between different parts could not be obvious. Note that there is no single accepted cartographic convention if one object should have one label, or it could have more that one label.

Second step in building generalisation is building typification. We take centroid of a building which is deemed too small for a scale, try drawing a minimal acceptable rectangle (oriented to the nearest road) and check if there would be enough free space between it and other already accepted buildings. If so - typified building is accepted, otherwise it is thrown out. Here is an example of buildings simplified and typified up to 20m: Generalised buildings Here original buildings are gray hashed, yellow ones - simplified buildings which are “large enough” for a scale, purple ones - typified buildings (note that some buildings are gone). This way we can avoid drawing random noise/snow in small scale maps: Building noise And convert them to something which communicates information that there are small buildings: Typified buildings As always, you can look at how this works in topographic map of Lithuania. Typification starts at zoom level 15 (5m), then 10m at zoom 14, 20m at 13 and finally 40m at zoom 12.

If buildings are to be placed on a smaller scale maps, they must be prepared: simplified, then typified and finally aggregated/amalgamated.

Building simplification is not the same as line/polygon simplification (done with DP or VW algorithms). When simplifying building, you want characteristic details to remain: for example most buildings have square shapes, that must remain in simplified version.

Example of building simplification:

Building simplification

Here dashed polygon - original building, yellow one - simplified to specified amount.

As you can see square angles have been preserved as well as larger details while smaller details have been removed.

The amount of simplification depends on a resolution of the screen/printer (if a size of a pixel is 10 meters there is no point of trying to depict details smaller than 10 meters) as well as legibility requirements - when too much details is displayed, map reader cannot clearly read the map. If unsimplified buildings are placed on a small scale printed map, they could be visible as some kind of sand or other pattern, not as buildings.

Such building simplification helps not only with the very important criteria in cartography - legibility, but also with some technical details - building polygons have less vertexes, therefore they are rendered faster. While legacy technology of using raster tiles does not suffer too much because of more complex geometries, it is very important with currently used vector tiles - buildings take up much less (sometimes up to 50%) space so are faster to transfer and use less CPU (and battery on mobile) to render them.

You can check the difference in building shape in a live OpenStreetMap topo map (simplification kicks in on zoom less than 14)

When two ways (two railways, or two parts of a motorroad) are close together they start overlapping at some point when going to smaller scale, like railway in this picture: Railway mess

Cartographic fix for this is to make one way instead of two (or more). One of the simplest ways to do that is to create a buffer and then calculate medial axis (standard functionality of PostGIS): Way generalisation 
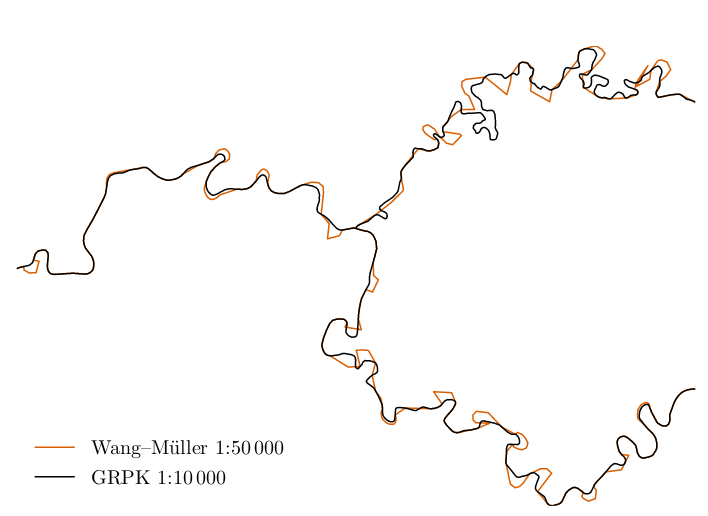
(here blue lines - initial ways, black one - generalised)

This way the map is more legible, and for vector tiles - it is smaller - therefore faster to download and gives less load on cpu on client side: Fixed railway Check the change live in the topographic map 13+ - non generalised ways, 12.99- - generalised ways.

NOTE: The same generalisation operation has to be done with roads.